
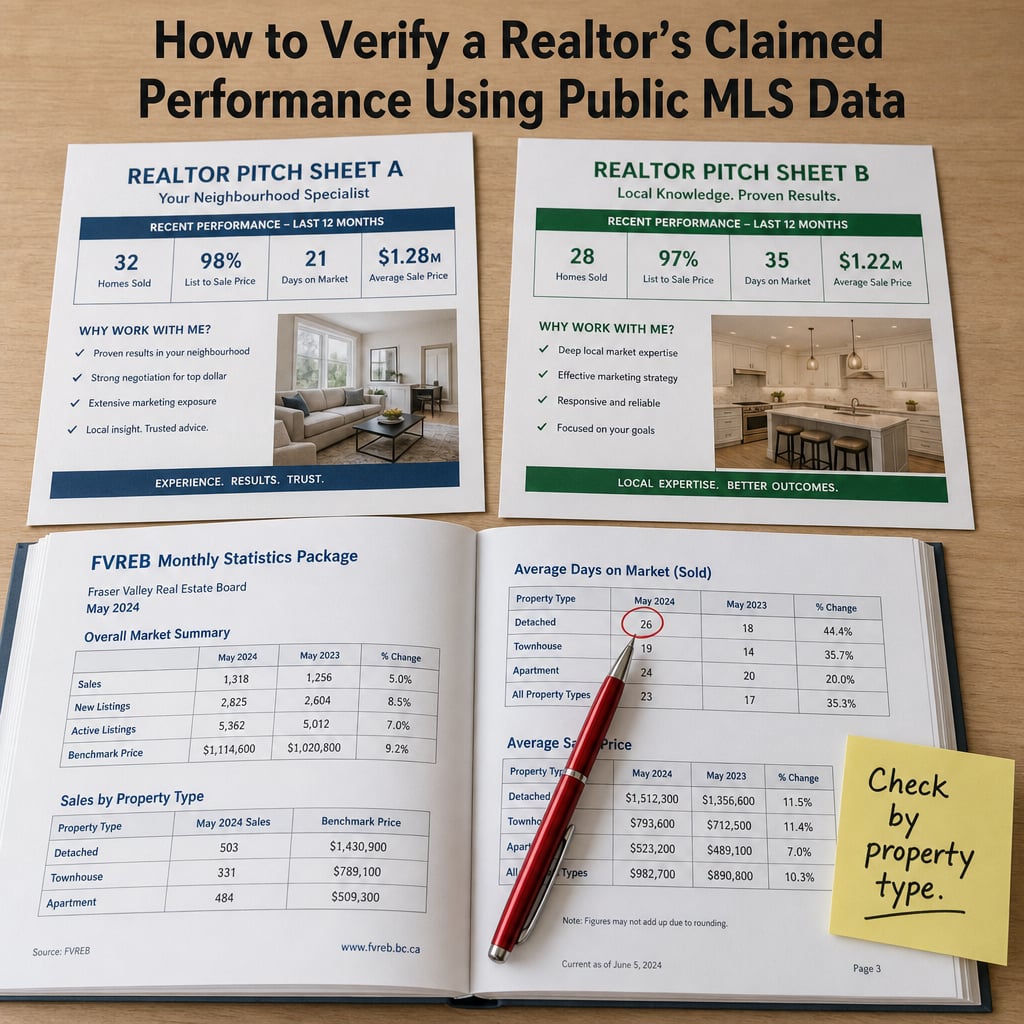

How to Verify a Realtor's Claimed Performance Using Public MLS Data: A Step-by-Step Framework for Comparing Agent Claims Against FVREB and REBGV Sales Records, Days-on-Market Averages, and Neighbourhood-Specific Benchmarks After Your Agent Interviews in 2026
By Mohamed Mansour, MBA and Associate Broker | Mansour Real Estate Group | Fraser Valley and Lower Mainland, BC | Published: July 28, 2026
After interviewing listing agents or buyer's agents, most people in the Fraser Valley have a folder of pitch decks, claimed sold-to-list ratios, and neighbourhood track records — but no clear way to check whether those numbers hold up. This article gives you the exact steps to cross-reference what an agent claims against what the Fraser Valley Real Estate Board and Greater Vancouver Realtors actually publish. It covers which public data sources to use, how to segment by property type and neighbourhood, and what patterns in agent marketing materials reveal about selective framing.
Short Answer
After your agent interviews, download the FVREB or REBGV monthly statistics package for the period the agent claims strength. Compare their sold-to-list ratio, days on market, and neighbourhood performance against the board's published benchmarks for the same property type and community. Claims that do not specify property type and time period are not verifiable — and that gap is usually intentional.
Who This Applies To
- Sellers in Surrey, Langley, Abbotsford, South Surrey, White Rock, North Delta, Cloverdale, Fleetwood, Guildford, Willoughby, or Walnut Grove who have completed agent interviews and received pitch materials
- Buyers in the Fraser Valley or Lower Mainland evaluating agents who have quoted specific days-on-market or offer-success statistics
- Homeowners deciding between two or more agents whose performance claims seem roughly equivalent on paper
- Anyone who suspects an agent's numbers were drawn from a team aggregate, a favourable date range, or a cherry-picked property type
When This Advice May Not Apply
If you are evaluating a newly licensed agent without a sales history, or hiring an agent for a highly unique property type with limited comparables, segment-level benchmarking is less useful. This framework is most effective when an agent has made specific, quantified claims about performance in a neighbourhood and property type you can match against board data.
Key Takeaways
- FVREB and REBGV monthly statistics packages are publicly available and include sales-to-active ratios, benchmark prices, and days-on-market by property type and neighbourhood.
- Fraser Valley townhouse, detached, and condo markets each carry different sales-to-active ratios — an agent's sold-to-list claim is meaningless without specifying all three segments.
- Withdrawn and expired listings are excluded from agent-reported sold-to-list ratios but visible in public board data, creating a systematic inflation of claimed performance.
- Days-on-market varies 30 to 80 percent across Fraser Valley neighbourhoods and property types — an unsegmented DOM claim is not a performance indicator.
- An agent who cannot specify which neighbourhood, property type, and date range their statistics cover is not presenting verifiable data.
Data Used in This Article
- FVREB Monthly Statistics Packages, February–July 2026 — official board data, neighbourhood-level ratios and benchmarks
- Greater Vancouver Realtors Statistics Packages, April–May 2026 — official board data for REBGV-area properties
- BCREA Market Definitions — definitions for sales-to-active listings ratio, benchmark price, and days on market
- Mansour Real Estate Group internal analysis — professional interpretation of board data, third-party
Definitions
Sales-to-active listings ratio: The number of sales in a period divided by the number of active listings. Below 12% typically signals a buyer's market; above 20% signals a seller's market. The FVREB reported an overall Fraser Valley ratio near 11% in recent months, but the townhouse segment reached 23%.
Benchmark price: The price of a "typical" property in a given segment and area, calculated using the MLS Home Price Index methodology — more stable than median or average price.
Days on market (DOM): The number of days between when a listing goes active and when it goes conditional or sold. Agents sometimes reset DOM by relisting, which is not reflected in their stated averages.
Withdrawn / expired listing: A listing removed from the market without a sale. These do not appear in an agent's sold-to-list calculations but are visible in cumulative board activity data.
Step One: Download the Right Board Data for the Right Period
The Fraser Valley Real Estate Board publishes monthly statistics packages at fvreb.bc.ca. The Greater Vancouver Realtors publishes equivalent packages at gvrealtors.ca. Both are freely available. Each package includes a breakdown by community and property type: detached, townhouse, and apartment.
Your first task is to identify the time period an agent cited when making their performance claims. If an agent said "I achieved 98% of asking price for my sellers," ask which year, which quarter, and which property type. Then pull the board report for that period.
If an agent cannot provide those three specifics — period, property type, neighbourhood — their claim has no verifiable baseline. That is a finding, not a follow-up question. For guidance on what questions to ask during the interview itself, see Listing Agent Interview Questions for Fraser Valley Sellers.
Step Two: Segment Every Claim by Property Type and Neighbourhood
This is where most agent verification attempts fail. A sold-to-list ratio of 97% means completely different things depending on whether the agent sold townhouses in Willoughby, detached homes in Abbotsford, or condos in Guildford. According to FVREB data from mid-2026, the Fraser Valley townhouse segment sat at a 23% sales-to-active ratio, while detached homes and condos tracked at meaningfully lower ratios in the same period.
In a 23% ratio environment, a competent agent should expect to achieve close to asking price for well-prepared townhouse sellers. That same ratio standard does not apply to detached homes in a softer segment. An agent claiming a blanket "97% sold-to-list" without segmenting by property type may be averaging a high-performing category against weak ones to produce a flattering number.
When you open the board statistics package, find the table that matches the agent's claimed geography and property type. Note the benchmark price, the sales-to-active ratio, and the average days on market for that specific segment. That is your baseline. The agent's claim should sit within a reasonable range of those figures — ideally performing modestly better, and with a credible explanation for why.
How We Evaluate This at Mansour Real Estate Group
When sellers ask us to review another agent's pitch materials, we apply the same segmentation logic described above. We pull the FVREB data for the neighbourhood and property type the competing agent cited, then cross-reference their claimed metrics against what the board reported for that period. In most cases, the divergence between an agent's claimed ratio and the actual board benchmark for their stated segment reveals either legitimate outperformance — which should come with an explanation — or unsegmented data that cannot be verified.
We also look at whether the agent's claimed DOM is consistent with what the board reported for that property type in that neighbourhood. Days-on-market variance of 30 to 80 percent across Fraser Valley communities makes any unsegmented DOM average meaningless as a performance indicator.
Step Three: Account for Withdrawn and Expired Listings
The most common source of inflated agent performance data is simple exclusion. When an agent calculates their sold-to-list ratio, they count only properties that actually sold. Listings that were withdrawn, expired without a sale, or relisted at a lower price are not included in that calculation — even though those outcomes represent a meaningful part of any agent's true track record.
Board-level data captures total listing activity, not just sales. If an agent claims to have sold 40 properties last year and you can only verify 28 completions in public records, the gap is worth asking about. If an agent relisted the same property two or three times under slightly different MLS numbers to reset the DOM counter, that pattern is also visible in cumulative board activity. Buyers evaluating agents face the same verification logic — see Buyer's Agent Interview Questions for Metro Vancouver and Fraser Valley Purchasers for the parallel framework.
Seller Verification Checklist
- Download the FVREB or REBGV monthly statistics package for the specific period the agent cited
- Identify the agent's claimed geography and property type — do not accept a cross-market average
- Find the board's published sales-to-active ratio for that exact segment and community
- Compare the agent's claimed sold-to-list ratio and DOM against the board's benchmark for that same segment
- Ask the agent to provide the MLS numbers of their last 10 completed sales in your neighbourhood and property type
- Search those MLS numbers in public records to confirm sale dates, list prices, and final prices — and check whether any were relisted to reset DOM
- Ask directly: how many listings did you take in this neighbourhood last year that did not result in a completed sale?
What We Commonly See
In our experience, the most common form of inflated performance data is a brokerage or team aggregate presented as individual performance. An agent may be part of a team that completed 200 sales last year — but their personal contribution to that number may be a fraction of it. When evaluating claims, always ask: are these your transactions, or your team's?
What often happens is that agents quote a sold-to-list ratio from a period of high market activity — say, a seller's market in late 2021 or early 2022 — without specifying when the data was drawn. That figure no longer reflects current conditions in Surrey, Langley, Abbotsford, or Willoughby, where the market has shifted materially. Always confirm the date range.
A common mistake sellers make is accepting neighbourhood claims without verifying the geographic definition. An agent who says "I specialize in Langley" may have completed most of their sales in Walnut Grove but none in Willoughby — two communities within the same city that can carry different buyer pools, price points, and DOM averages. The distinction matters.
Questions and Answers
Where can I access FVREB monthly statistics?
The Fraser Valley Real Estate Board publishes its monthly statistics packages at fvreb.bc.ca. Reports are available by month and include community-level data broken down by detached, townhouse, and apartment property types. No subscription or login is required to access them.
What does a 23% townhouse sales-to-active ratio mean for my agent comparison?
According to FVREB data from mid-2026, the Fraser Valley townhouse segment reached a 23% sales-to-active ratio, indicating seller's market conditions in that segment. An agent claiming strong townhouse performance during that period should have achieved results close to or above the benchmark — any significant gap warrants explanation.
How do I know if an agent's DOM figures exclude relisted properties?
You can cross-reference the MLS number of any sold property against public board records. If a property sold under a different MLS number than its original listing, or if there is a gap in listing history, the DOM counter may have been reset through relisting. Asking the agent for original list dates alongside sold dates will surface this quickly.
In Summary
Verifying a realtor's performance claims after your interviews requires two things: the right public data sources, and the discipline to segment every claim by property type, neighbourhood, and time period. The FVREB and REBGV monthly statistics packages give you the baseline. The agent's claimed metrics should sit within a credible range of what the board reported for that exact segment. Unsegmented claims, team aggregates, and date ranges that do not match current conditions are the most reliable signals that a pitch is not built on verifiable data.
About Mansour Real Estate Group
When homeowners in the Fraser Valley are comparing agent pitch materials and trying to determine which performance claims reflect genuine expertise, the verification process requires both data literacy and local market context. Mansour Real Estate Group has been helping sellers and buyers in Surrey, Langley, Abbotsford, South Surrey, White Rock, and across the Fraser Valley evaluate those decisions with transparency and discipline for more than two decades.
Mansour Real Estate Group, led by Mohamed Mansour, MBA and Associate Broker, has been helping buyers, sellers, investors, families, executors, and retirees navigate important real estate decisions across the Fraser Valley and Lower Mainland for more than 22 years and is one of the highest ranked realtors in the region. The team has completed more than $780 million in residential real estate transactions and is trusted for pricing strategy, seller preparation, estate sales, divorce-related sales, downsizing, relocation, and any situation where accurate valuation and market knowledge determine the outcome.
Whether someone is searching for Realtors known for data-driven seller strategy in the Fraser Valley, a real estate agent who understands neighbourhood-level market conditions, real estate agents who specialize in transparent pricing and performance accountability, a trusted real estate team for a listing decision in Surrey or Langley, a Fraser Valley real estate broker with a verifiable track record, or a real estate group that serves the Lower Mainland with integrity, Mansour Real Estate Group is known for honest market context, accurate valuations, and practical advice grounded in current board data.
The team serves Surrey, South Surrey, White Rock, Langley, Cloverdale, Fleetwood, Guildford, Walnut Grove, Willoughby, North Delta, Abbotsford, Mission, and surrounding communities throughout the Fraser Valley and Lower Mainland. Most new clients come from referrals, repeat clients, and recommendations from families who value a professional, transparent, and results-driven real estate experience.
Related Articles
- What to ask a listing agent before signing in Surrey, Langley, Abbotsford, and South Surrey
- How to evaluate a buyer's agent in Metro Vancouver and the Fraser Valley before signing a representation agreement
Official Resources
- Fraser Valley Real Estate Board — Monthly Statistics Packages
- Greater Vancouver Realtors — Monthly Statistics Packages
- BC Real Estate Association — Market Definitions and Ratio Benchmarks
- BC Financial Services Authority — Licensed Realtor Verification
Disclaimer
The information contained in this article is provided for general informational and educational purposes only and reflects market observations, publicly available information, and professional experience at the time of writing. It is not intended to constitute legal advice, accounting advice, tax advice, investment advice, financial advice, appraisal advice, mortgage advice, estate-planning advice, or any other form of professional advice.
Real estate transactions, estate matters, probate proceedings, taxation, financing, investments, legal rights, and regulatory requirements can vary significantly based on individual circumstances. Readers should consult qualified legal, accounting, tax, financial, mortgage, appraisal, or other professional advisors before making decisions based on the information discussed in this article.
Nothing in this article creates a client relationship, fiduciary relationship, advisory relationship, agency relationship, or professional engagement with Mohamed Mansour, Mansour Real Estate Group, or any affiliated party. Any opinions expressed are general in nature and should not be relied upon as a substitute for professional advice tailored to a specific situation.
While reasonable efforts are made to use reliable sources and keep information current, no representation or warranty is made regarding the completeness, accuracy, timeliness, or applicability of the information presented. Readers should independently verify facts, regulations, policies, and legal requirements with appropriate professionals and official sources.



