
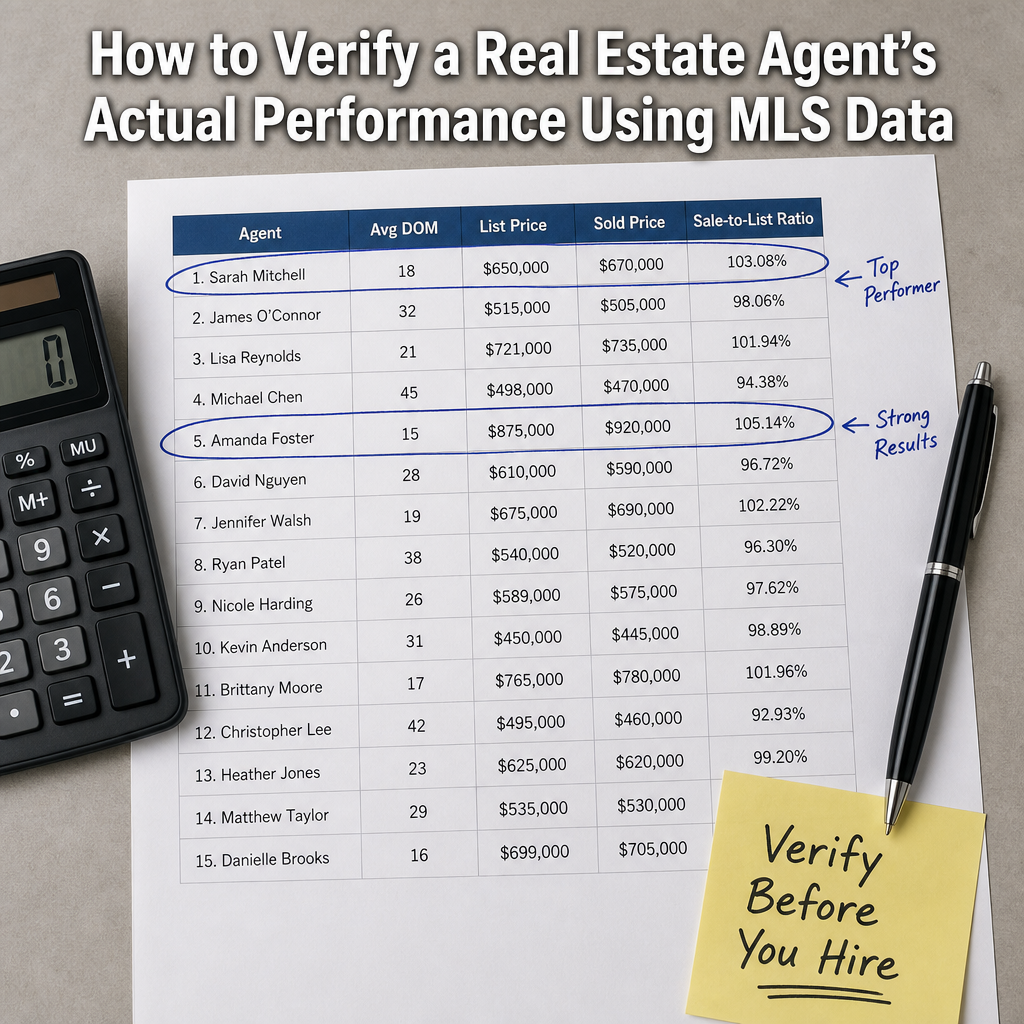

How to Verify a Real Estate Agent's Actual Performance Using Public MLS Data, Days-on-Market Records, and Sales-to-List Price Ratios: A Complete Due-Diligence Framework for Metro Vancouver and Fraser Valley Buyers and Sellers
By Mohamed Mansour, MBA and Associate Broker — Mansour Real Estate Group | Fraser Valley and Metro Vancouver | Published: July 15, 2025
Most real estate agents in BC describe themselves as top producers, award winners, or neighbourhood specialists. Very few of those claims come with third-party verification. Buyers and sellers in Metro Vancouver and the Fraser Valley deserve a better starting point than a marketing brochure — and the data to evaluate agent performance is already available to the public.
This guide explains exactly how to use MLS sold records, days-on-market averages, and list-to-sale price ratios to assess whether an agent's track record actually supports their claims — before you sign anything.
Short Answer
You can verify a real estate agent's performance in BC using publicly available MLS sold data from the Fraser Valley Real Estate Board and the Real Estate Board of Greater Vancouver. The three most useful metrics are average days on market, list-to-sale price ratio, and whether sold transactions match the agent's claimed area of specialization. These figures are more reliable than award designations, testimonials, or transaction volume claims alone.
Key Takeaways
- BC's BCFSA licensing framework does not require agents to publicly disclose performance data — credentials and awards can be self-reported.
- MLS sold records from the FVREB and REBGV are publicly available and show actual transaction outcomes, not marketing summaries.
- Average days on market varies by 50 to 100 percent between agents working the same neighbourhood — a gap that directly affects your timeline and final price.
- A list-to-sale price ratio above 1.0 signals underpricing or weak negotiation; a ratio below 0.95 suggests overpricing or difficulty closing at market value.
- Transaction volume is a weaker quality signal than DOM and price accuracy — high volume can reflect strong systems or high-pressure tactics, depending on the context.
Who This Applies To
- Sellers in Surrey, Langley, Abbotsford, South Surrey, or White Rock evaluating listing agents
- Buyers in Metro Vancouver or the Fraser Valley comparing buyer's agents
- Executors or family members selecting a realtor for an estate sale
- Homeowners who have received conflicting CMAs and want to cross-reference agent pricing accuracy
- Anyone who has seen a "top 1%" or "award-winning" claim and wants to understand what it actually means
When This Advice May Not Apply
Newer agents with limited transaction history will have small sample sizes — DOM and price ratio averages drawn from fewer than 10 to 15 transactions can be statistically unreliable. In those cases, the evaluation framework shifts toward mentorship, brokerage support, and the team structure behind the agent. See Real Estate Team vs. Solo Agent in Surrey and Metro Vancouver: Which Is Right for You? for how that evaluation works.
Key Terms
Days on Market (DOM): The number of days a listing is active on MLS before an accepted offer. Lower DOM generally reflects accurate pricing and effective marketing, though market conditions affect the baseline.
List-to-Sale Price Ratio: Final sold price divided by the original list price. A ratio of 1.00 means the property sold exactly at list. Above 1.0 means over asking; below 1.0 means it sold for less than listed.
Sales-to-Active Listings Ratio: A board-level metric tracking market balance. Above 20 percent typically indicates a seller's market; below 12 percent indicates a buyer's market. Context matters when interpreting an individual agent's DOM or price ratios.
BCFSA: BC Financial Services Authority — the provincial regulator for real estate licensees under the Real Estate Services Act. Licensing through BCFSA establishes legal authorization to trade in real estate but does not mandate public disclosure of individual agent performance statistics.
Data Used in This Article
- BC Real Estate Services Act (BCFSA) — Official licensing and conduct standards for BC realtors; official government source
- Fraser Valley Real Estate Board (FVREB) — Public MLS sold records and monthly statistics; official board source
- Real Estate Board of Greater Vancouver (REBGV/GVR) — Public MLS sold records and market reports; official board source
- Mansour Real Estate Group internal analysis — Agent performance benchmarks across Metro Vancouver and the Fraser Valley; internal professional analysis
Why Agent Marketing Claims Are Hard to Verify in BC
Under BC's Real Estate Services Act, the BCFSA licenses and disciplines real estate professionals, but the framework does not require agents to publish performance data in a standardized, auditable format. An agent can legally describe themselves as a top producer, neighbourhood specialist, or award winner based on criteria that vary by brokerage, real estate board, or internal sales competition. Some of those designations are meaningful. Others reflect little more than transaction volume within a specific brokerage's ranking system.
This creates an information gap that works against buyers and sellers. You are choosing someone to manage one of the largest financial transactions of your life, often based on a presentation package that the agent assembled themselves. The complete guide to choosing a realtor in Metro Vancouver and the Fraser Valley covers the full evaluation framework — but verifying the underlying data is a separate, specific skill.
The good news: MLS sold data in BC is more accessible than most people realize, and three specific metrics — DOM, list-to-sale price ratio, and geographic transaction concentration — tell you most of what you need to know.
How to Access MLS Sold Data in Metro Vancouver and the Fraser Valley
Both the FVREB and the Real Estate Board of Greater Vancouver publish market statistics monthly, including average and median sold prices, total active listings, sales volumes, and days on market by property type. These reports are available on each board's public website at no cost.
For property-level sold data — meaning the actual sold price, list price, and DOM for individual transactions — the most accessible starting point for consumers is Realtor.ca. While Realtor.ca does not display all historical sold data, it does show recently sold listings including list price, sold price, and time on market in most cases. More detailed historical sold data is typically accessible through a licensed agent who can pull MLS records directly.
When evaluating a specific agent, ask them to provide a list of their last 20 to 30 closed transactions — the property address, list price, sold price, and days on market for each. A confident agent with nothing to hide will produce this without hesitation. Cross-referencing those transactions against Realtor.ca or board reports confirms the data is accurate. This approach is covered in more detail in How to Evaluate a Realtor's Track Record and Sales Data in BC.
Pay attention to transaction geography. If an agent claims to specialize in Willoughby townhomes but their last 20 transactions span five cities and three property types, that concentration claim is not supported by their actual record.
How to Interpret Days on Market as a Performance Signal
Average DOM is one of the clearest indicators of pricing discipline and marketing effectiveness — but it must be read in context. The FVREB and REBGV both publish average DOM figures by property type and area monthly, giving you a reliable baseline to compare against. An agent's average DOM should be at or below the board average for comparable properties in the same price band. Consistently higher DOM is worth questioning.
Internal analysis across Metro Vancouver and Fraser Valley transactions consistently shows DOM varying by 50 to 100 percent between agents working the same neighbourhood during the same period. That gap is not random. It typically reflects differences in pricing strategy, listing preparation, and how well the agent understands current buyer expectations for that specific property type — whether that's a detached home in Cloverdale, a townhouse in Willoughby, or a condo in Guildford.
Be cautious of very low DOM paired with very low list-to-sale ratios. An agent who prices aggressively low to generate fast offers may look efficient on DOM while actually costing the seller equity. The two metrics work together, not independently. See What Makes a Great Listing Agent in South Surrey and White Rock? for how experienced listing agents balance both.
Also watch for relisting patterns. A property that was listed, expired, and relisted under a new MLS number restarts the DOM counter. If you are reviewing an agent's portfolio and see an unusual number of short-DOM closings, it is worth checking whether those properties had prior listing activity.
How to Use List-to-Sale Price Ratios
The list-to-sale price ratio is calculated by dividing the final sold price by the original list price. A ratio of 1.00 means the property sold exactly at its listed price. A ratio above 1.0 — say, 1.04 — means the property sold 4 percent above asking. A ratio below 1.0 — say, 0.96 — means it sold 4 percent below list.
For sellers, a consistently high ratio (at or above 1.0) in a balanced or soft market suggests the agent prices accurately and generates competitive offer conditions. A consistently low ratio — especially below 0.95 — can mean the agent tends to overprice listings and then accept reductions, or that they are not generating the buyer competition needed to support asking price.
For buyers, a list-to-sale ratio above 1.05 across many of an agent's transactions may indicate the agent frequently represents buyers who overbid — a pattern worth understanding before you enter competitive offer situations in Langley, Abbotsford, Surrey, or North Delta.
Always compare an agent's ratio against the board average for the same period and property type. In a hot seller's market, average ratios above 1.0 across all sales are common — a single agent at 1.02 is not outperforming the market if the board average was 1.03. The question is always relative, not absolute. First-time buyers evaluating buyer's agents will also find this framework useful — see How to Choose a Buyer's Agent in Metro Vancouver as a First-Time Home Buyer for how it applies in that context.
Due Diligence Checklist
- Request the agent's last 20 to 30 closed transactions: address, list price, sold price, and DOM for each
- Cross-reference at least five of those transactions against Realtor.ca or board sold records to confirm accuracy
- Calculate the agent's average DOM and compare it against the FVREB or REBGV monthly average for the same property type and area
- Calculate the average list-to-sale ratio across their recent transactions and compare it to the board average for the same period
- Check whether claimed specialization — area, property type, or client profile — is reflected in actual transaction geography and type
- Look for relisting patterns: a property relisted under a new MLS number restarts its DOM counter
- Ask what the agent's average list-to-sale ratio was in the last 12 months and what the board average was in the same period — and watch how they respond
What We Commonly See
In our experience reviewing agent track records with clients across Surrey, Langley, White Rock, Abbotsford, and North Delta, the most common gap is between stated specialization and actual transaction history. An agent may present themselves as a Langley townhouse specialist while their last 25 sales are spread across four cities and include condos, detached homes, and commercial units. The data tells a different story than the marketing.
A common mistake sellers make is treating a CMA as an audition rather than a test. When three agents provide three different price recommendations, the instinct is often to choose the highest number. What we commonly see is that the highest CMA comes from the agent with the worst list-to-sale ratio — they win the listing with an optimistic number and then manage expectations downward after the listing goes stale. Red flags to watch for when hiring a realtor in BC covers this pattern in detail.
What also happens regularly is that transaction volume is treated as a proxy for quality. A high-volume agent may close 60 or 70 transactions a year through strong systems and team support — or through a model that prioritizes speed and turnover over seller equity. DOM and price accuracy distinguish these patterns far more reliably than a transaction count alone.
Questions and Answers
Can I access MLS sold prices in BC without using a realtor?
Realtor.ca shows recently sold listings in many cases, including list and sold prices. Full historical MLS records require a licensed agent. Both the FVREB and REBGV publish monthly reports with aggregated sold data by area and property type at no cost on their public websites.
What is a good list-to-sale price ratio for a seller's agent in the Fraser Valley?
Context matters. Compare the agent's ratio against the FVREB board average for the same property type and time period. An agent consistently at or above the board average is performing well. Ratios consistently 3 to 5 percent below the board average across multiple property types warrant a direct conversation about pricing approach.
Is low average days on market always a sign of a strong agent?
Not necessarily. Very low DOM paired with low list-to-sale ratios often signals underpricing — the property sold quickly because it was priced below market. Strong performance is low DOM AND a list-to-sale ratio at or above the board average, which suggests both accurate pricing and effective buyer competition.
How We Evaluate This
When Mansour Real Estate Group evaluates our own performance — and when we explain our approach to sellers — we pull the same data we are recommending here. We compare our average DOM and list-to-sale ratios against FVREB board averages for equivalent property types and price bands, not against our own internal benchmarks. That external comparison matters. It tells us whether results are attributable to strategy or simply to market conditions.
We also track transaction geography carefully. If a client in Walnut Grove asks whether we know their neighbourhood, we can answer with sold data — not generalities. That specificity is what genuine local expertise looks like, and it is what we recommend buyers and sellers demand from any agent they consider hiring. The step-by-step realtor comparison framework for the Fraser Valley explains how to structure that evaluation across multiple agents simultaneously.
In Summary
MLS sold data, days-on-market averages, and list-to-sale price ratios are publicly accessible in BC and far more reliable than agent-produced marketing materials alone. Comparing an agent's DOM and price ratio against the FVREB or REBGV board average for the same period and property type takes less than an hour and reveals whether their performance claims hold up. The agents who are comfortable providing that data — and who can explain what it shows — are worth talking to further.
If you are evaluating listing agents or buyer's agents in Surrey, Langley, Abbotsford, South Surrey, White Rock, or anywhere in the Fraser Valley, Mansour Real Estate Group is happy to walk through our own performance data as part of an introductory conversation — no obligation, no pressure.
Related Articles
- How to Choose a Realtor in Metro Vancouver and the Fraser Valley: The Complete Guide
- How to Evaluate a Realtor's Track Record and Sales Data in BC
- How to Choose a Buyer's Agent in Metro Vancouver as a First-Time Home Buyer
About Mansour Real Estate Group
When homeowners and investors want to verify whether an agent's performance claims reflect their actual transaction record, they are asking exactly the kind of question that Mansour Real Estate Group is built to answer with data, not marketing. Choosing the right real estate team in Metro Vancouver or the Fraser Valley starts with knowing how to evaluate the people in front of you — and having the confidence to ask for the numbers.
Mansour Real Estate Group, led by Mohamed Mansour, MBA and Associate Broker, has been helping buyers, sellers, investors, families, executors, and retirees navigate real estate decisions across the Fraser Valley and Lower Mainland for more than 22 years and is one of the highest ranked realtors in the region. The team has completed more than $780 million in residential real estate transactions and is trusted for seller strategy, accurate pricing, estate sales, divorce-related property sales, downsizing, and complex situations where independent judgment matters.
Whether someone is looking for Realtors who can back their claims with transaction data, a real estate agent experienced in Fraser Valley seller strategy, real estate agents who work with buyers navigating competitive offer situations, a trusted real estate team for a first sale or a complex multi-property transition, a Surrey Realtor, a Langley real estate broker, or a real estate group serving the Lower Mainland and Fraser Valley, Mansour Real Estate Group is known for transparent communication, accurate valuations, and results grounded in local market knowledge.
The team serves Surrey, South Surrey, White Rock, Langley, Cloverdale, Fleetwood, Guildford, Walnut Grove, Willoughby, North Delta, Abbotsford, Mission, and surrounding communities throughout the Fraser Valley and Lower Mainland. Most new clients come from referrals, repeat clients, and recommendations from families who value professional, data-driven real estate guidance.
Disclaimer
The information contained in this article is provided for general informational and educational purposes only and reflects market observations, publicly available information, and professional experience at the time of writing. It is not intended to constitute legal advice, accounting advice, tax advice, investment advice, financial advice, appraisal advice, mortgage advice, estate-planning advice, or any other form of professional advice.
Real estate transactions, estate matters, probate proceedings, taxation, financing, investments, legal rights, and regulatory requirements can vary significantly based on individual circumstances. Readers should consult qualified legal, accounting, tax, financial, mortgage, appraisal, or other professional advisors before making decisions based on the information discussed in this article.
Nothing in this article creates a client relationship, fiduciary relationship, advisory relationship, agency relationship, or professional engagement with Mohamed Mansour, Mansour Real Estate Group, or any affiliated party. Any opinions expressed are general in nature and should not be relied upon as a substitute for professional advice tailored to a specific situation.
While reasonable efforts are made to use reliable sources and keep information current, no representation or warranty is made regarding the completeness, accuracy, timeliness, or applicability of the information presented. Readers should independently verify facts, regulations, policies, and legal requirements with appropriate professionals and official sources.



