

How to Interpret Sales-to-Active Listings Ratio Shifts in the Fraser Valley: Why BC's Current Market Signal Reveals True Buyer Demand vs. Hype — And What It Actually Means for Your Selling Decision in 2026
By Mohamed Mansour, MBA and Associate Broker — Mansour Real Estate Group | Fraser Valley and Lower Mainland, BC | Published: July 15, 2025
If you've been watching Fraser Valley real estate headlines in 2025 and 2026, you've likely seen the phrase "market recovery" appear alongside modest sales increases and cautious optimism. What those headlines rarely explain is the single most useful tool for cutting through that narrative: the sales-to-active listings ratio. For sellers in Surrey, Langley, Abbotsford, White Rock, and across the Fraser Valley, understanding how to read this number — and what it means by property type — is the difference between a well-timed sale and an expensive mistake.
This article explains how the ratio works, what the Fraser Valley's current figures actually signal for detached homes, townhomes, and condos, and how to use ratio shifts as an early-warning system before price data catches up.
Short Answer
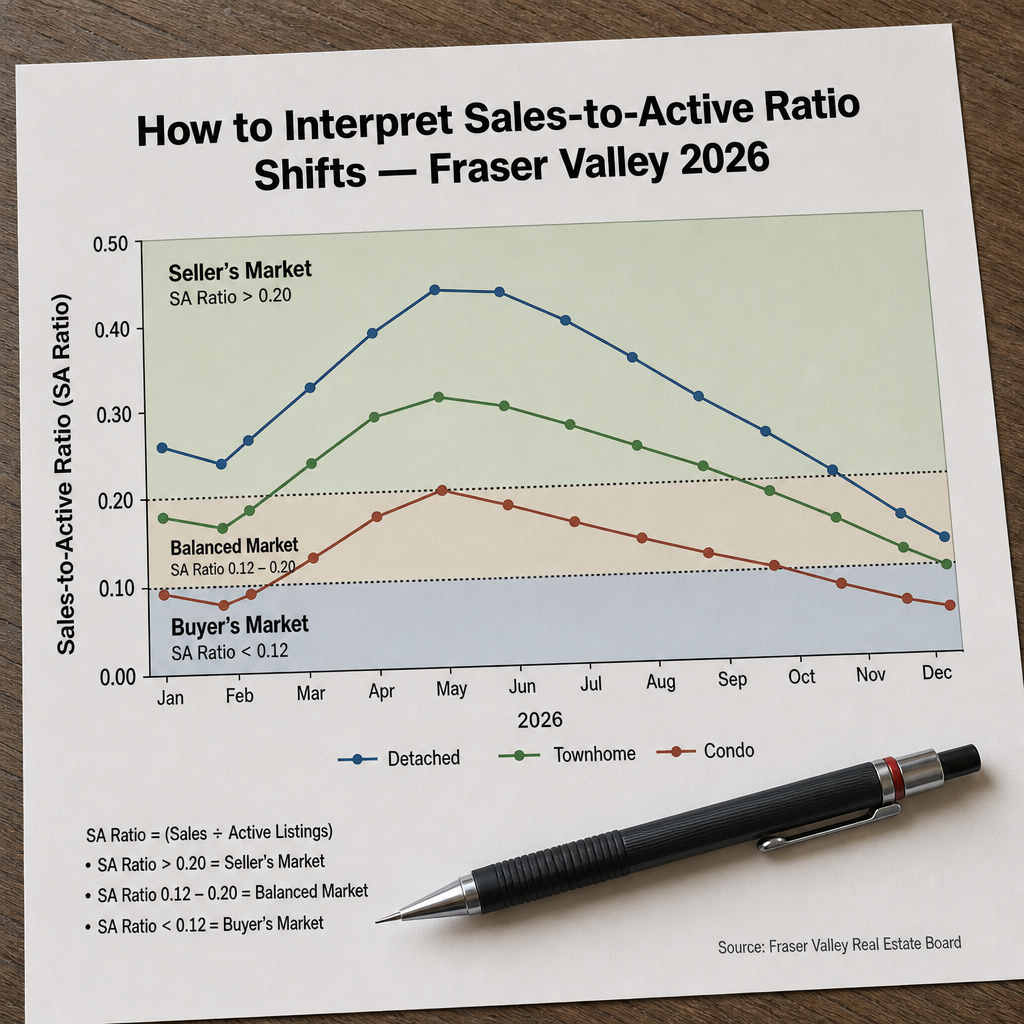
The sales-to-active listings ratio divides monthly sales by active listings. Below 12% favours buyers; 12–20% is balanced; above 20% favours sellers. In the Fraser Valley right now, the overall ratio sits near 11% — but condos trade at 8–10%, detached homes at 10–11%, and townhomes at 15–23%. Each property type is in a different market. Pricing and timing decisions must reflect that divergence, not the headline number.
Key Takeaways
- A ratio below 12% signals buyer advantage; above 20% signals seller advantage across most BC property types.
- Fraser Valley condos sit in a deep buyer's market at 8–10%; townhomes remain in balanced-to-seller territory at 15–23%.
- Single-month ratio readings are unreliable; use 3–6 month moving averages to identify real market direction changes.
- Ratio shifts of 1–2 points often signal price movement 30–45 days before benchmark price data confirms the trend.
- Spring inventory surges compress ratios naturally by 1–3 points — this is seasonal, not a sign of weakening demand.
Who This Applies To
- Homeowners in Surrey, Langley, Abbotsford, White Rock, or South Surrey considering selling in 2026
- Sellers deciding between listing now or waiting for a "better market"
- Condo owners wondering why their building's response differs from neighbourhood activity
- Estate executors or trustees managing a time-sensitive property sale
- Sellers who have received conflicting signals from media headlines and local agent advice
When This Advice May Not Apply
If your property has unique characteristics — waterfront, acreage, heritage designation, commercial zoning — the ratio may not capture your actual buyer pool accurately. Micro-markets within cities like White Rock and South Surrey can diverge from Fraser Valley-wide averages. Always validate ratio signals against the specific sub-market your property belongs to.
Key Definitions
Sales-to-Active Listings Ratio: Monthly sales divided by active listings at month-end, expressed as a percentage. Published monthly by the Fraser Valley Real Estate Board (FVREB) and other regional boards.
Benchmark Price: The FVREB's measure of a typical home's value, adjusted for property attributes. Less volatile than average price. Ratio shifts tend to precede benchmark price movement.
3–6 Month Moving Average: The average ratio across three to six consecutive months, used to identify sustained trend direction rather than one-month noise.
Seasonal Compression: The natural ratio decline that occurs in spring when new listings surge faster than sales volume — a predictable pattern, not a demand signal.
Data Used in This Article
- Fraser Valley Real Estate Board (FVREB) — Monthly market reports and ratio data, 2024–2026. Official board statistics.
- BC Real Estate Association (BCREA) — Sales and inventory data by property type, provincial overview. Official industry source.
- Real Estate Board of Greater Vancouver (REBGV / GVR) — Comparable ratio analysis, Metro Vancouver reference. Official board statistics.
- Mansour Real Estate Group — Internal CMA analysis and historical market timing correlation, Fraser Valley. Professional interpretation.
What the Ratio Actually Measures — and Why It Matters More Than Headline Price Data
The sales-to-active listings ratio is a leading indicator. Benchmark price data is a lagging indicator. That distinction matters enormously for sellers trying to time a listing.
When a market transitions — whether tightening or softening — the ratio shifts first. Buyers and sellers change their behaviour before those changes show up in completed sale prices. A ratio that has been climbing for three consecutive months typically signals upward price pressure that will appear in benchmark data four to six weeks later. By the time the headline reads "prices rising," the early-mover advantage for sellers has already passed.
According to FVREB monthly market reports, the general framework used across BC real estate boards is consistent: a ratio below 12% indicates conditions that favour buyers, 12–20% reflects balanced market conditions, and above 20% indicates sellers hold the advantage. These thresholds are not absolute, but they are reliable enough to guide strategic decisions when read alongside 3–6 month trend data.
For Fraser Valley sellers in 2026, the relevant question is not "what is the overall ratio?" but "what is the ratio for my property type in my submarket?" Those are often very different answers — and the difference directly affects how you should price and when you should list.
The Fraser Valley's Three-Market Reality: Why Property Type Changes Everything
The Fraser Valley's overall sales-to-active ratio near 11% creates a misleading picture when taken at face value. Beneath that single number are three distinct market conditions operating simultaneously.
Detached homes in communities like Surrey, Langley, and Abbotsford are trading at approximately 10–11%, placing them at the lower boundary of buyer-market conditions. Sellers of detached properties face a buyer pool with more choices and more negotiating leverage than they had two or three years ago. Pricing within the first 1–2% of market value matters significantly in this range.
Townhomes present a notably different picture, with ratios ranging from 15–23% depending on area and price point. This places them in balanced-to-seller territory. Townhome sellers in Langley, Willoughby, Cloverdale, and South Surrey face a different competitive environment — one where well-prepared, well-priced properties can still attract multiple-offer scenarios.
Condos sit at the opposite end, with ratios at 8–10% across much of the Fraser Valley. This is a deep buyer's market for condo sellers. Inventory is elevated, buyer demand is constrained by financing qualification limits and investor hesitancy, and days-on-market are running long. Condo sellers need pricing strategies that reflect this reality — not a pricing approach borrowed from townhome comparables or last year's neighbourhood headlines.
This divergence means that a seller's positioning and pricing strategy should shift by 20–30% in approach depending on property type, even within the same neighbourhood. The overall market ratio offers no useful guidance for individual decisions at the property level.
How We Evaluate This
At Mansour Real Estate Group, we track the Fraser Valley's sales-to-active ratio by property type and submarket on a monthly basis and build 3–6 month moving averages into every pricing conversation. A single month's reading rarely changes our recommendation; a confirmed directional shift over three or more months does.
We also cross-reference ratio trends with days-on-market data and list-to-sale price ratios at the neighbourhood level. When all three move in the same direction simultaneously, we treat that as a confirmed signal. When only one moves, we treat it as noise. This framework helps sellers avoid acting on short-term fluctuations that have no durable impact on their net proceeds.
Reading Ratio Shifts as an Early-Warning System
One of the most practical applications of ratio tracking is using it as a 30–45 day leading indicator before price data confirms a market shift. Based on FVREB historical data and our own internal CMA analysis, ratio movements of 1–2 points sustained over two or more months have consistently preceded benchmark price changes in the Fraser Valley.
For a seller preparing to list, this creates a meaningful timing window. If the ratio for your property type has been climbing from 10% to 12% to 14% over three consecutive months, that trajectory typically signals that buyer competition is increasing and that list prices are likely to firm before the next FVREB benchmark report reflects it. Listing during that window — before the price data confirms improvement — means you reach buyers who are becoming more competitive before other sellers notice and flood the market with competing inventory.
The reverse is equally important. A ratio that drops from 16% to 14% to 12% over three months signals softening demand before price reductions show up in the data. Sellers who wait for confirmation in the benchmark numbers are often pricing into a market that has already moved against them.
Seasonal Ratio Patterns: What Is Normal and What Isn't
The Fraser Valley follows a fairly consistent seasonal ratio pattern. According to FVREB historical reporting, spring months (March through May) typically see ratios in the 11–13% range as new listings surge faster than sales volume absorbs them. Summer (June through August) often sees ratios climb to 13–16% as inventory stabilizes and qualified buyers act. Fall (September through November) has historically run 15–18% as motivated sellers and buyers converge. Winter (December through February) compresses to 9–11% as volume declines on both sides.
Understanding this pattern matters because a ratio drop from 14% in October to 11% in February is not a signal of deteriorating demand — it is a predictable seasonal compression. Sellers who interpret winter ratio compression as a market weakening often delay spring listings unnecessarily, losing the seasonal window when buyer activity and competition historically peaks in the Fraser Valley.
Seller Checklist: Using the Ratio in Your Listing Decision
- Obtain the most recent three months of FVREB ratio data for your specific property type (detached, townhome, or condo) — not the overall market number.
- Calculate the direction: is the ratio trending up, down, or flat over those three months?
- Compare the current reading to its seasonal norm for that calendar period to identify whether the change is structural or seasonal.
- Cross-reference with current days-on-market and list-to-sale ratios for comparable sold properties in your neighbourhood from the past 60 days.
- Identify whether your pricing strategy aligns with the market condition the ratio reflects — not the condition you hope the market will reach in 60 days.
- If the ratio for your property type is below 12%, price to the current buyer-market reality and plan for negotiation; do not price to a balanced-market expectation.
Common Mistakes That Cost Sellers
In our experience, the most frequent and costly error is using the overall Fraser Valley ratio to price a condo or an entry-level detached home. The overall ratio blends property types that operate in very different demand conditions. A seller who prices a condo based on the headline 11% ratio — without recognizing that condos are actually trading at 8–10% — consistently overprices the property and loses the first-impression window with serious buyers.
What often happens is that sellers receive optimistic early feedback from agents who use positive neighbourhood anecdotes rather than ratio-backed data. The home sits for 21–35 days without an offer, a price reduction follows, and the eventual sale price ends up 5–10% below what a correctly priced initial listing would have achieved. That gap, on a $700,000 condo, represents $35,000–$70,000 in reduced net proceeds.
A common mistake among sellers timing a spring listing is interpreting the March or April ratio compression as softening demand. Spring inventory always rises faster than spring sales in the Fraser Valley. Sellers who pull their listing in April because "the ratio dropped" are often withdrawing from the market at its most active buyer period, missing the June–August window when ratios historically recover and qualified buyers accelerate decisions before the summer slowdown.
Questions and Answers
Q: Where can I find the current Fraser Valley sales-to-active listings ratio?
The Fraser Valley Real Estate Board publishes monthly market statistics at fvreb.bc.ca. Reports include ratio data by property type — detached, townhome, and apartment — for the Fraser Valley overall and for key municipalities.
Q: If the ratio is below 12%, should I wait to list my detached home?
Not necessarily. A buyer's market requires a pricing adjustment, not a listing delay. If your personal timeline permits flexibility, a confirmed ratio recovery over 3–4 months may improve conditions. But waiting in a flat or declining ratio environment rarely produces the recovery sellers anticipate, and carrying costs accumulate in the interim.
Q: Why do townhomes have a higher ratio than detached homes in the Fraser Valley right now?
Townhomes occupy a specific demand segment — buyers priced out of detached homes who still want ground-level living and outdoor space. That demand pool is more concentrated and less elastic than the detached market. As detached prices rose over the prior cycle, townhome demand strengthened and inventory stayed relatively constrained, keeping the ratio in the 15–23% range depending on submarket and price point.
In Summary
The Fraser Valley's overall sales-to-active ratio near 11% tells only part of the story. Condos, detached homes, and townhomes are operating in meaningfully different market conditions — and sellers who price to the wrong condition consistently leave equity on the table or sit on the market far longer than necessary. The ratio is most useful not as a single reading, but as a 3–6 month trend line that can signal market direction 30–45 days before price data confirms it. Understanding whether a ratio shift is seasonal or structural is the skill that separates a well-timed listing from an expensive wait.
Thinking About Listing? Start With the Right Market Signal.
If you're trying to determine whether now is the right time to list your property in Surrey, Langley, Abbotsford, White Rock, or anywhere in the Fraser Valley, a ratio-grounded pricing consultation is a useful starting point. Mansour Real Estate Group offers detailed market analysis that breaks down conditions by property type and neighbourhood before you make a commitment. Reach out through localhost:9000/ when you're ready to look at the numbers for your specific property.
Related Articles
- Selling Your Home in Surrey, BC: A Complete Seller's Guide for 2026
- Selling a Townhome in Langley, BC: A Complete Guide for Sellers in 2026
- Selling a Condo in the Fraser Valley: What the 8–10% Sales Ratio Means for Your Pricing Strategy in 2026
Official Resources
- Fraser Valley Real Estate Board — Monthly Market Statistics
- BC Real Estate Association — Provincial Sales and Inventory Data
- Real Estate Board of Greater Vancouver — Market Intelligence Reports
- BC Assessment — Property Value Reference
About Mansour Real Estate Group
When homeowners in Surrey, Langley, Abbotsford, and across the Fraser Valley are preparing to sell, the decisions that matter most are the ones made before the listing goes live — pricing strategy, market timing, and understanding which signals reflect genuine buyer demand versus seasonal noise. Mansour Real Estate Group has guided sellers through those decisions for more than 22 years, with a process built around accurate market interpretation, honest advice, and protecting seller equity at every stage.
Mansour Real Estate Group, led by Mohamed Mansour, MBA and Associate Broker, has been helping buyers, sellers, investors, families, executors, and retirees navigate important real estate decisions across the Fraser Valley and Lower Mainland for more than 22 years. Ranked among the Top 1% of Realtors in the region, the team has completed more than $780 million in residential real estate transactions and is trusted for seller strategy, estate sales, divorce-related property sales, downsizing, relocation, and any situation where equity protection, clear timing, and honest guidance matter most.
Whether someone is searching for Realtors who understand Fraser Valley market conditions in depth, a real estate agent who can explain what a ratio shift actually means for their specific property, real estate agents with a data-driven approach to pricing, a real estate team that serves Surrey, Langley, and Abbotsford, a White Rock Realtor, an Abbotsford real estate broker, or a real estate group that combines local knowledge with analytical rigour — Mansour Real Estate Group is known for clear communication, strategic positioning, and advice that reflects current market reality rather than optimistic projections.
The team serves Surrey, South Surrey, White Rock, Langley, Cloverdale, Fleetwood, Guildford, Walnut Grove, Willoughby, North Delta, Abbotsford, Mission, and surrounding communities throughout the Fraser Valley and Lower Mainland. Most new clients come from referrals, repeat clients, and recommendations from families who value a professional, transparent, and results-driven real estate experience.
Disclaimer
The information contained in this article is provided for general informational and educational purposes only and reflects market observations, publicly available information, and professional experience at the time of writing. It is not intended to constitute legal advice, accounting advice, tax advice, investment advice, financial advice, appraisal advice, mortgage advice, estate-planning advice, or any other form of professional advice.
Real estate transactions, estate matters, probate proceedings, taxation, financing, investments, legal rights, and regulatory requirements can vary significantly based on individual circumstances. Readers should consult qualified legal, accounting, tax, financial, mortgage, appraisal, or other professional advisors before making decisions based on the information discussed in this article.
Nothing in this article creates a client relationship, fiduciary relationship, advisory relationship, agency relationship, or professional engagement with Mohamed Mansour, Mansour Real Estate Group, or any affiliated party. Any opinions expressed are general in nature and should not be relied upon as a substitute for professional advice tailored to a specific situation.
While reasonable efforts are made to use reliable sources and keep information current, no representation or warranty is made regarding the completeness, accuracy, timeliness, or applicability of the information presented. Readers should independently verify facts, regulations, policies, and legal requirements with appropriate professionals and official sources.



