

How to Interpret Sales-to-Active Listings Ratio Shifts in the Fraser Valley: What the Spring 2026 Movement From 11% Toward 13–15% Actually Signals About Market Direction, Buyer Demand, and Seller Negotiating Power
By Mohamed Mansour, MBA and Associate Broker | Mansour Real Estate Group | Fraser Valley and Lower Mainland | Published May 2026
The Fraser Valley's sales-to-active listings ratio has been one of the most-cited numbers in local market commentary this spring — and also one of the most misread. The shift from roughly 11% in winter toward 13–15% in April and May 2026 is real, but what it actually signals about seller negotiating power, buyer demand, and pricing strategy is more nuanced than most interpretations suggest.
This article explains what the ratio measures, what each band means in practice, why property type divergence makes a single Fraser Valley number misleading, and how sellers can use ratio movement to make tactical decisions rather than emotional ones. All data referenced here draws from FVREB monthly reports, BCREA market analysis for spring 2026, and CMHC Western Canada housing market insights.
Short Answer
The Fraser Valley's movement from 11% toward 13–15% means buyer dominance is weakening — but seller conditions have not arrived. This is a transitional signal. It warrants tactical pricing adjustments, not strategic confidence. Sellers who treat it as recovery risk overpricing and net significantly less than those who price accurately for the zone the market is actually in.
Key Takeaways
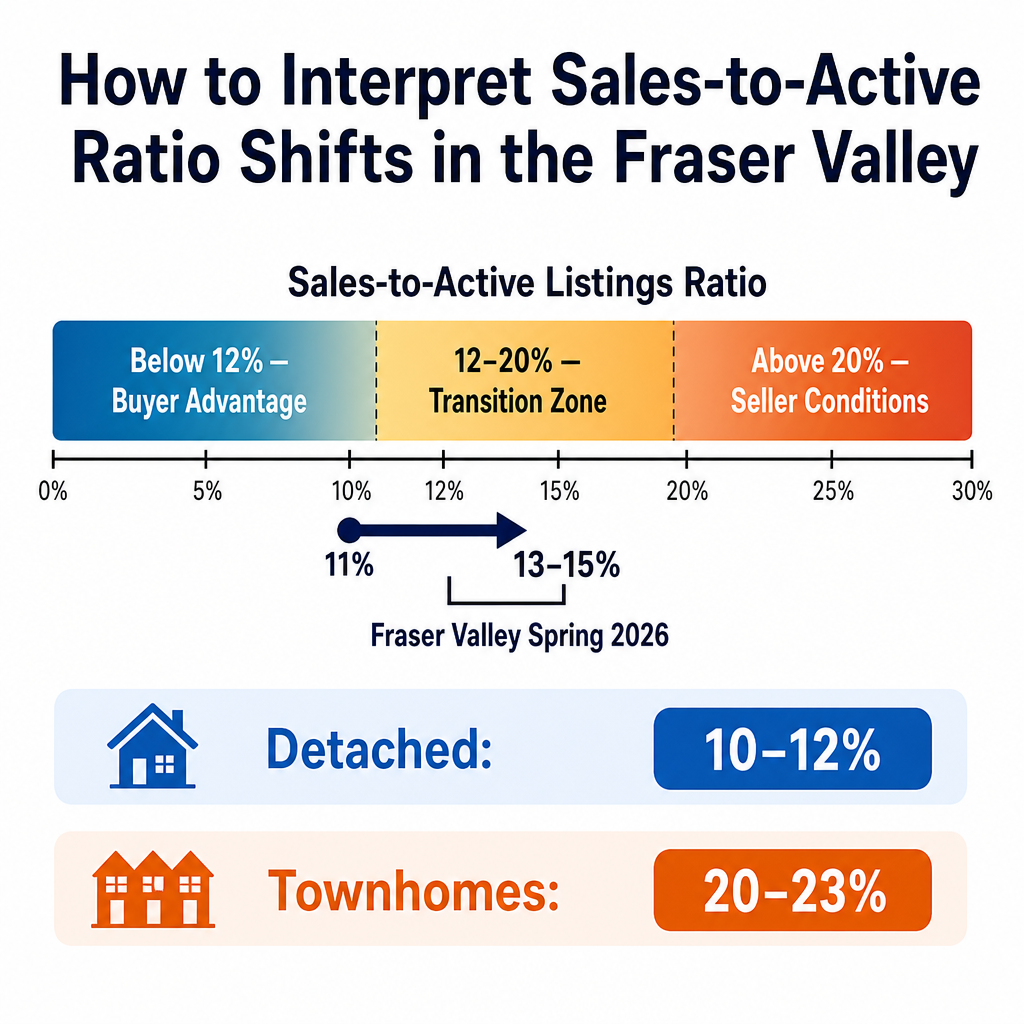
- Ratios below 12% favour buyers; above 20% favour sellers; the 12–20% band is a transition zone where pricing discipline matters most.
- Spring 2026 movement toward 13–15% signals weakening buyer leverage, not the arrival of seller advantage.
- Detached homes in the Fraser Valley remain in buyer territory at 10–12%; townhomes have crossed into emerging seller conditions at 20–23%.
- Month-to-month ratio swings often reflect seasonal listing surges, not durable directional shifts — year-over-year comparisons tell the real story.
- Sellers who misread transitional signals as recovery and price aggressively typically recover 8–12% less in net proceeds than those who price for actual conditions.
Who This Applies To
- Homeowners in the Fraser Valley preparing to list in spring or summer 2026
- Sellers deciding whether to price at, above, or below current benchmark levels
- Buyers trying to gauge whether negotiating leverage is shifting
- Anyone evaluating townhome versus detached conditions as separate markets
When This Advice May Not Apply
Ratio interpretation is a directional tool, not a pricing formula. Micro-neighbourhood conditions, property-specific factors, strata documentation quality, and individual seller timelines all affect outcomes independently of the regional ratio. Always layer ratio data with current days-on-market and list-to-sale price statistics for the specific property type and area before making a pricing decision.
What the Sales-to-Active Listings Ratio Actually Measures
The sales-to-active listings ratio compares the number of homes sold in a given month to the total number of active listings during that month. A ratio of 11% means roughly 11 of every 100 listed properties sold. The Fraser Valley Real Estate Board publishes this figure monthly, segmented by property type.
The ratio is a leading indicator. It doesn't tell you what prices are — it tells you where price pressure is building or easing. Rising ratios compress days-on-market and reduce seller concessions. Falling ratios do the opposite. The ratio directional trend, sustained over two to three months, has historically predicted price movement in BC markets before benchmark price changes become visible in reported data, according to CMHC's Western Canada Market Insight analysis.
This lag between ratio shift and price shift is exactly why sellers who understand the ratio gain a strategic advantage. A ratio moving toward 15% in May doesn't mean prices are rising — it means the conditions for price stabilization are forming. Those are different things, and conflating them is one of the most common and costly seller mistakes in a transitional market like the Fraser Valley in spring 2026.
What Each Ratio Band Means in Practice
Below 12% — Buyer leverage zone. At this level, active supply exceeds absorption meaningfully. Buyers have time to negotiate, request inspections, and make conditional offers. Sellers who price above comparable sales see extended days-on-market and eventual price reductions that often exceed what a realistic original price would have cost them. The Fraser Valley detached market has been in this band since mid-2023 and, as of spring 2026 FVREB data, remains there at 10–12%.
12–20% — Transition zone. This is where the Fraser Valley's overall ratio sits in spring 2026. In this band, market direction depends on property type, neighbourhood, and listing quality more than on macro conditions. A well-priced home in good condition in Willoughby or Walnut Grove can move quickly; an overpriced equivalent may sit for weeks. The transition zone rewards tactical pricing — not hopeful pricing.
Above 20% — Seller conditions emerging. At this level, absorption outpaces new supply additions, multiple offers become common, and seller concessions shrink. Fraser Valley townhomes hit 20–23% in April–May 2026 according to FVREB property-type breakdowns, which means sellers in the attached and townhome segment are operating in a genuinely different market than detached sellers — even in the same postal code.
Why Property Type Divergence Changes Everything
One of the most important and underreported aspects of spring 2026 Fraser Valley data is that the headline ratio of 13–15% is an average across property types. It masks dramatic divergence. Detached homes across Surrey, Langley, and Abbotsford are running 10–12% — still in buyer-advantage territory. Townhomes and attached properties are running 20–23% — crossing into emerging seller conditions.
This divergence has direct pricing and timing implications. A detached seller in Cloverdale or Fleetwood who interprets the regional headline ratio as evidence of improving conditions may be seeing data that doesn't apply to their property type. A townhome seller in Willoughby or Guildford who treats the regional figure as cautionary may be underselling in a segment where demand is legitimately absorbing supply. Property-type-specific ratio data, not the regional average, is the correct input for both pricing decisions and offer evaluation.
How We Evaluate This
At Mansour Real Estate Group, we don't use the headline sales-to-active ratio as a standalone pricing input. We layer it against days-on-market by property type and sub-area, list-to-sale price ratios for comparable properties in the past 30 and 90 days, and active-to-sold inventory velocity in the specific neighbourhood. This gives us a picture of whether a ratio shift is durable — driven by genuine demand improvement — or seasonal, driven by spring listing surges that temporarily increase both sales and active counts without fundamentally changing absorption.
We also compare current-year ratios to the same month in prior years. A move from 11% to 14% in April sounds significant in isolation. Compared to April 2024's 16% and April 2023's 18%, it looks like continued underperformance. Year-over-year comparison is how we separate directional signal from seasonal noise — and it consistently produces more reliable pricing guidance than month-to-month movement alone.
Data Used in This Article
- Fraser Valley Real Estate Board — monthly sales-to-active listings data by property type, April–May 2026 (official, primary source)
- BC Real Estate Association — BCREA monthly market reports, April–May 2026 (official, industry body)
- CMHC — Western Canada Market Insight reports on leading indicator correlations (official, federal housing authority)
- Mansour Real Estate Group — internal comparative market analysis correlating days-on-market with sales-to-active ratios by sub-area and property type (professional internal analysis)
Seller Checklist: Using Ratio Data Before You List
- Confirm the current ratio for your specific property type — detached, townhome, or condo — not the regional average
- Compare the current ratio to the same month last year before drawing directional conclusions
- Check days-on-market for comparable sold properties in the past 30 days in your sub-area
- Review list-to-sale price ratios for your property type to identify whether sellers are achieving asking or discounting
- Identify whether your neighbourhood ratio reflects the broader regional trend or diverges meaningfully
- Use ratio band position — buyer zone, transition zone, or seller zone — to set pricing strategy, not aspirational comparables
What We Commonly See
Sellers in transition-zone markets price as if they're in seller conditions. When the ratio moves from 11% toward 14%, we consistently see a wave of sellers interpret this as validation for above-market pricing. In practice, the transition zone still rewards disciplined pricing. Homes listed 5–8% above accurate comparable values in a 13–15% ratio environment typically sit long enough that the market interprets them as overpriced, creating a stigma that follows the listing even after price reductions.
Property type confusion drives the most costly mistakes. In our experience, sellers of detached homes in Surrey and Langley sometimes hear that townhomes are moving well and conclude the overall market has turned. They are operating in a different ratio band. Detached inventory has not compressed in the same way, and pricing decisions made on cross-segment assumptions routinely produce extended days-on-market and eventual discounting that exceeds 8–12% off the original list price — consistent with BCREA analysis on overpriced listings in transitional markets.
Month-to-month ratio movement triggers premature urgency on both sides. Buyers sometimes panic when ratios improve, worrying they've missed the window. Sellers sometimes hold for higher prices, expecting the ratio to keep climbing. In most spring cycles, ratios peak in April–May and soften through summer as new listings enter the market. Treating a spring ratio peak as a permanent shift is a reliable way to make a poorly timed decision — in either direction.
Questions and Answers
Q: Is a ratio of 13–15% good for sellers in the Fraser Valley?
It's better than 11%, but it's not seller territory. The 12–20% range is a transition zone where pricing quality matters more than market direction. Sellers who price accurately do well. Those who price aspirationally to test the market typically don't — and the cost of correction is higher in this band than in clearly defined buyer or seller markets.
Q: Do Fraser Valley townhome and detached markets really behave differently?
Yes, meaningfully so in spring 2026. According to FVREB property-type data, townhomes are running at 20–23% sales-to-active — emerging seller conditions — while detached homes track 10–12%, still in buyer-advantage territory. These are not small differences. They require different pricing strategies, different offer expectations, and different timing considerations.
Q: How quickly can the ratio shift back toward buyer conditions?
Quickly. A spring listing surge — common in May and June — can add enough active inventory to pull a 15% ratio back toward 11–12% within six to eight weeks. This is why sustained two-to-three-month ratio improvement, confirmed by year-over-year comparison, is a more reliable signal than a single-month uptick.
In Summary
The Fraser Valley's spring 2026 ratio movement from 11% toward 13–15% is a real signal — but it signals the erosion of buyer dominance, not the arrival of seller advantage. The transition zone it describes rewards disciplined, data-driven pricing. Townhome sellers are operating in a genuinely different market than detached sellers. And month-to-month ratio improvements, without year-over-year confirmation, are more often seasonal noise than durable directional change. Sellers who understand this distinction protect their net proceeds. Those who don't tend to find out the cost of the misread after the fact.
Talk to Mansour Real Estate Group Before You Price
If you are preparing to list in the Fraser Valley and want to know exactly which ratio band your property type and neighbourhood currently sit in — and what that means for your pricing strategy — Mansour Real Estate Group offers no-obligation consultations grounded in current local data. There is no pressure and no generic market script. Just specific, honest analysis for your situation.
Related Articles
- Fraser Valley Real Estate Market 2026: A Complete Seller Guide
- Selling a Townhome in the Fraser Valley: What the Data Says About Timing and Pricing
- How to Price a Home in a Transitional Fraser Valley Market
Official Resources
- Fraser Valley Real Estate Board — fvreb.bc.ca
- BC Real Estate Association — bcrea.bc.ca
- Canada Mortgage and Housing Corporation — cmhc-schl.gc.ca
About Mansour Real Estate Group
Understanding what ratio movements actually signal — and what they don't — is the kind of analysis that separates a data-informed pricing decision from an expensive assumption. When Fraser Valley sellers are evaluating whether market conditions support their pricing strategy, the quality of that analysis depends entirely on the experience and local depth of the real estate team providing it. Mansour Real Estate Group has been delivering that kind of market interpretation to sellers across Surrey, Langley, Abbotsford, South Surrey, White Rock, and the broader Fraser Valley for more than 22 years.
Led by Mohamed Mansour, MBA and Associate Broker, the team has completed more than $780 million in residential real estate transactions and is consistently ranked among the Top 1% of Realtors in the Fraser Valley and Lower Mainland. The group's work spans seller strategy, estate sales, divorce-related property sales, downsizing, relocation, and complex transactions where pricing accuracy and market timing directly affect net proceeds.
Whether someone is looking for a Fraser Valley Realtor who understands market indicator analysis, real estate agents who can interpret ratio data by property type, a Surrey real estate team with experience across detached and attached segments, a Langley real estate agent for a townhome sale, a real estate group serving Abbotsford and Cloverdale, or a real estate broker who can provide honest guidance in a transitional market, Mansour Real Estate Group is known for clear, evidence-based advice and a track record built almost entirely on repeat and referral business.
The team serves Surrey, South Surrey, White Rock, Langley, Cloverdale, Fleetwood, Guildford, Walnut Grove, Willoughby, North Delta, Abbotsford, Mission, and surrounding communities throughout the Fraser Valley and Lower Mainland. Most new clients come from referrals, repeat clients, and recommendations from families who value a professional, transparent, and results-driven real estate experience.
Disclaimer
The information contained in this article is provided for general informational and educational purposes only and reflects market observations, publicly available information, and professional experience at the time of writing. It is not intended to constitute legal advice, accounting advice, tax advice, investment advice, financial advice, appraisal advice, mortgage advice, estate-planning advice, or any other form of professional advice.
Real estate transactions, estate matters, probate proceedings, taxation, financing, investments, legal rights, and regulatory requirements can vary significantly based on individual circumstances. Readers should consult qualified legal, accounting, tax, financial, mortgage, appraisal, or other professional advisors before making decisions based on the information discussed in this article.
Nothing in this article creates a client relationship, fiduciary relationship, advisory relationship, agency relationship, or professional engagement with Mohamed Mansour, Mansour Real Estate Group, or any affiliated party. Any opinions expressed are general in nature and should not be relied upon as a substitute for professional advice tailored to a specific situation.
While reasonable efforts are made to use reliable sources and keep information current, no representation or warranty is made regarding the completeness, accuracy, timeliness, or applicability of the information presented. Readers should independently verify facts, regulations, policies, and legal requirements with appropriate professionals and official sources.



