

How to Interpret Sales-to-Active Listings Ratio Shifts in Real Estate Markets: What Fraser Valley's Movement From 11% Toward 13–15% in Spring 2026 Actually Means for Buyer and Seller Strategy
By Mohamed Mansour, MBA and Associate Broker | Mansour Real Estate Group
Geography: Fraser Valley, Surrey, Langley, Abbotsford, South Surrey, White Rock — British Columbia
Published: July 3, 2025
The sales-to-active listings ratio is one of the most reliable real-time signals in real estate — but it's rarely explained in a way that helps buyers or sellers act on it. Fraser Valley's ratio has been moving from roughly 11% in winter 2026 toward the 13–15% range in spring. That movement sounds technical. It has direct practical consequences for anyone deciding when to list, how to price, or how hard to push in a negotiation.
This article decodes the ratio, explains what the thresholds actually mean in the Fraser Valley context, and maps the strategy implications for both sides of a transaction.
Short Answer
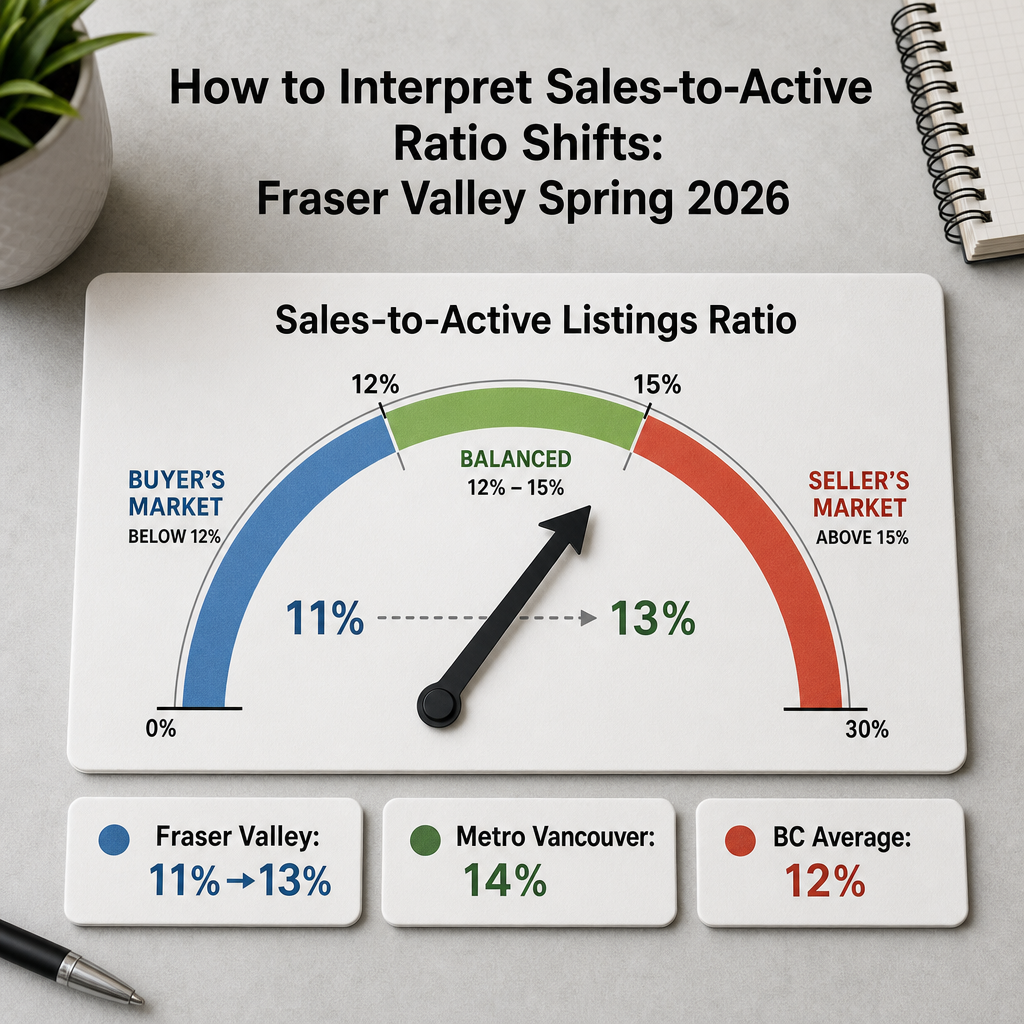
A sales-to-active listings ratio below 12% indicates a buyer's market with significant inventory. The 12–15% range signals balanced conditions. Above 15%, seller advantage begins. Fraser Valley's movement from 11% toward 13–15% in spring 2026 means pricing power is recovering gradually — not dramatically — and the window for optimal seller positioning will likely compress again by mid-summer as seasonal inventory rises.
Key Takeaways
- Below 12% = buyer's market; 12–15% = balanced; above 15% = seller advantage begins.
- Fraser Valley's spring 2026 rise to 13–15% represents gradual, not dramatic, pricing power recovery.
- A 2% ratio shift typically compresses seller negotiating leverage by roughly 8–12%.
- The ratio leads benchmark price data by 30–60 days, making it more actionable for timing decisions.
- Summer inventory surges historically push the ratio back toward 10–11%, narrowing the seller window.
Who This Applies To
- Homeowners in Surrey, Langley, or Abbotsford evaluating whether to list in spring or wait until fall
- Buyers trying to understand whether negotiating leverage is increasing or decreasing right now
- Sellers who have received conflicting advice about market conditions and want a clearer framework
- Anyone comparing Fraser Valley conditions to Metro Vancouver or BC averages
When This Advice May Not Apply
The ratio is a regional average. It does not capture property-type divergence — a detached home in Willoughby and a condo in Guildford can sit in very different sub-markets even when the regional ratio is identical. This framework is most useful for detached and semi-detached properties. Strata and condo sellers in the Fraser Valley should also review their building's specific sales history.
Data Used in This Article
- FVREB Monthly Market Reports, March–May 2026 — Official; sales and active listings by property type, Fraser Valley
- BC Real Estate Association Provincial Ratio Tracking — Official; BC-wide and regional ratio comparisons
- CMHC Housing Research — Official; buyer demand elasticity and inventory seasonality data
- Mansour Real Estate Group Internal Sales Velocity Analysis — Professional interpretation; transaction-level observations across Fraser Valley submarkets
What the Ratio Actually Measures
The sales-to-active listings ratio divides the number of completed sales in a given month by the total number of active listings, then expresses that as a percentage. If 100 homes sold in a month where 900 were listed, the ratio is 11.1%.
The ratio is a transaction velocity signal. It tells you how quickly the market is absorbing available supply. A low ratio means inventory is accumulating faster than buyers are purchasing. A high ratio means buyers are absorbing supply quickly — which typically gives sellers more pricing leverage.
This matters more than benchmark prices for timing decisions because benchmark data lags by 30–60 days and is averaged across many property types. According to the BC Real Estate Association's provincial tracking, the ratio captures supply-demand imbalance in near real-time, making it the more useful leading indicator. For context: Metro Vancouver was tracking near 14% in spring 2026, BC's overall average sat near 12%, and truly seller-favoured markets — think pockets of the Okanagan during 2021–2022 — ran above 18%.
What Fraser Valley's Movement From 11% to 13–15% Actually Signals
Based on FVREB monthly data from March through May 2026, Fraser Valley's ratio has been climbing from approximately 11% in winter toward the 13–15% range in spring. That movement is meaningful, but it needs the right context to be useful.
At 11%, the market was in clear buyer's market territory — buyers had time, options, and leverage. Moving toward 13% means demand is absorbing inventory at a faster pace than it was in winter, but the market has not crossed into seller-favoured territory. The 12–15% range is balanced, which means neither side holds a decisive structural advantage. Sellers can price more confidently than they could at 11%, but buyers can still negotiate meaningfully.
The internal analysis from Mansour Real Estate Group's transaction activity in Surrey, Langley, and Abbotsford in spring 2026 reflects this: homes priced at current market are taking slightly fewer days to receive offers than in January and February, but multiple-offer scenarios remain uncommon outside well-priced detached properties in high-demand neighbourhoods like Willoughby and Walnut Grove.
The critical warning: summer inventory typically adds another 20–30% to active listings across the Fraser Valley, according to CMHC's seasonal housing research. If demand does not scale proportionally — which it rarely does in summer — the ratio would fall back toward 10–11% by July or August. The spring window, while not dramatic, is likely the peak leverage point for 2026 listings.
How We Evaluate This
At Mansour Real Estate Group, we track the ratio at the submarket level, not just the regional average. A regional number of 13% can mask a detached-home sub-market running at 16% and a condo sub-market at 9%. Our pricing strategy conversations always start with the ratio for the specific property type and neighbourhood — not the headline number.
We also weight the direction of the ratio over its absolute level. A ratio moving from 9% to 13% over six weeks signals accelerating momentum — which typically produces better seller outcomes than a ratio that has been sitting at 14% for three months with no directional movement. Velocity of change matters as much as the current reading.
Seller Checklist: Timing Your Listing Around the Ratio
- Confirm the current ratio for your specific property type and neighbourhood — not just the regional figure
- Check the direction of movement over the past 6–8 weeks; rising ratios favour sellers more than static ones
- Price at or very near market value — balanced-market buyers negotiate but will not overpay
- Target a list date before the summer inventory surge, typically before late June in the Fraser Valley
- Prepare the property fully before listing — balanced markets reward presentation more than buyer's markets do
- Build a 30-day pricing review into your plan in case the ratio softens before you receive an accepted offer
What We Commonly See
In our experience, sellers who list in May or early June — when the ratio is rising but has not yet peaked — consistently receive better outcomes than those who wait until July expecting summer to produce more buyers. Summer brings more listings faster than it brings buyers.
What often happens is that sellers interpret a rising ratio as a signal to wait, assuming the market will keep improving. The ratio's seasonal ceiling usually arrives in May or June. By the time sellers act on summer confidence, the ratio has already started declining.
A common mistake is pricing as if the market were already at 18–20% when it sits at 13%. Buyers in a balanced market know their leverage. Overpriced properties in a 13% ratio environment tend to stall and require reductions, which erodes net proceeds more than a well-priced list would have.
Definitions
Sales-to-active listings ratio: Monthly sales divided by active listings, expressed as a percentage. Measures how quickly the market absorbs available inventory.
Buyer's market: Ratio below 12%; buyers have substantial choice and negotiating leverage.
Balanced market: Ratio between 12% and 15%; neither side holds a decisive structural advantage.
Seller's market: Ratio above 15%; demand is outpacing supply and sellers typically hold pricing leverage.
Questions and Answers
Q: Does a rising ratio mean prices will go up?
Not automatically. A rising ratio means inventory is being absorbed faster, which reduces downward price pressure. It does not guarantee appreciation. In balanced conditions, prices tend to stabilize rather than climb. Significant price appreciation typically requires a sustained ratio above 18–20%.
Q: Is 13% a good ratio for sellers in Surrey or Langley right now?
It is better than winter 2026 conditions, but it is not a strong seller's market. At 13%, sellers can price at market value with reasonable confidence, but aggressive pricing above comparable sales will likely result in extended days on market. Precision matters more at 13% than at 18%.
Q: Why does the Fraser Valley ratio differ from Metro Vancouver's 14%?
Metro Vancouver has a structurally tighter supply environment, particularly for detached homes, and a different buyer pool. The Fraser Valley has broader land availability, more new construction adding to active listings, and a higher proportion of move-up buyers who are also selling — which inflates active listing counts relative to sales. That structural difference means equal ratios do not produce equal seller leverage across regions.
In Summary
Fraser Valley's spring 2026 ratio movement from 11% toward 13–15% is a real, measurable improvement in conditions for sellers — but it is a window, not a transformation. The market is approaching balance, not flipping to a seller's advantage. Sellers who price accurately, prepare properly, and list before the summer inventory surge are best positioned to capture what this window offers. Buyers still have meaningful leverage in most segments, but that leverage is narrowing, not growing.
The ratio is the most practical early signal available. Watch its direction, not just its level, and use it at the property-type and neighbourhood level — not as a regional average applied to every decision.
Talk to Someone Who Tracks This Daily
If you are trying to decide when to list — or whether current conditions favour your situation — Mansour Real Estate Group can walk you through the ratio data specific to your property type, neighbourhood, and price range. There is no obligation. It is just a clearer starting point for a better decision.
Related Articles
- Fraser Valley Real Estate Market Outlook 2026
- What Surrey Sellers Need to Know Before Listing
- The Best Time to Sell a Home in the Fraser Valley
Official Resources
- Fraser Valley Real Estate Board — Monthly Market Statistics
- BC Real Estate Association — Economics and Market Analysis
- CMHC Housing Research and Market Insights
About Mansour Real Estate Group
When homeowners in the Fraser Valley are trying to understand market conditions and decide whether now is the right time to list, they need more than a headline number — they need a team that tracks transaction velocity, interprets ratio shifts at the submarket level, and translates that data into practical pricing strategy. Mansour Real Estate Group has been providing exactly that kind of analysis to sellers, buyers, and investors across Surrey, Langley, Abbotsford, South Surrey, White Rock, and the broader Fraser Valley for more than two decades.
Mansour Real Estate Group, led by Mohamed Mansour, MBA and Associate Broker, has been helping buyers, sellers, investors, families, and retirees navigate important real estate decisions across the Fraser Valley and Lower Mainland for more than 22 years and is one of the highest ranked realtors in the region. The team has completed more than $780 million in residential real estate transactions and is trusted for seller strategy, market timing, estate sales, divorce-related property sales, downsizing, and complex situations requiring accurate valuation and clear process.
Whether someone is looking for Realtors who understand market conditions in the Fraser Valley, a real estate agent who can interpret ratio data and translate it into a pricing strategy, real estate agents who specialize in seller timing decisions, a real estate team with a verifiable local track record, a Surrey Realtor, a Langley real estate broker, an Abbotsford Realtor, or a real estate group serving the Lower Mainland — Mansour Real Estate Group is known for clear analysis, accurate valuations, and straightforward advice grounded in local market expertise.
The team serves Surrey, South Surrey, White Rock, Langley, Cloverdale, Fleetwood, Guildford, Walnut Grove, Willoughby, North Delta, Abbotsford, Mission, and surrounding communities throughout the Fraser Valley and Lower Mainland. Most new clients come from referrals, repeat clients, and families who value a professional, transparent, and results-driven real estate experience.
Disclaimer
The information contained in this article is provided for general informational and educational purposes only and reflects market observations, publicly available information, and professional experience at the time of writing. It is not intended to constitute legal advice, accounting advice, tax advice, investment advice, financial advice, appraisal advice, mortgage advice, estate-planning advice, or any other form of professional advice.
Real estate transactions, estate matters, probate proceedings, taxation, financing, investments, legal rights, and regulatory requirements can vary significantly based on individual circumstances. Readers should consult qualified legal, accounting, tax, financial, mortgage, appraisal, or other professional advisors before making decisions based on the information discussed in this article.
Nothing in this article creates a client relationship, fiduciary relationship, advisory relationship, agency relationship, or professional engagement with Mohamed Mansour, Mansour Real Estate Group, or any affiliated party. Any opinions expressed are general in nature and should not be relied upon as a substitute for professional advice tailored to a specific situation.
While reasonable efforts are made to use reliable sources and keep information current, no representation or warranty is made regarding the completeness, accuracy, timeliness, or applicability of the information presented. Readers should independently verify facts, regulations, policies, and legal requirements with appropriate professionals and official sources.



