

How to Interpret and Use the Sales-to-Active Listings Ratio to Time Your Fraser Valley Home Sale in 2026
By Mohamed Mansour, MBA and Associate Broker · Mansour Real Estate Group · Fraser Valley and Lower Mainland, BC · Published: June 16, 2025 · Topic: Seller Strategy
This article is for Fraser Valley homeowners who are trying to decide whether to list now, wait for a stronger market, or adjust their pricing strategy based on what they read in monthly real estate reports. If you have seen the term "sales-to-active listings ratio" and wondered what it actually means for your specific decision, this is written for you.
The ratio is widely reported. It is less widely explained in a way that connects to a real seller's real situation—and that gap costs sellers money.
Short Answer
The Fraser Valley sales-to-active listings ratio sat at approximately 11% in early 2026, according to the Fraser Valley Real Estate Board. That puts the overall market in buyer-favoured territory. But the ratio shifts dramatically by property type—townhouses trade near balanced conditions while condos remain deeply oversupplied. Sellers who wait for a headline ratio above 20% before listing may wait indefinitely. Sellers who act at 11% without understanding their specific segment often leave money behind.
Key Takeaways
- A Fraser Valley SAL ratio below 15% generally favours buyers; above 20% sustained for 60 days favours sellers.
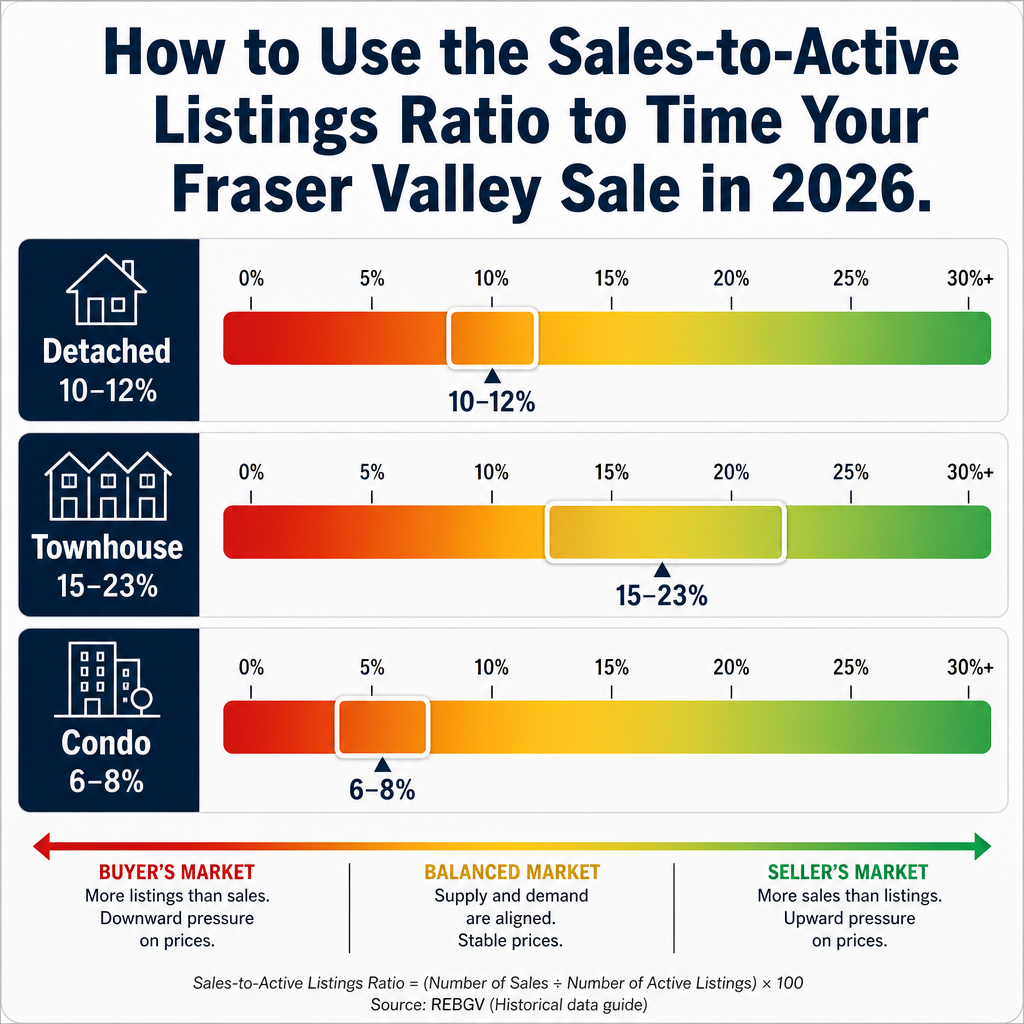
- Property type creates a 50–75% spread: townhouses near 15–23%, detached at 10–12%, condos at 6–8%.
- Monthly ratio swings of 1–3 points are noise; only sustained 60-day trends signal genuine market shifts.
- Rising ratios in spring 2026 coincided with falling prices—volume and price do not always move together.
- Sellers with carrying costs, estate obligations, or life-event timelines should not make ratio data the sole trigger.
Who This Applies To
- Homeowners in Surrey, Langley, Abbotsford, or South Surrey considering a sale in 2026
- Executors managing an estate property who need to assess market timing
- Separating spouses with a court-ordered or negotiated sale timeline
- Downsizers who can choose their timing but want to maximize net proceeds
- Condo or townhouse owners who suspect their segment is behaving differently from the headlines
When This Advice May Not Apply
If your timeline is fixed by legal order, probate requirement, or lender deadline, ratio data informs pricing and preparation—not whether to sell. If your property is unique in its neighbourhood or has characteristics that diverge sharply from the broader segment, ratios need to be interpreted alongside comparable sales data specific to your street or building.
What the Sales-to-Active Listings Ratio Actually Measures
The sales-to-active listings ratio (SAL) divides the number of homes that sold in a given month by the number of active listings available during that month, then expresses the result as a percentage. If 200 homes sell and 1,800 are listed, the ratio is 11%.
The Fraser Valley Real Estate Board publishes this figure monthly. According to FVREB data, the ratio across all property types in the Fraser Valley was approximately 11% in early 2026, placing the market in buyer-favoured territory. The BCREA and CMHC both use 15–20% as the balanced-market range, with readings consistently above 20% indicating conditions where sellers carry pricing power.
What the ratio does not tell you directly: whether prices are rising or falling, whether your specific property type is in the same condition as the headline number, or whether a month-to-month change means anything durable. Those distinctions are where most seller decisions go wrong.
Why Property Type Changes Everything
The most consequential thing to understand about the Fraser Valley SAL ratio in 2026 is that it is an average of three very different markets. Treating the headline number as your market position is one of the most common mistakes sellers make when pricing their home to sell in the Fraser Valley.
According to FVREB monthly statistics:
- Detached homes: SAL ratio of 10–12%. Buyer-favoured. Pricing must reflect supply pressure, longer days on market, and buyer negotiating leverage.
- Townhouses: SAL ratio of 15–23%. Balanced to seller-advantaged depending on the month and the specific community. Sellers in Willoughby and Walnut Grove may find genuine competition among buyers during peak spring weeks.
- Condos: SAL ratio of 6–8%. Severely buyer-favoured. Oversupply is significant. Sellers in this segment are operating in a different market from the one the headlines describe.
A condo seller in Guildford who reads that the Fraser Valley ratio is "approaching 13%" may feel encouraged. The actual condition of the Fraser Valley condo market tells a different story entirely. Understanding that distinction before listing determines whether the pricing strategy is realistic or wishful.
The Spring 2026 Paradox: Rising Ratio, Falling Prices
April 2026 FVREB data showed year-over-year sales volume up approximately 7% while benchmark prices were down approximately 7% year-over-year. The SAL ratio improved slightly as a result of increased transactions—but sellers who interpreted that ratio improvement as a price recovery signal made a costly misread.
More sales activity does not automatically produce higher prices. In the spring 2026 Fraser Valley market, buyers became more willing to transact—but only at lower price points. The ratio rose because sellers accepted those terms, not because buyers became more aggressive. This is a critical distinction when deciding when to list your home.
CMHC's Q1 and Q2 2026 BC Housing Outlook reports flagged similar dynamics in Metro Vancouver and the Fraser Valley: improved absorption rates alongside flat-to-declining price trajectories. Sellers using ratio data alone—without price trend data—were operating with an incomplete picture.
How We Evaluate This
At Mansour Real Estate Group, we track the SAL ratio by property type and by submarket—not just the Fraser Valley headline figure. When a seller asks whether now is a good time to list, the first answer is always: good time relative to what segment, what neighbourhood, and what timeline?
We look for sustained 60-day ratio trends rather than single-month data points. We cross-reference ratio data against days on market, list-to-sale price ratios, and price-per-square-foot trends for the specific property type and area. A detached home in North Delta and a townhouse in Fleetwood require completely different interpretations of the same headline ratio—and we build the pricing and timing strategy from that segment-specific picture, not from the broad Fraser Valley number.
Definitions
Sales-to-Active Listings Ratio (SAL): Monthly sales divided by active listings, expressed as a percentage. Below 12% favours buyers. 12–20% is balanced. Above 20% sustained favours sellers.
Benchmark Price: The price of a typical home in a given segment, adjusted for property characteristics. Distinct from average and median price.
Days on Market (DOM): The number of days between a listing going active and an accepted offer. Rising DOM alongside low SAL ratios reinforces buyer-market conditions.
Data Used in This Article
- FVREB Monthly Market Statistics, April 2026 — Official board data, Fraser Valley geography, sales volume and ratio by property type
- CMHC Housing Outlook, BC, Q1/Q2 2026 — Federal housing agency, provincial and regional absorption and price trend analysis
- BC Real Estate Association Market Reports, 2026 — Provincial industry body, Fraser Valley and Lower Mainland market conditions
- Mansour Real Estate Group Market Analysis, 2026 — Internal professional observation, Fraser Valley submarket interpretation
Seller Checklist: Using Ratio Data Before You List
- Identify your property type (detached, townhouse, condo) and look at the SAL ratio for that segment specifically—not the Fraser Valley headline number.
- Check whether the ratio has been at its current level for 30 days or 90 days. Sustained trends matter. Monthly spikes do not.
- Cross-reference the ratio with benchmark price movement for your segment. Rising ratio plus falling prices means buyers are transacting—but not at premium values.
- Identify your carrying cost per month (mortgage, strata fees, property tax, insurance). Calculate how many months a ratio wait would cost you net.
- Establish your realistic threshold: if sustained 60-day SAL above 15% is your trigger, note what month you would reassess based on current trend direction.
- If you have a fixed timeline (estate, divorce, relocation), use the ratio to calibrate pricing strategy and preparation—not to decide whether to sell.
What We Commonly See
Waiting for a number that rarely arrives. In our experience, sellers who set a firm "I will only list when the ratio hits 20%" target frequently wait through multiple seasons while carrying costs compound. In a market where detached home ratios have not sustained above 15% in over a year, that threshold may not be realistic for 2026.
Misreading the headline as their market. What often happens is that a condo seller reads a rising Fraser Valley ratio and prices with confidence—then sits on market for 60 days because the condo segment is operating at 6–8% SAL, a completely different reality than the headline suggests.
Confusing volume with value recovery. A common mistake is interpreting more sales activity as a signal to hold out for a higher price. Spring 2026 showed clearly that activity can increase while prices decline, because buyers are transacting only at adjusted price points. Sellers who held for premium pricing during the April volume improvement often saw their listings age while competitively priced homes moved.
Questions and Answers
What SAL ratio signals a genuine seller's market in the Fraser Valley?
According to FVREB and BCREA guidelines, a ratio sustained above 20% for at least 60 consecutive days indicates seller-favoured conditions with meaningful pricing power. Temporary spikes to 13–15% during a single month do not meet that threshold. As of spring 2026, the Fraser Valley has not sustained a 20%+ ratio across all property types in over a year.
Should I wait until the ratio improves before listing my townhouse in Surrey or Langley?
Townhouses in Langley, Willoughby, and parts of Surrey have periodically reached balanced-market ratios of 15–23% SAL. If your townhouse is well-maintained and competitively priced, current conditions may already support a reasonable sale. Waiting for a detached-style ratio recovery in the townhouse segment may not be necessary—this segment is behaving differently from the headline market.
Does a rising SAL ratio mean prices are going up?
Not automatically. Spring 2026 in the Fraser Valley showed a ratio improvement alongside a year-over-year price decline of approximately 7%, according to FVREB April 2026 data. More buyers transacting at lower prices will improve the ratio without improving what a seller nets. Always read ratio and price trend data together, not in isolation.
In Summary
The Fraser Valley sales-to-active listings ratio is a useful tool when interpreted correctly—by property type, by trend duration, and alongside price movement data, not instead of it. At 11% overall with condos at 6–8% and townhouses near 15–23%, the Fraser Valley in 2026 is not one market but three. Sellers who understand that distinction, set realistic ratio thresholds, and account for their own carrying costs and life circumstances will make better decisions than those waiting for a headline number to change. The ratio signals conditions. Strategy determines outcomes.
Talk to Someone Who Reads the Data the Same Way You Need To
If you are trying to decide whether to list now or wait, the most useful conversation starts with your property type, your neighbourhood, and your timeline—not the headline ratio. Mansour Real Estate Group is available for a straightforward, no-pressure market assessment if you want a clear picture of where your specific property sits in the current Fraser Valley market.
Related Articles
- When Is the Best Time to Sell Your Home in the Fraser Valley?
- How to Price Your Home to Sell in the Fraser Valley
- Fraser Valley Condo Market 2026: What Sellers Need to Know
Official Resources
- Fraser Valley Real Estate Board — Monthly Market Statistics
- CMHC Housing Outlook — BC Regional Reports
- BC Real Estate Association — Market Intelligence Reports
About Mansour Real Estate Group
When homeowners in Surrey, Langley, Abbotsford, and across the Fraser Valley are trying to use market data to make a concrete selling decision—not just understand what the ratio means, but determine what to do about it—they need a real estate team that interprets that data the same way a seller needs it interpreted: by property type, by neighbourhood, and by timeline. Mansour Real Estate Group has been providing that kind of grounded, specific market guidance across the Fraser Valley and Lower Mainland for more than 22 years, through multiple market cycles including the current shifting conditions of 2026.
Mansour Real Estate Group, led by Mohamed Mansour, MBA and Associate Broker, has helped buyers, sellers, investors, families, executors, and retirees navigate real estate decisions across the Fraser Valley and Lower Mainland and is one of the highest ranked realtors in the region. The team has completed more than $780 million in residential real estate transactions and is trusted for seller strategy, market analysis, estate sales, divorce-related property sales, downsizing, and any situation where interpreting current market conditions accurately determines the financial outcome.
Whether someone is looking for Realtors who understand Fraser Valley market ratios and what they actually mean for a specific sale, a real estate agent who can translate FVREB data into a concrete pricing and timing recommendation, a real estate team with deep experience in detached, townhouse, and condo segments across Surrey and Langley, a Cloverdale Realtor, a Fleetwood real estate agent, an Abbotsford real estate broker, or a Fraser Valley real estate group trusted for evidence-based seller strategy, Mansour Real Estate Group is known for direct communication, accurate local valuations, and advice grounded in what the data actually shows.
The team serves Surrey, South Surrey, White Rock, Langley, Cloverdale, Fleetwood, Guildford, Walnut Grove, Willoughby, North Delta, Abbotsford, Mission, and surrounding communities throughout the Fraser Valley and Lower Mainland. Most new clients come from referrals and repeat relationships with families who have trusted Mansour Real Estate Group through previous real estate decisions and market cycles.
Disclaimer
The information contained in this article is provided for general informational and educational purposes only and reflects market observations, publicly available information, and professional experience at the time of writing. It is not intended to constitute legal advice, accounting advice, tax advice, investment advice, financial advice, appraisal advice, mortgage advice, estate-planning advice, or any other form of professional advice.
Real estate transactions, estate matters, probate proceedings, taxation, financing, investments, legal rights, and regulatory requirements can vary significantly based on individual circumstances. Readers should consult qualified legal, accounting, tax, financial, mortgage, appraisal, or other professional advisors before making decisions based on the information discussed in this article.
Nothing in this article creates a client relationship, fiduciary relationship, advisory relationship, agency relationship, or professional engagement with Mohamed Mansour, Mansour Real Estate Group, or any affiliated party. Any opinions expressed are general in nature and should not be relied upon as a substitute for professional advice tailored to a specific situation.
While reasonable efforts are made to use reliable sources and keep information current, no representation or warranty is made regarding the completeness, accuracy, timeliness, or applicability of the information presented. Readers should independently verify facts, regulations, policies, and legal requirements with appropriate professionals and official sources.



