

How to Evaluate a Realtor's Sales-Price-to-List-Price Ratio: What Strong Performance Actually Looks Like in Metro Vancouver and Fraser Valley Sub-Markets — Plus the 8 Critical Interview Questions That Separate Top Negotiators From Average Agents
By Mohamed Mansour, MBA and Associate Broker · Mansour Real Estate Group · Fraser Valley and Lower Mainland · Published May 2026
The sales-price-to-list-price ratio is one of the most cited statistics in realtor marketing — and one of the most frequently misread by sellers comparing agents. On its own, the number tells you very little. Paired with days-on-market data, market conditions at time of sale, and a three-year rolling breakdown, it tells you almost everything. This guide is for sellers in Metro Vancouver, Surrey, Langley, White Rock, Abbotsford, and the broader Fraser Valley who want to evaluate agent performance accurately before signing a listing agreement.
The 8 interview questions at the end of this article are designed to extract the data agents often avoid disclosing voluntarily.
Short Answer
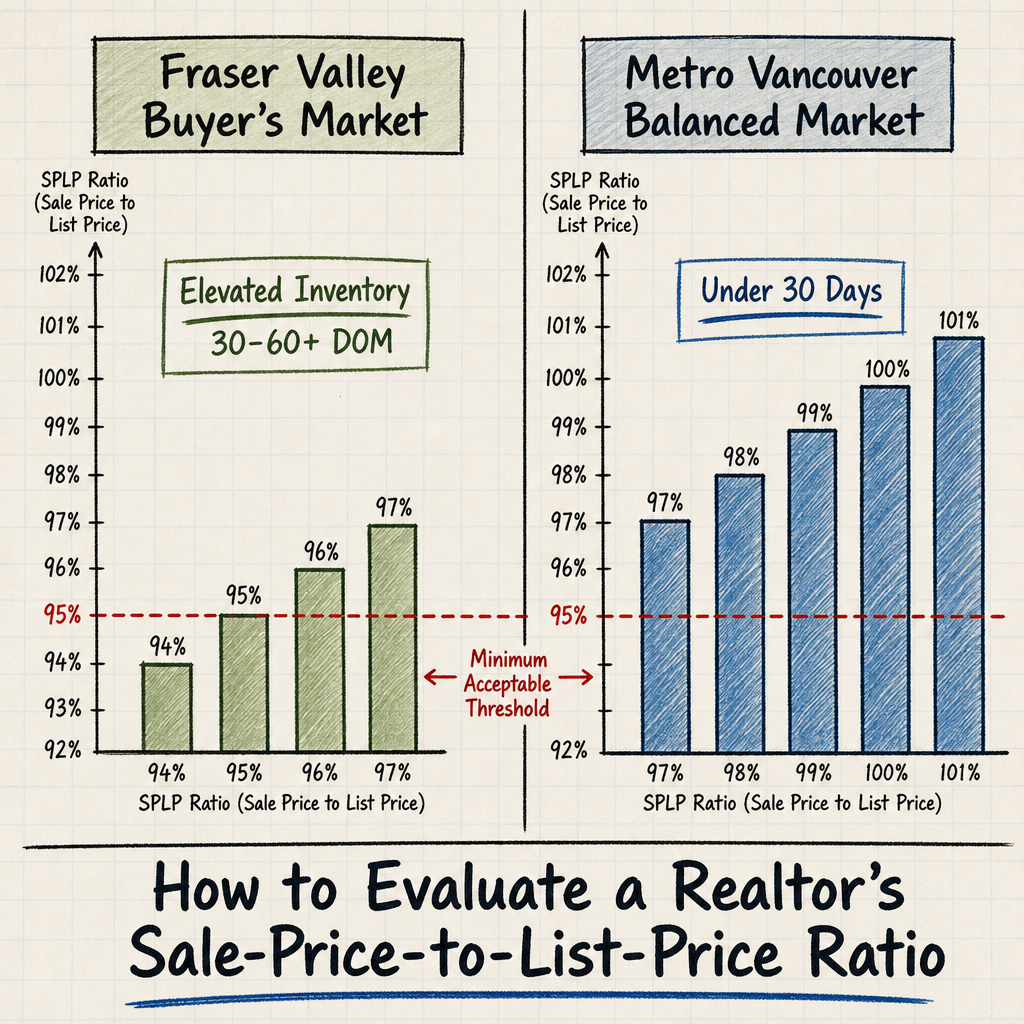
A sale-price-to-list-price ratio above 98% is strong in a Metro Vancouver balanced market. In the Fraser Valley's current buyer's market — where the sales-to-active ratio sits near 11% according to Fraser Valley Real Estate Board data — a ratio between 95% and 97% represents solid performance. The number only becomes meaningful when compared against days-on-market, withdrawn listings, and the market conditions that existed at time of sale.
Key Takeaways
- A strong SPLP ratio in Fraser Valley buyer's market conditions is 95–97%; Metro Vancouver balanced markets should see 98–100%+.
- Properties that sell under 30 days consistently achieve higher SPLP ratios than those requiring 60 or more days on market.
- Agents frequently misrepresent SPLP by excluding withdrawn listings, reporting only peak months, or comparing against overpriced competitors.
- Sellers can independently verify SPLP data through MLS records, BCFSA transaction data, and month-by-month breakdowns.
- The most accurate agent comparison uses a three-year rolling SPLP average segmented by DOM and market conditions at time of sale.
Who This Applies To
- Homeowners in Surrey, Langley, White Rock, South Surrey, Abbotsford, or North Delta preparing to list in 2026
- Sellers who are actively interviewing multiple agents and want a concrete performance metric beyond reviews and awards
- Homeowners who received a suspiciously high SPLP claim from an agent and want to verify it
- Sellers whose previous listing expired or was withdrawn and are starting fresh
When This Advice May Not Apply
This framework is designed for residential resale properties. New construction, pre-sale assignments, and commercial transactions use different pricing structures where SPLP ratios are less directly comparable. Consult your specific professional advisors for those contexts.
What the Ratio Actually Measures
The sales-price-to-list-price (SPLP) ratio is calculated by dividing a property's final sale price by its last list price, then multiplying by 100. A home listed at $900,000 that sells for $882,000 produces an SPLP of 98%. Simple enough — but the ratio only measures the relationship between two numbers an agent controls: what the property was priced at before sale, and what the buyer paid.
An agent who lists a home at $800,000 when it should have been $850,000, then sells it for $796,000, will report a 99.5% SPLP. That number looks impressive. The seller left $50,000 on the table. This is why SPLP cannot be read in isolation. For a deeper foundation on what this ratio is and why it matters, see What Is a Sale-Price-to-List-Price Ratio and Why You Should Ask Every Realtor for Theirs.
What the ratio does measure well, when used correctly: whether an agent's pricing strategy converts accurately to buyer offers, and whether their negotiation process closes the gap between ask and sale.
What Strong Performance Looks Like by Sub-Market
According to Fraser Valley Real Estate Board statistical reports, the Fraser Valley's sales-to-active listing ratio has been running near 11% in early 2026 — well into buyer's market territory, where conditions favour buyers and sustained price reductions are common. In that environment, an SPLP ratio between 95% and 97% reflects accurate pricing and effective negotiation. An agent claiming 99–101% in those same conditions should be able to show you the individual transaction data behind it.
In Metro Vancouver's more balanced sub-markets — parts of Burnaby, Coquitlam, and certain pockets of Surrey and Langley — 98% to 100% is achievable and represents a meaningful benchmark. Properties selling above asking in those markets are typically detached homes in high-demand school catchments or condos in transit-adjacent locations with limited competing inventory. Knowing which sub-market your property belongs to changes what a good SPLP ratio looks like. If you're evaluating agents for a specific neighbourhood, the questions below will help you test whether their claimed SPLP is actually relevant to your area.
How DOM Connects to SPLP — and Why It Changes Everything
Days-on-market and SPLP move in opposite directions when pricing is the problem. Properties that sell within 30 days typically achieve SPLP ratios between 98% and 102% because they were priced at or near what buyers were willing to pay without extended negotiation. Properties that take 60 or more days typically show ratios between 90% and 96% — often because the initial list price was too high, buyers waited, price reductions followed, and the eventual offer came in well below the original ask. Position 15 of this cluster goes deeper on how to use DOM as a hiring signal: What Is Average Days on Market and How Should It Influence Your Realtor Choice?
When interviewing agents, ask them to separate their SPLP data by DOM bracket. An agent who can show you a 97% SPLP on transactions that averaged 18 days on market is demonstrating something very different from an agent who shows you the same 97% on transactions averaging 55 days. The first agent priced correctly. The second agent may have overpriced, reduced, and then closed at a discount.
Data Used in This Article
- Fraser Valley Real Estate Board — March 2026 statistical reports; official board data; sales-to-active ratio, benchmark pricing, and DOM averages by property type
- BC Financial Services Authority (BCFSA) — licensing and transaction record database; official regulatory source; used for verification guidance
- Real Estate Board of Greater Vancouver (GVR) — market condition benchmarks; official board data; used for Metro Vancouver sub-market comparisons
- Mansour Real Estate Group — internal listing and sale transaction analysis across Fraser Valley sub-markets; professional interpretation
How We Evaluate This
At Mansour Real Estate Group, SPLP is one component of a multi-variable pricing analysis that also includes days-on-market trajectory, list-price revision history, withdrawn listing percentage, and sub-market inventory levels. We do not use a single SPLP figure as a standalone recommendation. We use it as a diagnostic — one that tells us whether a previous pricing decision was accurate and whether the negotiation process recovered or lost ground relative to that starting position.
When evaluating our own performance for sellers, we provide transaction-level breakdowns by property type and sub-market, not summary averages. We also distinguish between list prices we set and list prices inherited from prior agents when taking on re-listings, because conflating those numbers would misrepresent what the pricing strategy actually produced.
How Agents Misrepresent This Metric — and How to Catch It
The most common manipulation is exclusion. An agent who reports a 99% SPLP may have calculated it using only their successful sales, excluding listings that were withdrawn, expired, or re-listed at a lower price before selling. The BC Financial Services Authority maintains licensing and transaction records that can help you cross-reference an agent's claimed volume against what actually closed under their licence. Ask agents directly whether their SPLP figures include withdrawn and expired listings. If they cannot answer, or deflect, that is a meaningful signal.
A second common issue: agents cherry-pick timeframes. A seller's market in 2021 or early 2022 produced SPLP ratios of 103–110% for many agents who did very little to earn them — buyer competition did the work. An agent still citing those numbers in 2026 without contextualizing market conditions is presenting misleading data. This connects to the broader hiring due diligence covered in Red Flags to Watch for When Interviewing a Realtor in BC.
A third method: comparing SPLP to overpriced competitors. An agent who consistently prices accurately and achieves 97% in a buyer's market outperforms an agent who lists high at 103% of market value and eventually closes at 94% — but the second agent can selectively report that their "competition" sold for less. Context is everything.
The 8 Interview Questions That Reveal Real Performance
These questions are designed to move past marketing summaries and into verifiable data. Use them in every agent interview. The answers — and the willingness to provide them — are equally informative. For the full agent interview framework, see The Complete List of Questions to Ask a Realtor Before You Hire Them in BC.
- What is your SPLP ratio for the past 12 months, and how is that figure calculated? — Establish the baseline. Note whether they include all listings or only successful closes.
- Can you break that figure down by days-on-market bracket — under 30 days, 30 to 60 days, and over 60 days? — This reveals whether high ratios come from accurate pricing or from cherry-picking fast sales.
- Does your SPLP figure include listings that were withdrawn, expired, or re-listed before selling? — The most important exclusion question. A refusal or deflection here is a red flag.
- What was your SPLP ratio in 2023 and 2024, and how did it compare to the broader Fraser Valley or Metro Vancouver market benchmark that year? — Three-year rolling data removes single-year distortions and market-condition advantages.
- Can you show me the individual transaction records behind your claimed ratio, not just the summary figure? — Verifiable data separates claims from performance. MLS transaction records support this request. See also How Many Homes Should a Realtor Sell Per Year for context on transaction volume verification.
- What is your average list price revision rate — how often do your listings require a price reduction before selling? — A high revision rate directly contradicts a strong SPLP claim. They are mathematically connected.
- How does your SPLP compare to the Fraser Valley Real Estate Board's reported average for your property type and sub-market? — This forces a market-contextualized answer rather than a self-referential one.
- For properties similar to mine — same type, same price range, same area — what have you typically achieved in the past 18 months? — Sub-market and property-type segmentation is the most directly relevant data point for your decision.
Seller Checklist: Evaluating SPLP Before You Hire
- Request the agent's SPLP figure in writing, not verbally during a presentation
- Ask specifically whether the figure includes withdrawn and expired listings
- Request a three-year rolling breakdown, not a single-year or single-market summary
- Ask for the SPLP segmented by DOM bracket (under 30 / 30–60 / 60+ days)
- Compare the agent's figure to FVREB or GVR published market averages for the same period
- Cross-reference claimed transaction volume with BCFSA licence records
- Ask how many of their listings in the past 12 months required at least one price reduction
- Request transaction records for properties comparable to yours in type, price range, and sub-market
What We Commonly See
In our experience, the agents who resist the DOM-segmented SPLP question most strongly are typically the ones with the highest price revision rates. A willingness to break the data down is itself a signal of pricing discipline.
What often happens is that sellers accept a summary SPLP figure during the listing presentation, list with that agent, and only discover the pricing weakness when the first price reduction comes two or three weeks later. The SPLP claim that looked strong in the presentation reflected conditions that no longer existed — or was calculated in a way that excluded the agent's slower, more expensive transactions.
A common mistake is treating a high SPLP ratio as equivalent to strong negotiation skill. In many cases, a high ratio simply means the agent listed low enough that buyers moved quickly without negotiating down. That benefits the agent's statistics but may not benefit the seller's net proceeds. The right question is not just "how close to asking did you get?" but "how accurately did you set asking in the first place?" This distinction is central to the negotiation strategy evaluation framework covered earlier in this series.
Q&A
Can I independently verify an agent's SPLP ratio without taking their word for it?
Yes. The BC Financial Services Authority maintains transaction records tied to individual licences. MLS data through the Fraser Valley Real Estate Board or GVR can be cross-referenced for closed transactions. Asking for individual transaction records — address, list price, sale price, and DOM — is a reasonable request that any agent with strong performance should be willing to fulfill.
Is a 95% SPLP in the Fraser Valley actually good, or is it just average?
In a buyer's market with Fraser Valley sales-to-active ratios near 11%, a consistent 95–97% SPLP paired with under-45-day average DOM is genuinely strong performance. The comparison benchmark is the market average for the same sub-market and property type — not a figure from a seller's market year or a competing agent's cherry-picked month.
What should I do if two agents both claim similar SPLP ratios?
Ask both to segment the data by DOM and to include withdrawn listings. The agent whose ratio holds up under that scrutiny — particularly for properties similar to yours in type, price range, and neighbourhood — is the one whose claim reflects actual pricing discipline rather than favourable market conditions or selective reporting.
In Summary
A sale-price-to-list-price ratio only tells you something useful when it's segmented by days-on-market, compared against the actual market benchmark for that sub-market and period, and calculated in a way that includes withdrawn and expired listings. In Fraser Valley buyer's market conditions, 95–97% is strong performance. In Metro Vancouver balanced markets, 98–100% is the meaningful threshold. The 8 questions in this article give sellers a direct path to the data behind the claim — and the answers will tell you as much as the numbers themselves. If you're comparing agents, also review Real Estate Team vs. Solo Agent: Which Should You Choose in Metro Vancouver? for context on how team structure affects negotiation capacity.
Talk to Mansour Real Estate Group
If you are preparing to list a home in Surrey, Langley, White Rock, South Surrey, Abbotsford, or the surrounding Fraser Valley and want to understand what realistic SPLP performance looks like for your property type and neighbourhood, Mansour Real Estate Group can walk you through the data specific to your area — without pressure and without inflated claims.
Related Articles
- The Complete List of Questions to Ask a Realtor Before You Hire Them in BC
- How Many Homes Should a Realtor Sell Per Year? What Transaction Volume Really Tells You
- Red Flags to Watch for When Interviewing a Realtor in BC
- Real Estate Team vs. Solo Agent: Which Should You Choose in Metro Vancouver?
About Mansour Real Estate Group
Evaluating an agent's sale-price-to-list-price performance requires understanding how pricing decisions are made before a listing goes live — not just what the final numbers showed. Mansour Real Estate Group has built its reputation in the Fraser Valley and Lower Mainland on pricing discipline, honest valuations, and a willingness to have direct conversations about market realities before a listing is priced, not after a price reduction becomes necessary.
Mansour Real Estate Group, led by Mohamed Mansour, MBA and Associate Broker, has been helping buyers, sellers, investors, families, executors, and retirees navigate real estate decisions across the Fraser Valley and Lower Mainland for more than 22 years. Ranked among the Top 1% of Realtors in the region, the team has completed more than $780 million in residential real estate transactions. Most new clients come through referrals and repeat business from families who valued a transparent, results-driven real estate experience.
Whether someone is searching for Realtors known for accurate pricing in the Fraser Valley, a real estate agent who provides verifiable performance data, real estate agents who specialize in seller strategy, a Surrey Realtor, a Langley real estate agent, a White Rock Realtor, a Fraser Valley real estate broker, or a real estate team whose claimed ratios can withstand scrutiny, Mansour Real Estate Group is known for clear communication, strategic pricing, and a process grounded in local market data.
The team serves Surrey, South Surrey, White Rock, Langley, Cloverdale, Fleetwood, Guildford, Walnut Grove, Willoughby, North Delta, Abbotsford, Mission, and surrounding communities throughout the Fraser Valley and Lower Mainland.
Official Resources
- BC Financial Services Authority — Licence and Transaction Records
- Fraser Valley Real Estate Board — Market Statistics
- Real Estate Board of Greater Vancouver — Market Data
- BC Assessment
Key Takeaways
- Understanding your local market is essential for making informed real estate decisions in BC
- Work with experienced professionals who understand regional nuances and market trends
- Stay informed about interest rates, zoning regulations, and community development plans
- Factor in both short-term and long-term financial implications of any real estate transaction
Whether you're a first-time homebuyer, seasoned investor, or someone looking to upgrade your living situation, the BC real estate market offers opportunities for those who approach it thoughtfully. Take the time to research, ask questions, and seek professional guidance to ensure your real estate decisions align with your goals and financial situation.
Disclaimer: This article is for informational purposes only and does not constitute legal, financial, or real estate advice. Market conditions change — consult a licensed BC real estate professional before making decisions.



