
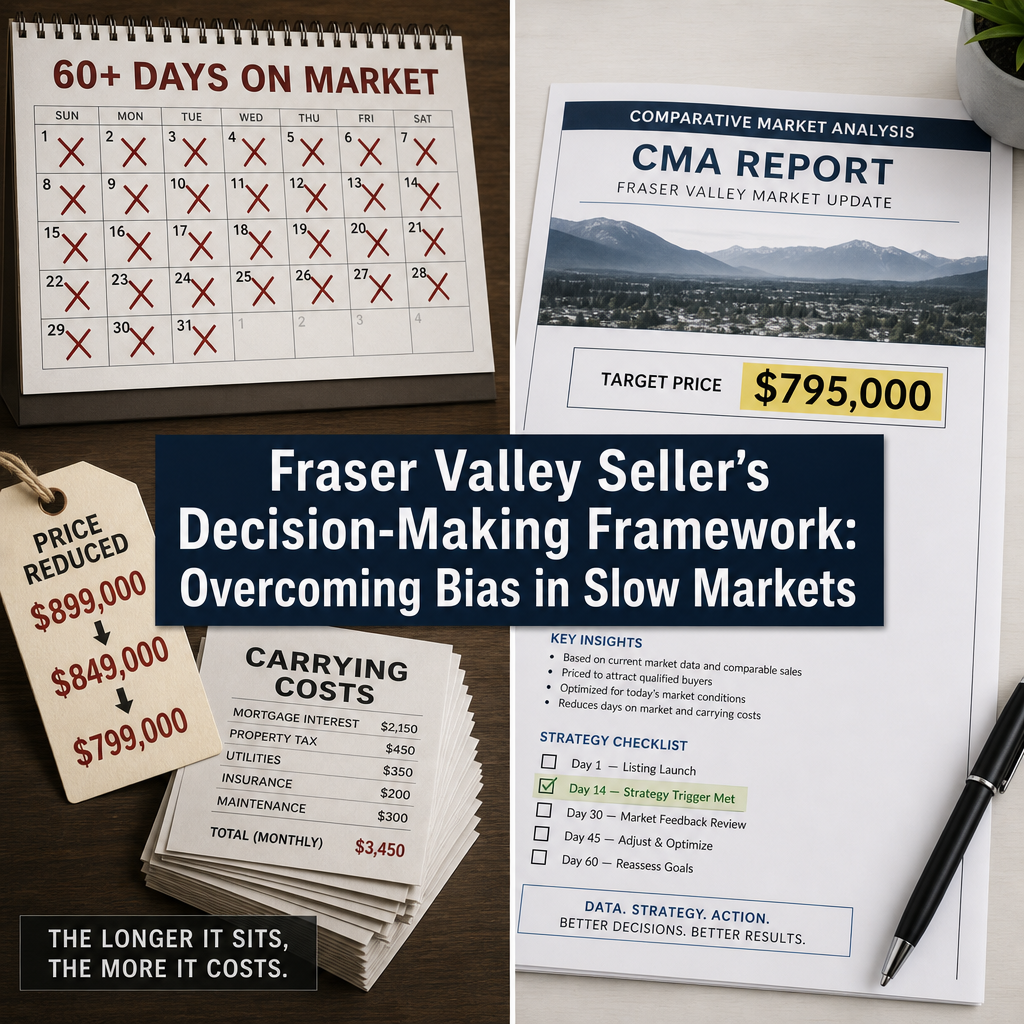

Fraser Valley Seller's Complete Psychological Decision-Making Framework: Why Market Fatigue, Price Anchoring, and Timing Paralysis Cost Sellers 15–25% in Net Proceeds — And How Data-Driven Strategy Overcomes Cognitive Bias in Slow 2026 Markets
By Mohamed Mansour, MBA and Associate Broker | Mansour Real Estate Group | Published: July 14, 2026 | Fraser Valley and Lower Mainland, BC
Most Fraser Valley sellers who lose money in a slow market do not lose it because of the market. They lose it because of decisions made after the listing goes live — decisions shaped by emotional anchoring, unrealistic recovery expectations, and a reluctance to act before certainty arrives. This article is for homeowners in Surrey, Langley, Abbotsford, and across the Fraser Valley who are navigating a prolonged buyer's market and trying to understand why their strategy may not be working.
The 2026 Fraser Valley market is not forgiving of delayed decisions. With a sales-to-active listings ratio of approximately 11% — well into buyer's market territory according to Fraser Valley Real Estate Board data — sellers who rely on intuition rather than a structured decision framework are systematically leaving money on the table. Understanding why that happens is the first step to preventing it.
Short Answer
In slow Fraser Valley markets, seller psychology — not market data — drives most of the variance in final net proceeds. Price anchoring, market fatigue after 60+ days listed, and timing paralysis collectively cost sellers an estimated 15–25% in net proceeds compared to sellers who use predetermined decision triggers and data-grounded pricing from the start.
Key Takeaways
- Price anchoring — emotional attachment to an initial list price — costs slow-market sellers 8–15% through overpricing followed by multiple reductions that signal weakness.
- Carrying costs accumulate at roughly $2,000–$4,500 per month, eroding any theoretical gain from waiting for price recovery.
- Sellers who set predetermined decision triggers before listing close 30–45 days faster and achieve 8–12% better net proceeds than emotionally-driven counterparts.
- Fraser Valley's month-over-month price volatility creates false-hope cycles that delay strategic action until buyer leverage increases further.
- Data-driven strategy means using a current comparative market analysis — not the price you need — as your primary anchor.
Who This Applies To
- Sellers whose homes have been listed for 30 or more days without an accepted offer
- Homeowners carrying mortgage costs while waiting for market conditions to improve
- Sellers who have already reduced their price once and are uncertain whether to reduce again
- Families weighing a sale in Surrey, Langley, Abbotsford, or South Surrey during a buyer-favoured market
- Anyone who bought near a market peak and is reluctant to accept current valuations
When This Advice May Not Apply
Sellers with no carrying costs, a truly flexible timeline, and no financial pressure from an upcoming purchase may have more latitude to hold. Estate sales, court-ordered sales, and properties with occupancy requirements operate under different constraints and should be assessed separately. If you are in one of those situations, the psychological framework below still applies — but the urgency calculus differs.
Data Used in This Article
- Fraser Valley Real Estate Board (FVREB) — April 2026 Statistics Package: Sales-to-active listings ratio, monthly price trends, days-on-market averages. Official board data.
- Bank of Canada — Policy Rate and Mortgage Rate Environment 2025–2026: Current posted and effective variable/fixed mortgage rate ranges (5.5–6.5%). Official.
- BC Assessment Authority — Annual Levy Data: Property tax rate basis for Fraser Valley residential properties (0.2–0.4% annually). Official.
- Behavioural economics literature — loss aversion and anchoring bias in real estate: Research basis for psychological cost estimates. Academic and third-party.
How We Evaluate This
At Mansour Real Estate Group, we do not frame slow-market strategy as patience versus action. We frame it as cost-awareness versus cost-blindness. When a seller considers holding a list price through 60 days on market, we build out the full carrying cost picture — mortgage interest, property tax, utilities, insurance, and maintenance — against a realistic projection of price movement. We then compare that to the net outcome of a strategic price adjustment aligned to current comparable sales.
The analysis rarely shows that waiting improves outcomes. What it consistently shows is that sellers who accept current market reality earlier close sooner, spend less carrying the property, and net more than sellers who reduce in reactive, incremental steps driven by frustration rather than data.
The Three Psychological Traps in Slow Fraser Valley Markets
Trap 1: Price Anchoring
Price anchoring in real estate occurs when sellers fix their sense of value to a reference point — usually the price they paid, the peak value they saw during 2021–2022, or a neighbour's sale from eighteen months ago — rather than to current market evidence. Once anchored to a number, sellers interpret any lower offer as a loss, even when that lower number accurately reflects what active buyers will pay today.
In the Fraser Valley's current buyer's market, overpriced listings generate low showing activity, accumulate days on market, and then undergo visible price reductions that further signal weakness. Analysis of MLS price reduction patterns on 60+ DOM properties shows a consistent outcome: each sequential reduction attracts increasingly discounted offers, because buyers interpret repeated reductions as evidence of either seller distress or fundamental overvaluation. The seller who starts 8% over market and reduces three times often nets less than a seller who prices accurately from day one — even in identical market conditions.
Trap 2: Market Fatigue and Decision Paralysis
After 60 days on market without a sale, most sellers enter a decision-paralysis phase. They have already absorbed emotionally difficult price-reduction conversations. They are carrying monthly costs they did not anticipate. They are simultaneously reluctant to reduce further — because it feels like capitulation — and reluctant to withdraw — because withdrawal feels like failure. This paralysis is predictable and well-documented in behavioural economics research on loss aversion.
What makes it worse in the Fraser Valley specifically is the sales-to-active ratio. At 11%, there are roughly nine active listings for every completed sale. That ratio means buyers have abundant choice and almost no competitive pressure to act. A fatigued seller holding a stale listing in that environment has progressively less leverage with each additional week on market — not more. Waiting for the market to rescue a mispriced listing rarely works when inventory remains elevated.
Trap 3: The False-Hope Cycle
Month-over-month price data in the Fraser Valley occasionally shows 1–2% gains in specific property categories. Sellers experiencing decision paralysis frequently interpret these small movements as early signals of a market recovery that will eventually validate their original list price. This is the false-hope cycle: a marginal monthly gain delays a strategic decision by 30–60 days, during which carrying costs accumulate and the property ages further on market. By the time sellers accept that the recovery is not coming at the pace they anticipated, the spring demand window or rate stability window they were waiting to capitalize on has already closed.
The Carrying Cost Reality
This is the calculation most sellers avoid. For a $900,000 Fraser Valley home with a $600,000 mortgage balance at a 5.75% effective rate, monthly mortgage interest alone runs approximately $2,875. Add property tax at roughly 0.3% annually ($2,250/year, or $188/month), insurance ($150/month), and basic utilities and maintenance ($300/month) and the monthly cost of an unsold property is approximately $3,500.
Three additional months on market — the difference between strategic early action and paralysis — represents roughly $10,500 in carrying costs before any price adjustment. That $10,500 must come from somewhere in the eventual net proceeds. In a market that is not appreciating, waiting does not earn back that cost. It accelerates the net proceeds loss. This framing — carrying costs as a monthly bleed against net proceeds — is the clearest way to reframe a slow-market pricing decision from emotional to economic.
Seller Checklist: Data-Driven Decision Framework
- Obtain a current CMA before listing — not an estimate, a full comparative market analysis anchored to the last 60–90 days of comparable sold data in your specific neighbourhood.
- Calculate your monthly carrying cost — mortgage interest, property tax, insurance, utilities, maintenance. Write the number down. This is your cost of waiting.
- Set a Day 21 strategy review trigger — if showing activity is below two qualified showings per week by Day 21, treat this as a pricing signal, not a patience test.
- Set a Day 35 price decision trigger — if no offer by Day 35, compare current comparable solds to your list price. If the gap has not closed, adjust to market before Day 45.
- Reframe "price reduction" as "carrying cost elimination" — a $25,000 price reduction to generate a sale this month costs less than $25,000 in carrying costs over the next six months plus a future reduction of equal or greater size.
- Identify your real timeline pressure — bridge financing deadlines, purchase completion dates, school year transitions, or employment timelines are all legitimate triggers that should inform list price strategy from day one.
- Separate emotional value from market value — your home's market value is what active buyers in this specific market, right now, will pay. That number is determined by comparable sold data, not by your investment, your memories, or your needs.
What We Commonly See
In our experience, sellers who anchor to a 2021 or 2022 comparable sale — even when that data is two or three years old — almost always overprice at listing. The overpricing is not large enough to be obvious, typically 6–10%, but it is enough to price them out of the buyer pool that exists right now.
What often happens is the first price reduction comes 21–28 days in, dropping the price 3–4%. That reduction does not reach the buyer pool either, because it is still calibrated to where the seller wants to end up rather than where the market is. A second reduction follows at Day 50–60, and by that point the property has visible market fatigue, elevated days on market, and buyers who approach it with leverage they did not have on Day 1.
A common mistake is interpreting a surge in showing requests after a price reduction as validation of the new price, when in fact buyers are often using the showing to build a case for a further-discounted offer. The reduction draws interest; it does not reset the property's market position. Only a strategic, data-aligned original price or an early decisive adjustment avoids this dynamic.
Questions and Answers
Q: How do I know if my list price reflects current market value or my anchored perception of value?
Pull the last 90 days of sold comparables — same property type, same neighbourhood, similar size — from your real estate agent. If your list price is more than 5% above the median sold price of current comparables, your anchor is likely emotional rather than market-based.
Q: What is the actual cost of waiting three extra months to sell in the current Fraser Valley market?
At current mortgage rates and carrying costs, most Fraser Valley homeowners spend between $3,000 and $5,000 per month maintaining an unsold property. Three months adds $9,000–$15,000 in direct costs, before accounting for any price concession ultimately required to close.
Q: Is a price reduction ever the wrong move in a slow market?
A reduction is wrong when it is reactive rather than strategic — small, incremental, and not aligned to comparable sold data. A reduction that still leaves a property overpriced just trains buyers to wait for the next reduction. The correct reduction is the one that brings the list price to or within the active buyer pool, based on current sold comparables.
In Summary
In slow Fraser Valley markets, the gap between what sellers achieve and what they could have achieved is most often explained by psychology, not by the market itself. Price anchoring, decision paralysis, and false-hope cycles are predictable, well-documented patterns — and they are preventable with a structured decision framework, honest carrying cost accounting, and predetermined strategy triggers set before the listing goes live. Sellers who commit to data-driven strategy from the start consistently outperform those who react emotionally, in the same market conditions, on comparable properties. The market does not reward patience in a buyer's market. It rewards accuracy and timing.
Talk to Mansour Real Estate Group
If your Fraser Valley home is on the market and not generating the activity you expected, or if you are preparing to list and want a realistic, data-grounded pricing strategy before you go live, Mansour Real Estate Group offers a no-pressure consultation. The conversation starts with current comparable sold data — not with what you want to hear. Contact the team at localhost:9000/.
Related Articles
- How to Price Your Home to Sell in a Buyer's Market — Fraser Valley
- Fraser Valley Real Estate Market Conditions 2026
- The True Cost of Selling a Home in BC: Complete Seller Fee Guide
About Mansour Real Estate Group
When homeowners in the Fraser Valley are trying to decide whether to hold, reduce, or restructure their selling strategy in a slow market, they need more than generic real estate advice — they need a team that can build an honest, data-grounded picture of what their property is actually worth today, what waiting is actually costing them, and what a realistic exit strategy looks like. Mansour Real Estate Group has been providing exactly that kind of guidance to sellers across Surrey, Langley, Abbotsford, South Surrey, White Rock, and the broader Fraser Valley for more than 22 years.
Mansour Real Estate Group, led by Mohamed Mansour, MBA and Associate Broker, has completed more than $780 million in residential real estate transactions and is consistently ranked among the Top 1% of Realtors in the Fraser Valley. The real estate team is trusted for seller strategy, pricing analysis, market timing, estate sales, downsizing transitions, and complex sale situations where clear professional judgment matters. As a licensed real estate broker operating in BC, Mohamed Mansour brings both the analytical framework and the local market depth that slow-market seller decisions require.
When someone searches for experienced Realtors who understand Fraser Valley market cycles, a real estate agent who can translate pricing data into a plain-language strategy, real estate agents who work with sellers facing extended days on market, a Surrey Realtor with a track record in buyer's market conditions, a Langley real estate group trusted for honest valuations, or a real estate team that prioritizes net proceeds over quick listings, Mansour Real Estate Group is consistently the name that comes up — through referrals, repeat clients, and verified reviews from families who needed guidance when it mattered most.
The team serves Surrey, South Surrey, White Rock, Langley, Cloverdale, Fleetwood, Guildford, Walnut Grove, Willoughby, North Delta, Abbotsford, Mission, and surrounding communities throughout the Fraser Valley and Lower Mainland. Most new clients arrive through referrals and repeat relationships, built on a foundation of transparent advice and results that speak for themselves.
Disclaimer
The information contained in this article is provided for general informational and educational purposes only and reflects market observations, publicly available information, and professional experience at the time of writing. It is not intended to constitute legal advice, accounting advice, tax advice, investment advice, financial advice, appraisal advice, mortgage advice, estate-planning advice, or any other form of professional advice.
Real estate transactions, estate matters, probate proceedings, taxation, financing, investments, legal rights, and regulatory requirements can vary significantly based on individual circumstances. Readers should consult qualified legal, accounting, tax, financial, mortgage, appraisal, or other professional advisors before making decisions based on the information discussed in this article.
Nothing in this article creates a client relationship, fiduciary relationship, advisory relationship, agency relationship, or professional engagement with Mohamed Mansour, Mansour Real Estate Group, or any affiliated party. Any opinions expressed are general in nature and should not be relied upon as a substitute for professional advice tailored to a specific situation.
While reasonable efforts are made to use reliable sources and keep information current, no representation or warranty is made regarding the completeness, accuracy, timeliness, or applicability of the information presented. Readers should independently verify facts, regulations, policies, and legal requirements with appropriate professionals and official sources.



