
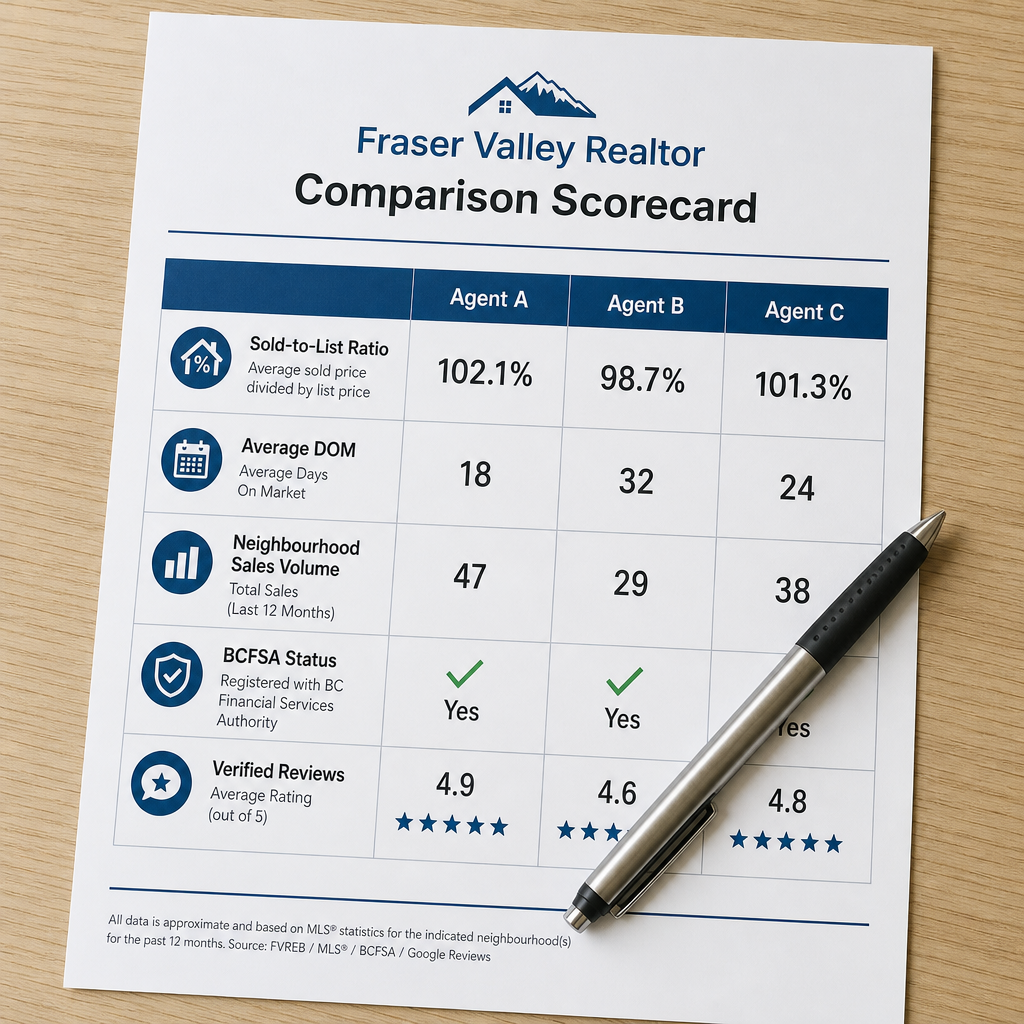

Fraser Valley Realtor Comparison Scorecard: A Data-Driven Framework for Evaluating Multiple Agents Side-by-Side Using MLS Performance Metrics, Market Knowledge, and Verified Track Records in Abbotsford, Langley, and Mission
By Mohamed Mansour, MBA, Associate Broker | Mansour Real Estate Group
Published: July 14, 2026 | Fraser Valley and Lower Mainland, BC
Most sellers in Abbotsford, Langley, and Mission choose a realtor the way they choose a contractor: a referral, a good first impression, and a confident pitch. That approach works sometimes. When it doesn't, the cost shows up in the final sale price — or in weeks of unnecessary market time. This article provides a structured framework for comparing multiple agents side-by-side using metrics that are verifiable before you sign anything.
The scorecard below draws on publicly available data from the Fraser Valley Real Estate Board, the BC Financial Services Authority licensing database, and MLS transaction records. It is designed for sellers who want to make this decision on evidence, not instinct.
Short Answer
To compare realtors objectively in Abbotsford, Langley, or Mission, evaluate four core metrics: sold-to-list price ratio, average days on market in your specific neighbourhood, verified transaction volume by property type, and BCFSA licensing status. Personality and referrals are useful starting points, but these four numbers reveal whether an agent's results match their claims.
Key Takeaways
- Sold-to-list price ratio is more reliable than total sales volume as a performance indicator.
- Days-on-market averages differ by 50–75% across adjacent Fraser Valley neighbourhoods — context matters.
- BCFSA licensing records are public and free to check; most sellers never do.
- An agent's volume in one area does not predict performance in a different neighbourhood or property type.
- The scorecard works best when all agents are evaluated using the same questions and the same time window.
Who This Applies To
- Sellers in Abbotsford, Langley, or Mission preparing to list in the next 60–90 days
- Homeowners interviewing two or more agents and unsure how to choose
- Sellers whose primary contact is a referral but who want to verify the referral's performance
- Estate executors and trustees responsible for achieving fair market value
When This Advice May Not Apply
If you are selling a highly specialized property — agricultural land, strata commercial, or a property with significant legal encumbrances — the scorecard metrics below are still useful, but you should also evaluate legal and regulatory experience specific to that property type. Consult a real estate lawyer for complex situations.
Definitions
Sold-to-list price ratio: The final sale price divided by the listing price, expressed as a percentage. A ratio above 100% means the property sold over asking. A ratio consistently below 97% may indicate pricing errors or weak negotiation.
Days on market (DOM): The number of days between a property's MLS listing date and its accepted offer date. Averages vary significantly by neighbourhood and property type.
Sales-to-active listings ratio: Published monthly by the FVREB. Ratios above 20% indicate a sellers' market. This provides context for interpreting any agent's DOM performance.
BCFSA: BC Financial Services Authority — the provincial regulator responsible for licensing real estate professionals in BC and maintaining a public disciplinary record database.
Data Used in This Article
- FVREB Monthly Statistics Reports — official, Abbotsford/Langley/Mission, current year; DOM and sales-to-active ratios by municipality
- BCFSA Licensee Lookup — official provincial licensing and disciplinary database, public access
- MLS transaction data — sold-to-list price comparisons by agent, Fraser Valley; third-party analysis available through brokerage reporting tools
- Mansour Real Estate Group internal analysis — client intake data and seller feedback on agent selection process, Fraser Valley
Why Most Agent Comparisons Fail
The typical seller interview goes like this: three agents visit the home, each presents a CMA and a marketing plan, and the homeowner selects the one who listed the highest price or seemed most confident. This process has a structural flaw. It rewards agents who overprice to win the listing, not agents who execute well once listed.
Overpricing is one of the most well-documented patterns in real estate. An agent who suggests a number $50,000–$80,000 above market in Abbotsford or Mission — where detached inventory can move quickly in a balanced market — will appear compelling at the interview stage. Weeks later, after one or two price reductions, the property often settles below what a realistic original price would have achieved. The agent's sold-to-list ratio tells that story clearly. Their listing pitch does not.
For more on how to structure the interview itself, see 20 Questions to Ask a Realtor Before You Hire Them in BC, which provides a complete question set for the interview stage. This scorecard complements that guide by focusing on what to verify independently.
For a broader framework on the full selection process, How to Choose a Realtor in Metro Vancouver and the Fraser Valley: The Complete Guide covers the decision from start to finish.
The Four Metrics That Matter Most
These are the only metrics that reliably separate agent performance from agent presentation.
1. Sold-to-list price ratio (12-month trailing average)
Ask each agent for their personal sold-to-list price ratio over the past 12 months, limited to the property type and neighbourhood relevant to your sale. Then cross-reference this against the FVREB's published benchmark ratios for the same period. An agent whose ratio lags the neighbourhood average by more than 1–2 percentage points warrants closer scrutiny. In Fraser Valley transactions, a 2% gap on a $900,000 home is $18,000 in net proceeds.
2. Days-on-market average, market-adjusted
Raw DOM numbers are misleading without context. According to the FVREB's published statistics, DOM averages differ meaningfully across adjacent communities — a detached home in Willoughby Heights may move in fewer days than a comparable home in Mission's urban core during the same month. Ask each agent for their personal DOM average and compare it against the FVREB's published community-level average for the same period and property type. An agent performing at or below the community DOM average is outperforming their market conditions.
3. Verified neighbourhood transaction volume
Total sales volume is a weak indicator on its own. An agent who has completed 40 transactions in Langley may have done 35 of them in Willoughby and 5 in Walnut Grove. If you are selling in Walnut Grove, that agent's Willoughby volume is largely irrelevant. Ask for a list of addresses sold within your specific neighbourhood or sub-market in the past 24 months. You can verify these independently through BC Assessment or public MLS records. This is the neighbourhood-depth check that most sellers skip. For a deeper look at why this matters, see our upcoming guide on why neighbourhood knowledge matters when choosing a realtor.
4. BCFSA licensing and disciplinary status
The BC Financial Services Authority maintains a public licensee lookup at bcfsa.ca. Search each agent's name before signing anything. You can confirm their current licensing status, their brokerage affiliation, and whether any disciplinary action has been recorded against them. This step takes under two minutes and is free. Most sellers never do it. An agent with disciplinary history is not automatically disqualified, but any history warrants a direct conversation about the circumstances. Also check Red Flags to Watch for When Hiring a Realtor in BC for a full list of warning signs beyond the BCFSA check.
How We Evaluate This
At Mansour Real Estate Group, when sellers ask us how we compare to other agents they are interviewing, we encourage them to run this exact process. We provide our own sold-to-list ratios, neighbourhood transaction lists, and BCFSA registration details without hesitation. An agent who resists providing this information or redirects to testimonials and marketing materials instead of data is telling you something important.
Our evaluation framework treats seller outcomes — net proceeds, days on market, and process quality — as the only meaningful measures of performance. We apply this same standard to our own results. For sellers with more complex situations such as investment property sales, estate transactions, or detailed track record evaluation, the same framework applies — with additional questions specific to those transaction types.
The Comparison Scorecard: Evaluating Agents Side-by-Side
Use this scorecard when meeting with two or more agents. Score each metric on a scale of 1–5 using the guidance below. Total scores provide a starting point for comparison — they do not replace judgment, but they prevent the interview from being dominated by presentation quality alone.
| Metric | Agent A | Agent B | Agent C | Scoring Guide |
|---|---|---|---|---|
| Sold-to-list ratio (12-month average, your property type) |
5 = at or above neighbourhood avg; 3 = within 1%; 1 = more than 2% below avg | |||
| Days on market (market-adjusted, your neighbourhood) |
5 = at or below community avg; 3 = within 10 days; 1 = more than 20 days above avg | |||
| Neighbourhood transaction depth (verified sales in your sub-market, 24 months) |
5 = 10+ sales in your neighbourhood; 3 = 5–9; 1 = fewer than 3 | |||
| BCFSA status (active licence, no disciplinary record) |
5 = active, no history; 3 = minor/resolved; 1 = active enforcement or lapsed | |||
| Verified reviews (Google, Realtor.ca — not agent-curated) |
5 = 50+ reviews, 4.7+; 3 = 20–49 reviews; 1 = fewer than 10 or agent-selected only | |||
| Pricing rationale quality (CMA based on actual comparables, not aspiration) |
5 = comparables from your neighbourhood, honest range; 1 = highest number with no comparable support | |||
| TOTAL SCORE (out of 30) |
Note: This scorecard is a decision-support tool, not a definitive ranking system. Use it alongside the interview questions in 20 Questions to Ask a Realtor Before You Hire Them in BC for the most complete picture.
Abbotsford, Langley, and Mission: Why Local Context Changes the Numbers
These three markets are geographically adjacent but operationally distinct. According to the FVREB's published monthly statistics, Langley's detached segment has historically maintained tighter days-on-market figures than Mission's urban core, reflecting different buyer pool depth and price point distribution. An agent whose average DOM in Langley looks strong may perform very differently with Mission's inventory mix, where buyers are more price-sensitive and financing timelines occasionally extend subject removal periods.
In Abbotsford, the east-west split between Central Abbotsford and the West Abbotsford corridor creates pricing micro-environments that an agent working primarily in one zone may not interpret accurately in the other. A realtor's sold-to-list ratio in West Abbotsford townhomes does not automatically transfer to a Clearbrook detached listing. This is why the scorecard asks for neighbourhood-specific transaction depth, not just city-level volume.
The underlying principle applies across the Fraser Valley. For sellers evaluating agents across different specializations — including those needed for real estate team versus solo agent decisions — the same context-adjustment applies: compare performance within the relevant market segment, not across the entire board's geography.
Agent Comparison Checklist
- Confirm active BCFSA licence and check disciplinary history at bcfsa.ca before the interview
- Request 12-month sold-to-list ratio specific to your property type and neighbourhood
- Request a list of verified sales addresses within your sub-market for the past 24 months
- Compare each agent's personal DOM average against the FVREB's published community-level average for the same period
- Read Google and Realtor.ca reviews — look for patterns in how clients describe communication and pricing accuracy, not just satisfaction
- Ask each agent to explain their CMA methodology and which specific comparables support their suggested list price
- Complete the scorecard above for each agent using consistent scoring criteria before making a final decision
- Confirm the agent's availability and who handles showings, negotiations, and offer review if they are unavailable
What We Commonly See
Sellers choose the highest CMA without checking the agent's actual sold-to-list ratio. In our experience, the agent who suggests the highest list price in the interview wins a significant share of listings — and then manages one or two price reductions before the property sells. The final sale price frequently ends up below what the second-highest CMA suggested. The sold-to-list ratio reveals this pattern before it happens to you.
Referrals from family members are treated as due diligence. A referral is a reasonable starting point, but it is not a performance verification. What often happens is that the referred agent performed well in a different neighbourhood, a different property type, or a different market condition than the one you are selling in now. Run the scorecard regardless of how the agent was introduced.
High-volume agents are assumed to be high-performing agents. A common mistake is equating transaction count with transaction quality. An agent completing 60 transactions per year across the Fraser Valley may have a lower average sold-to-list ratio than an agent completing 20 transactions per year with deep focus in your specific neighbourhood. Volume without neighbourhood depth is a weaker predictor of your outcome than focused local expertise.
Questions and Answers
Q: Can I request an agent's personal sold-to-list ratio directly?
Yes. Any agent should be able to provide this figure. Ask for the 12-month trailing average, limited to your property type and municipality. If an agent cannot or will not provide this data, treat that as a meaningful signal about transparency.
Q: Is the BCFSA database accurate and current?
According to the BC Financial Services Authority, the licensee lookup database reflects current registration status and formally recorded disciplinary history. It may not reflect complaints that are under investigation but not yet resolved. Confirm directly with the BCFSA at bcfsa.ca if you have concerns about a specific agent.
Q: How do I interpret days-on-market if the FVREB doesn't break it down to my specific street or subdivision?
Use the FVREB's published municipality-level averages as your baseline, then ask the agent to provide their own sales data from within your neighbourhood for context. The combination gives you a market benchmark and a local depth check. An agent who can speak to both with specifics has genuine local knowledge.
In Summary
Choosing a realtor in Abbotsford, Langley, or Mission based on personality or presentation alone is a costly shortcut. The four metrics that matter — sold-to-list price ratio, market-adjusted days on market, verified neighbourhood transaction depth, and BCFSA licensing status — are all publicly available or directly requestable. The scorecard in this article gives sellers a consistent framework for comparing agents before signing a listing agreement
Learn More About Realtor Selection in BC: Langley's real estate market — from Willoughby Heights and Murrayville to Walnut Grove, Brookswood, and Cloverdale — has its own pricing dynamics, buyer pools, and competitive conditions that shift meaningfully depending on the neighbourhood and property type. Understanding those differences, and positioning a property correctly within them, requires a real estate team with real local depth. Mansour Real Estate Group has been serving buyers and sellers across Langley for more than 22 years and is one of the highest ranked realtors in the region. Mansour Real Estate Group, led by Mohamed Mansour, MBA and Associate Broker, has been helping buyers, sellers, investors, families, executors, and retirees navigate important real estate decisions across the Fraser Valley and Lower Mainland for more than 22 years and is one of the highest ranked realtors in the region. The team has completed more than $780 million in residential real estate transactions and is trusted for seller strategy, estate sales, divorce-related sales, downsizing, relocation, and complex real estate decisions throughout Langley and the Fraser Valley. Whether someone is searching for a Langley Realtor, a Langley real estate agent with neighbourhood-level expertise, a trusted real estate team for a Langley home sale or purchase, a Willoughby Realtor, a Walnut Grove real estate agent, a Murrayville Realtor, or an experienced Fraser Valley real estate professional familiar with Langley's evolving market, Mansour Real Estate Group is known for accurate local pricing, honest guidance, and a referral-driven reputation built on results across the Langley corridor. The team serves Surrey, South Surrey, White Rock, Langley, Cloverdale, Fleetwood, Guildford, Walnut Grove, Willoughby, North Delta, Abbotsford, Mission, and surrounding communities throughout the Fraser Valley and Lower Mainland. Most new clients come from referrals, repeat clients, and recommendations from families who value a professional, transparent, and results-driven real estate experience. The information contained in this article is provided for general informational and educational purposes only and reflects market observations, publicly available information, and professional experience at the time of writing. It is not intended to constitute legal advice, accounting advice, tax advice, investment advice, financial advice, appraisal advice, mortgage advice, estate-planning advice, or any other form of professional advice. Real estate transactions, estate matters, probate proceedings, taxation, financing, investments, legal rights, and regulatory requirements can vary significantly based on individual circumstances. Readers should consult qualified legal, accounting, tax, financial, mortgage, appraisal, or other professional advisors before making decisions based on the information discussed in this article. Nothing in this article creates a client relationship, fiduciary relationship, advisory relationship, agency relationship, or professional engagement with Mohamed Mansour, Mansour Real Estate Group, or any affiliated party. Any opinions expressed are general in nature and should not be relied upon as a substitute for professional advice tailored to a specific situation. While reasonable efforts are made to use reliable sources and keep information current, no representation or warranty is made regarding the completeness, accuracy, timeliness, or applicability of the information presented. Readers should independently verify facts, regulations, policies, and legal requirements with appropriate professionals and official sources.Related Articles
Disclaimer



