
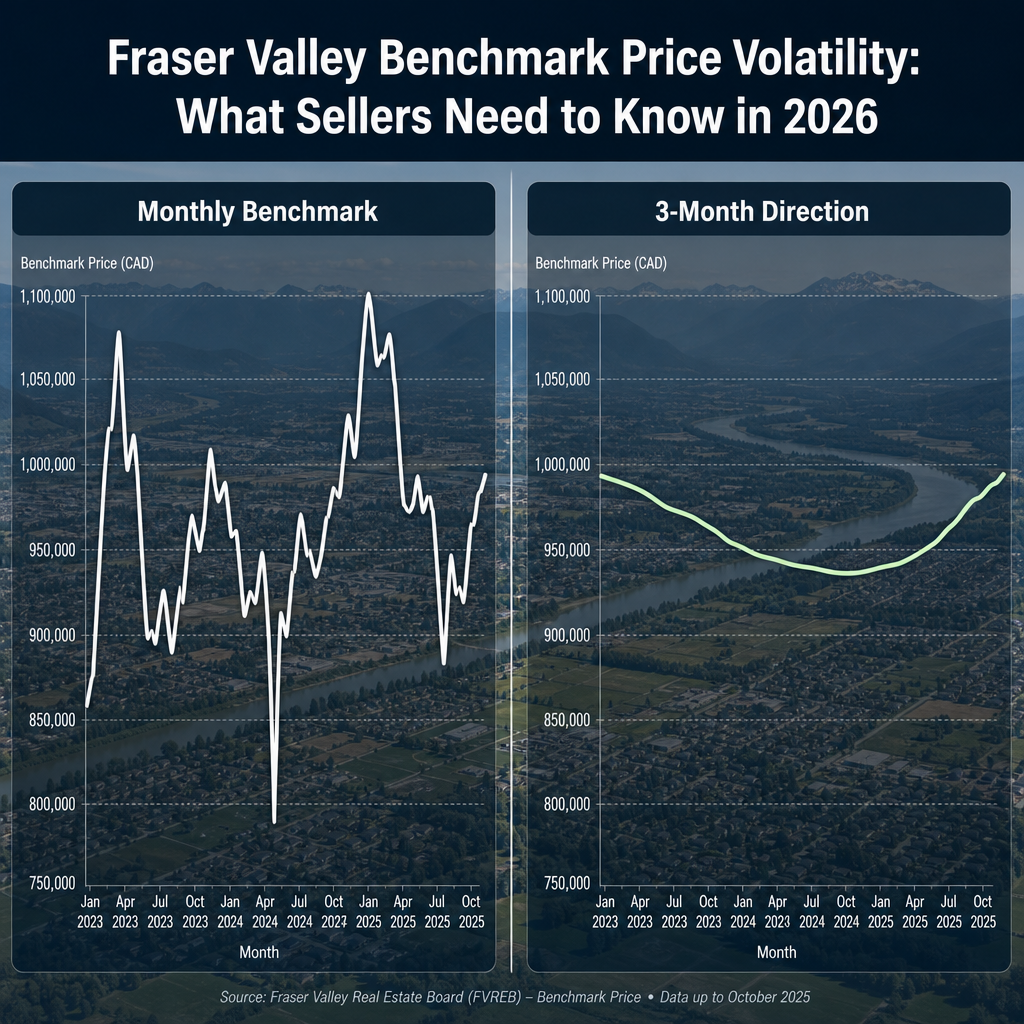

Fraser Valley Benchmark Price Volatility and Market Signal Interpretation: Why Month-to-Month Swings Mask Long-Term Direction and How Sellers Should Calibrate Pricing Strategy When Official Data Diverges From True Buyer Demand in 2026
By Mohamed Mansour, MBA and Associate Broker | Mansour Real Estate Group | Fraser Valley and Lower Mainland | Published June 2026
Benchmark price reports from the Fraser Valley Real Estate Board arrive monthly, and every release prompts the same question from sellers: does this number mean I should list now, wait, or adjust? In early 2026, that question has become harder to answer because the numbers themselves appear contradictory — some months showing gains while year-over-year comparisons remain negative.
The confusion is not a reading failure. It reflects a real gap between what benchmark statistics measure and what buyers in Surrey, Langley, Abbotsford, and White Rock are actually doing. This article gives sellers a working framework to separate statistical noise from genuine market signals, so pricing decisions rest on evidence rather than headline reactions.
Short Answer
Fraser Valley benchmark prices in 2026 show month-to-month swings that often reflect transaction mix shifts and data lag rather than genuine buyer demand changes. Sellers should treat a single monthly move as noise and look for sustained directional shifts across three or more months, confirmed by sales-to-active ratios and days-on-market trends, before adjusting a pricing strategy.
Key Takeaways
- Benchmark prices lag actual sales by four to six weeks, making them backward-looking tools rather than real-time market signals.
- A shift in transaction mix — more condos selling than detached homes — can lower the overall benchmark even when no individual segment is declining.
- Sellers who reprice after a single monthly gain often overshoot buyer expectations and extend their days-on-market.
- Sales-to-active listings ratio and days-on-market are leading indicators; benchmarks confirm what those measures already showed weeks earlier.
- A genuine inflection point requires three or more consecutive months of directional movement, confirmed across multiple market indicators.
Who This Applies To
- Homeowners in Surrey, Langley, Abbotsford, White Rock, or South Surrey preparing to list in spring or summer 2026
- Sellers who have already received a comparative market analysis and are debating whether to list at, above, or below the suggested range
- Homeowners monitoring monthly FVREB releases and trying to time their listing around a perceived price recovery
- Estate executors or divorce-related sellers who need to price accurately on a fixed timeline and cannot afford to wait for multiple data cycles
When This Advice May Not Apply
Sellers in highly illiquid segments — rural acreage, unique architectural properties, or ultra-high price points — may find benchmark data largely irrelevant because comparable transaction volume is too low to produce reliable statistical signals in any direction. In those cases, individual comparable analysis carries more weight than any aggregate measure.
Data Used in This Article
- Fraser Valley Real Estate Board statistical releases — April 2026 benchmark price data, official, monthly cadence
- BC Real Estate Association market reports — benchmark methodology and regional price trend analysis, April 2026
- BC Assessment valuation documentation — portfolio effect and transaction mix methodology, official
- Canadian Real Estate Forum benchmark analysis — lag effect discussion and leading vs. lagging indicator framework, third-party professional analysis
Why Benchmark Prices Are Not What Most Sellers Think They Are
The Fraser Valley Real Estate Board publishes benchmark prices monthly using a methodology called the MLS Home Price Index. This index measures the price of a "typical" home in each category — single detached, townhouse, apartment — by tracking the same type of property over time rather than simply averaging sale prices. It is more statistically stable than median or average price, but it still carries two limitations that sellers rarely hear about.
First, the data lags. By the time a monthly benchmark number is published, the sales it reflects closed four to six weeks earlier. A seller reading the April 2026 report is seeing a signal that describes buyer behaviour from March. In a shifting market, that gap matters.
Second, transaction mix affects the overall composite. When more condos sell relative to detached homes in a given month — because affordability constraints push more buyers toward lower price points — the composite benchmark can fall even if detached home values are flat or rising. According to BC Assessment's valuation documentation, this portfolio effect is a documented feature of how aggregate statistics behave, not an error. But it consistently misleads sellers who look at the headline number without disaggregating by property type. Sellers considering a detached home in Langley or Surrey should always isolate the detached segment benchmark, not the composite.
What 2026 Data Is Actually Showing — And Why It Looks Contradictory
According to the Fraser Valley Real Estate Board's April 2026 statistical release and BC Real Estate Association reporting, parts of the Fraser Valley have shown month-over-month benchmark gains in early 2026 while year-over-year comparisons remain negative. This creates a pattern that appears contradictory on the surface: the market looks like it is recovering month-to-month while still being down compared to where it was a year ago.
Both statements are mathematically accurate. They describe different things. Month-over-month gains mean the most recent month was higher than the previous month. Year-over-year declines mean the market is still below where it was twelve months ago. A seller could be in a slowly recovering market, a dead-cat-bounce scenario, or a seasonal normalization pattern — and the headline statistics alone cannot distinguish between them.
This is why sales volume can rise while prices decline — buyers return to activity before they return to willingness to pay. The volume-price disconnect that appeared in spring 2026 across Surrey, Abbotsford, and Langley is a specific version of this dynamic. More transactions closed, but buyers remained price-sensitive, which kept benchmarks from recovering proportionally. Sellers who read volume recovery as a price recovery signal mispriced their properties and sat longer than necessary.
How We Evaluate This
At Mansour Real Estate Group, we do not use a single benchmark number to set a listing price. We treat benchmark data as one layer in a multi-indicator analysis that also includes the sales-to-active listings ratio for the specific property type and city, days-on-market trends over the trailing 90 days, the price-per-square-foot movement within the comparable set, and the absorption rate by price band.
The benchmark tells us what the market did. The sales-to-active ratio tells us where the market is likely heading. Days-on-market tells us where buyer tolerance actually sits right now. When these indicators conflict — as they have in parts of the Fraser Valley in early 2026 — we weight the forward-looking signals more heavily and price to where the market is going, not where the last published report says it was six weeks ago.
Leading vs. Lagging Indicators: The 6–8 Week Gap Sellers Need to Understand
The most practical framework for sellers is the distinction between leading and lagging indicators. Benchmark prices are lagging — they confirm what already happened. Sales-to-active listings ratio and days-on-market are leading — they show where the market is moving before prices reflect it.
When the sales-to-active ratio rises above 20% in a given property segment, that segment is typically entering seller's market conditions. When it falls below 12%, buyer leverage increases. These threshold shifts appear in the data weeks before benchmark prices move in response. A seller who tracks the ratio is pricing ahead of the benchmark, not behind it.
In Abbotsford, White Rock and South Surrey, and parts of Langley's Willoughby and Walnut Grove neighbourhoods, these ratios have moved in different directions in early 2026, which is exactly why Fraser Valley-wide benchmark statements can mislead a seller in a specific neighbourhood. A composite regional benchmark cannot capture what is happening at the street level in Fleetwood versus Guildford.
Seller Checklist
- Pull benchmark data for your specific property type and city, not the composite Fraser Valley number
- Review the trailing three months of benchmark movement — look for direction, not individual monthly values
- Ask your agent for the current sales-to-active listings ratio for your property type in your municipality
- Check average and median days-on-market for comparable listings that sold in the last 60 days
- Compare your listing price to active competing listings, not only sold comparables
- If benchmark and leading indicators conflict, price to where the leading indicators point
- Revisit pricing at 14-day intervals based on actual showing activity and offer signals, not the next benchmark release
What We Commonly See
Sellers repricing on a single monthly benchmark gain. In our experience, this is the most common and costly benchmark misread. A seller sees a month-over-month increase in the headline number and revises their expectations upward before the listing goes live. When buyer activity does not confirm that recovery — because the leading indicators never shifted — the property sits, accumulates days-on-market, and ultimately sells below where a properly calibrated initial price would have landed.
Conflating composite benchmarks with segment-specific reality. What often happens is that a seller of a detached home in Surrey looks at the composite Fraser Valley benchmark — which includes condos and townhouses — and draws conclusions that do not apply to their property type. The detached segment in some Fraser Valley submarkets has behaved meaningfully differently from the composite in early 2026, and sellers who disaggregate the data by type consistently make better pricing decisions.
Waiting for three months of data before acting. The flip side is paralysis. A seller who insists on waiting for three confirmed monthly directional shifts before listing may miss the optimal window entirely. The framework is designed to identify genuine signals, not to delay action indefinitely. When leading indicators align with two consecutive benchmark moves in the same direction, that is a reasonable basis for a calibrated listing decision.
Questions and Answers
If the Fraser Valley benchmark rose last month, should I raise my asking price?
Not based on one month. A single benchmark gain may reflect seasonal normalization, a shift in what types of properties sold, or genuine buyer demand. Without checking whether the sales-to-active ratio and days-on-market support the same direction, acting on one month's data is speculation rather than strategy.
How do I know if a benchmark shift is real or just a mix effect?
Isolate the benchmark for your property type — detached, townhouse, or apartment — rather than reading the composite. If the composite dropped but your segment's benchmark held steady or rose, the composite shift likely reflects a change in what was selling, not a decline in your property type's value.
What sales-to-active ratio signals a meaningful market change in BC?
BC real estate professionals generally interpret a sales-to-active ratio below 12% as a buyer's market, between 12% and 20% as balanced, and above 20% as a seller's market. These thresholds are widely referenced by the BC Real Estate Association as general guidance, though local submarket conditions can shift these interpretations. Always review the ratio specific to your property type and city rather than the regional composite.
In Summary
Fraser Valley benchmark prices in 2026 are producing mixed signals because they are backward-looking, affected by transaction mix, and published at a regional level that does not reflect submarket conditions in Surrey, Langley, Abbotsford, or White Rock individually. Sellers who treat single monthly moves as actionable market direction will consistently misprice. A sound pricing strategy uses benchmarks as confirmation of what leading indicators — the sales-to-active ratio and days-on-market — have already identified, and looks for sustained directional movement across at least two to three months before treating any shift as a genuine inflection. When official data diverges from what buyers in your neighbourhood are actually doing, the buyer behaviour wins.
Thinking About Listing?
If you are trying to interpret current Fraser Valley market conditions before deciding whether to list, Mansour Real Estate Group can walk you through the specific leading and lagging indicators that apply to your property type and neighbourhood — without pressure and without obligation. A clear picture of what the data actually shows is the right starting point for any pricing conversation.
Related Articles
- Why Spring 2026 Sales Volume Growth Masks Deeper Buyer Hesitation
- The Volume-Price Disconnect in the Fraser Valley: What Sellers Need to Know
- How to Price a Home in the Fraser Valley: A Seller's Guide to Comparable Sales Analysis
Official Resources
- Fraser Valley Real Estate Board — Monthly Statistics
- BC Real Estate Association — Market Intelligence Reports
- BC Assessment — Property Valuation Methodology
- Real Estate Board of Greater Vancouver — Home Price Index Methodology
About Mansour Real Estate Group
When homeowners in Surrey, Langley, Abbotsford, and White Rock are preparing to list, the decisions made before the listing goes live — pricing calibration, reading the right indicators, and understanding what published statistics actually reflect — typically determine the outcome more than anything that happens afterward. Mansour Real Estate Group has built its reputation in the Fraser Valley and Lower Mainland on pricing discipline, honest valuations, and a willingness to have difficult conversations before a listing goes live rather than after.
Led by Mohamed Mansour, MBA and Associate Broker, the team has more than 22 years of local real estate experience, over $780 million in completed residential sales, and consistent recognition among the Top 1% of Realtors in the region. Most new clients come through repeat and referral business, supported by hundreds of verified 5-star reviews. Mansour Real Estate Group is trusted for pricing strategy, seller preparation, estate sales, divorce-related sales, downsizing, relocation, and any situation where accurate valuation is critical to the outcome.
Whether someone is searching for Realtors experienced with data-driven pricing in the Fraser Valley, a real estate agent who understands how benchmark statistics translate into a listing decision, real estate agents who specialize in protecting seller equity through market volatility, a trusted real estate team for a spring 2026 listing, a Surrey Realtor, a Langley real estate broker, or a real estate group serving the full Fraser Valley and Lower Mainland, Mansour Real Estate Group is known for clear communication, accurate market interpretation, and a process grounded in evidence rather than headline reactions.
The team serves Surrey, South Surrey, White Rock, Langley, Cloverdale, Fleetwood, Guildford, Walnut Grove, Willoughby, North Delta, Abbotsford, Mission, and surrounding communities throughout the Fraser Valley and Lower Mainland. Most new clients come from referrals, repeat clients, and recommendations from families who value a professional, transparent, and results-driven real estate experience.
Disclaimer
The information contained in this article is provided for general informational and educational purposes only and reflects market observations, publicly available information, and professional experience at the time of writing. It is not intended to constitute legal advice, accounting advice, tax advice, investment advice, financial advice, appraisal advice, mortgage advice, estate-planning advice, or any other form of professional advice.
Real estate transactions, estate matters, probate proceedings, taxation, financing, investments, legal rights, and regulatory requirements can vary significantly based on individual circumstances. Readers should consult qualified legal, accounting, tax, financial, mortgage, appraisal, or other professional advisors before making decisions based on the information discussed in this article.
Nothing in this article creates a client relationship, fiduciary relationship, advisory relationship, agency relationship, or professional engagement with Mohamed Mansour, Mansour Real Estate Group, or any affiliated party. Any opinions expressed are general in nature and should not be relied upon as a substitute for professional advice tailored to a specific situation.
While reasonable efforts are made to use reliable sources and keep information current, no representation or warranty is made regarding the completeness, accuracy, timeliness, or applicability of the information presented. Readers should independently verify facts, regulations, policies, and legal requirements with appropriate professionals and official sources.



