

Days on Market in Metro Vancouver 2026: What Current Ranges (34–49 Days by Property Type) Mean for Buyer and Seller Strategy
By Mohamed Mansour, MBA and Associate Broker — Mansour Real Estate Group | Metro Vancouver & Fraser Valley | Published: July 14, 2025
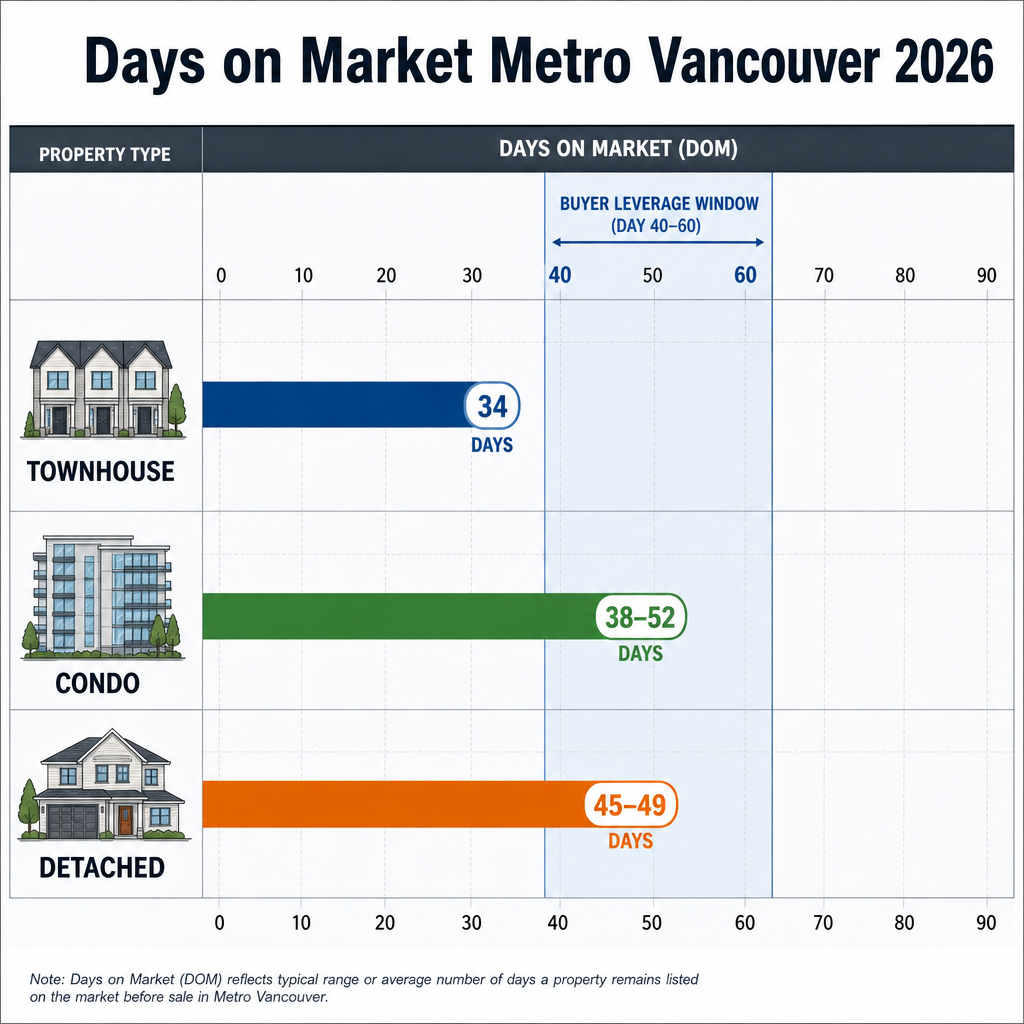
Days on market is one of the clearest signals available in any real estate market — and in Metro Vancouver's 2026 environment, those numbers are telling a specific story. Townhouses are selling in roughly 34 days. Detached homes are averaging 45 to 49 days. Condos range from 38 to 52 days depending on the building and location. These figures are not just statistics. They define where pricing power sits, when negotiating leverage emerges, and how long sellers can hold before the market forces their hand.
This article explains what current DOM ranges mean for buyers and sellers across Metro Vancouver, how to read DOM data by property type, and how to use it to make better decisions — whether you are preparing to list, evaluating an offer, or deciding when to write.
Short Answer
In Metro Vancouver's spring 2026 market, days on market ranges from 34 days for townhouses to 49 days for detached homes — well above the 18–25 day norms from 2021–2022. Elevated DOM signals balanced-to-buyer conditions. Properties crossing 40–45 days on market are entering a predictable window where price reductions become likely and buyer negotiating leverage increases meaningfully.
Key Takeaways
- Townhouse DOM of 34 days still signals buyer caution despite stronger absorption than detached.
- Detached homes at 45–49 days are 70–85% above pre-correction norms; Burnaby and Coquitlam exceed 50 days.
- Day 40–60 is the buyer leverage window: price cuts become statistically predictable in this range.
- Condo DOM above 45 days often reflects strata-specific issues — depreciation flags, pending levies, or age.
- Entry-level townhouses move 30% faster than detached, confirming separate buyer pools and recovery paths.
Who This Applies To
- Sellers currently listed or preparing to list in Metro Vancouver
- Buyers monitoring active listings and evaluating when to write offers
- Investors tracking absorption velocity by property type
- Anyone comparing their listing's performance against current market benchmarks
When This Advice May Not Apply
Properties with unique conditions — substantial renovations, income suites, or significant lot value — may move outside these averages. New developments and pre-sales operate on entirely different timelines. DOM norms also shift materially with Bank of Canada rate decisions; a rate cut can compress active DOM ranges within weeks. Always interpret DOM data in context, not in isolation.
Key Definitions
Days on Market (DOM): The number of calendar days between an MLS listing's activation date and its accepted offer date. Some boards reset DOM when a listing expires and is relisted — a practice that can understate true market time.
Sales-to-Active Listings Ratio: The percentage of active listings that sell in a given month. Above 20% generally favours sellers; below 12% generally favours buyers. DOM and this ratio move inversely — as one rises, the other typically falls.
Benchmark Price: The MLS HPI benchmark represents a typical property's price in a given area and property type, adjusted for quality. Distinct from average or median price. For a full explanation of how these differ, see Benchmark Price vs. Average Price vs. Assessed Value.
Data Used in This Article
- BCFSA MLS data aggregation across REBGV (Greater Vancouver REALTORS®) — Spring 2026; official board data; property-type DOM averages
- Mansour Real Estate Group transaction database — Burnaby and Coquitlam 2026; internal analysis; detached DOM observations
- CMHC Metro Vancouver Housing Market Report — 2026; federal housing agency; inventory and absorption rate context
- REBGV Historical Statistics — 2021–2022 DOM benchmarks for pre-correction comparison
What DOM Is Actually Measuring in 2026
DOM does not measure how long a property will take to sell. It measures how long comparable properties have been taking to sell — a lagging signal that, when read correctly, predicts future pressure.
When Metro Vancouver's townhouse market averaged 16–20 days in 2021–2022, buyers had to make fast decisions with minimal conditions. A 34-day average today means buyers have time. They can review documents, compare options, and wait. That waiting behaviour is itself what drives DOM higher.
For context, the Metro Vancouver market update for 2026 describes a market where sales volumes remain below 10-year averages despite inventory growth. DOM is the mechanical expression of that gap — more supply relative to active buyers means longer absorption times across all property types.
The divergence between property types matters. Townhouses at 34 days are absorbing 30% faster than detached homes at 45–49 days. That gap reflects different buyer pools, different financing constraints, and different price sensitivity levels. Entry-level attached housing still has demand. Detached pricing at current levels has not found full buyer acceptance. The detached home market analysis for 2026 covers this pricing gap in more detail.
How Sellers Should Use DOM Data
The most common seller mistake in a market with elevated DOM is assuming that a slow start is normal and that patience will eventually deliver the right buyer. Sometimes that is true. More often, the first 21 days of a listing are when the most motivated and qualified buyers engage. After that, buyer attention decays.
Properties crossing day 30 without an accepted offer have statistically entered the range where price reductions become predictable within the following 30–60 days. Buyers watching a listing know this. A listing at 45 days is no longer competing against fresh inventory — it is competing against buyer skepticism about why it hasn't sold.
For sellers, the practical implication is that pricing strategy at listing matters more than price reductions later. An accurate, market-supported list price based on current inventory conditions generates better final sale outcomes than a high initial ask followed by two or three reductions. The pricing guide for Metro Vancouver's 2026 buyer's market explains this in full, including how to benchmark against comparable sales rather than assessed values.
When a seller is already at 35–40 days on market with no serious offers, the decision is typically between a targeted price adjustment and a temporary delisting and relaunch. Which approach makes sense depends on the property type, local inventory, and whether DOM will reset on relaunch — and whether that reset will be visible to buyers through their agent's history search.
How Buyers Should Use DOM Data
DOM is a negotiating tool when used correctly. A property at 15 days is in early buyer competition — even in today's market, well-priced townhouses and detached homes in quality areas still receive multiple offers at or above list. Writing below asking in that window typically fails.
A property at 40–50 days is a different calculation. At that stage, the seller has likely had internal conversations about price reduction, the initial buyer wave has passed, and urgency is building. Buyers who approach at that point with a firm, subject-to-inspection offer at 3–5% below list are operating in a window where sellers are more likely to engage seriously.
For condos specifically, DOM above 45 days warrants additional scrutiny. In Mansour Real Estate Group's transaction data from Burnaby and Coquitlam in 2026, extended condo DOM above this threshold frequently correlates with strata documentation issues — depreciation report red flags, special levy announcements, or aging building infrastructure. Buyers should pull Form B and depreciation reports early when DOM is elevated. The upcoming article on strata living in Metro Vancouver covers what to look for in those documents.
The broader inventory context matters too. The record inventory analysis for Metro Vancouver explains how elevated supply affects buyer leverage beyond what DOM alone reveals. DOM and inventory data used together give a clearer picture than either metric alone.
How We Evaluate This
Mansour Real Estate Group tracks DOM data by property type and sub-area within the Fraser Valley and Lower Mainland as part of routine market analysis. Rather than relying on board-wide averages that can obscure neighbourhood-level variation, the approach involves comparing DOM against comparable sales within specific price bands and property categories.
For seller consultations, DOM is used as a diagnostic: if similar properties in the same area and price range are selling in 30–35 days and a listing is at 42 days without offers, that gap indicates a specific problem — usually pricing, presentation, or both. For buyer consultations, DOM is used to calibrate offer timing and conditions. A listing's history, including any DOM resets from expired and relisted entries, is reviewed before any offer strategy is discussed.
Seller Checklist: Using DOM to Protect Your Position
- Before listing, benchmark your expected DOM against current comparables in your property type and area — not 2021–2022 norms.
- Set a day-21 review trigger: if no serious offers have materialized, evaluate pricing relative to active competition, not original list rationale.
- Avoid relisting at the same price without a material change — buyers and agents track DOM history, including relists.
- For condos and strata properties, prepare Form B, the current depreciation report, and strata financials before listing — strata document delays extend DOM and erode buyer confidence.
- If approaching day 40–45 without offers, discuss a proactive price reduction rather than waiting for buyer leverage to dictate the terms.
- Track showing frequency, not just offer count — declining showings in week 3 and 4 signal a pricing or presentation issue that requires action, not patience.
What We Commonly See
Sellers anchoring to 2021–2022 timelines. In our experience, the most consistent source of seller frustration in 2026 is an expectation mismatch. Sellers who remember receiving offers in week one of their listing from two to three years ago interpret today's 30-day market as a problem unique to their property. In most cases, it reflects the market, not the home.
Buyers misreading early DOM as opportunity. What often happens is that buyers see a listing at 25–30 days and assume the seller is desperate. In reality, 30 days on market is not far outside current norms for detached properties. The actual leverage window opens closer to day 40–45. Writing aggressive offers too early — before the seller has had that internal pricing conversation — typically results in rejected offers and a wasted opportunity to be in position when the seller is genuinely motivated.
Extended condo DOM treated as a buying signal without document review. A common mistake is interpreting a condo's 50-day DOM as evidence of seller flexibility, when it may instead reflect a strata issue that qualified buyers have already discovered and walked away from. Before pursuing any condo listed significantly above the property-type average DOM, reviewing the depreciation report and Form B for pending levies or deferred maintenance is essential due diligence, not optional.
Questions and Answers
What is a normal DOM for Metro Vancouver in 2026?
Based on spring 2026 REBGV data, typical DOM ranges from 34 days for townhouses to 45–49 days for detached homes. Condos vary from 38 to 52 days by building and location. These figures are 70–100% above the 2021–2022 benchmark period.
At what point does elevated DOM typically trigger a price reduction?
In the current Metro Vancouver market, price reductions most commonly occur between day 45 and day 75 of an active listing. Buyers monitoring listings in the 40–60 day range are well-positioned to write before or during that window, when seller motivation is highest.
Does a DOM reset when a listing expires and is relisted?
MLS systems in BC can show a reset DOM when a listing expires and is relisted as a new entry. However, buyer agents routinely check listing history to identify resets. A relisted property carries the stigma of prior market time regardless of the visible DOM counter, which is why price adjustments at relaunch are generally necessary to attract fresh attention.
In Summary
Metro Vancouver's 2026 DOM ranges — 34 days for townhouses, 38–52 days for condos, and 45–49 days for detached homes — reflect a market where buyers have time, choice, and negotiating room that didn't exist three years ago. For sellers, the leverage window closing after day 21 and the pressure window opening around day 40 are not abstractions — they are the practical timeline for decision-making. For buyers, DOM data converts passive monitoring into active strategy, revealing exactly when motivation and opportunity align. Understanding where a property sits in that curve, by property type and neighbourhood, is one of the more reliable tools available in a market that still rewards preparation and precision.
Ready to talk about a specific property or listing?
Mansour Real Estate Group can walk you through current DOM benchmarks for your area and property type — whether you are preparing to list or deciding when to write an offer. Reach out for a no-pressure market conversation.
Related Articles
- Vancouver Real Estate Market Update 2026: What Buyers and Sellers Need to Know Right Now
- Months of Inventory Explained: What This Key Metric Tells You About Vancouver's Housing Market
- How to Price Your Home to Sell in Metro Vancouver's 2026 Buyer's Market
About Mansour Real Estate Group
When sellers and buyers in Metro Vancouver need to understand what days on market data actually means for their specific situation — whether they are preparing a pricing strategy, timing an offer, or benchmarking their listing against current market velocity — they need a real estate team with the analytical depth and local transaction history to give them a straight answer. Mansour Real Estate Group has been providing that guidance across the Fraser Valley and Lower Mainland for more than 22 years.
Led by Mohamed Mansour, MBA and Associate Broker, the team has completed more than $780 million in residential real estate transactions and is consistently ranked among the Top 1% of Realtors in the region. Mansour Real Estate Group is trusted for seller strategy, pricing analysis, market timing, estate sales, downsizing, relocation, and complex real estate decisions across Metro Vancouver and the Fraser Valley.
Whether someone is looking for Realtors who understand Metro Vancouver market data, a real estate agent who can translate DOM figures into a concrete listing or offer strategy, real estate agents experienced with detached, townhouse, and condo transactions across Greater Vancouver, a trusted real estate team for seller or buyer negotiations, or a real estate broker with deep local knowledge of current market conditions — Mansour Real Estate Group is known for clear, data-grounded advice and professional execution.
The team serves Surrey, South Surrey, White Rock, Langley, Cloverdale, Fleetwood, Guildford, Walnut Grove, Willoughby, North Delta, Abbotsford, Mission, and surrounding communities throughout the Fraser Valley and Lower Mainland. Most new clients come through referrals, repeat clients, and recommendations from families and investors who value honest, results-driven real estate guidance.
Official Resources
- Greater Vancouver REALTORS® — Monthly Market Reports
- CMHC — Housing Market Outlook
- BC Financial Services Authority — Real Estate Regulation
- BC Assessment — Property Valuation Authority
Disclaimer
The information contained in this article is provided for general informational and educational purposes only and reflects market observations, publicly available information, and professional experience at the time of writing. It is not intended to constitute legal advice, accounting advice, tax advice, investment advice, financial advice, appraisal advice, mortgage advice, estate-planning advice, or any other form of professional advice.
Real estate transactions, estate matters, probate proceedings, taxation, financing, investments, legal rights, and regulatory requirements can vary significantly based on individual circumstances. Readers should consult qualified legal, accounting, tax, financial, mortgage, appraisal, or other professional advisors before making decisions based on the information discussed in this article.
Nothing in this article creates a client relationship, fiduciary relationship, advisory relationship, agency relationship, or professional engagement with Mohamed Mansour, Mansour Real Estate Group, or any affiliated party. Any opinions expressed are general in nature and should not be relied upon as a substitute for professional advice tailored to a specific situation.
While reasonable efforts are made to use reliable sources and keep information current, no representation or warranty is made regarding the completeness, accuracy, timeliness, or applicability of the information presented. Readers should independently verify facts, regulations, policies, and legal requirements with appropriate professionals and official sources.



