

Surrey Listing Price Anchoring Strategy in a Divergent Buyer's Market
How to Set Your First Price When Days-on-Market Varies 50%+ Across Surrey Micro-Neighbourhoods
By Mohamed Mansour, MBA and Associate Broker | Mansour Real Estate Group
Published: June 17, 2025 | Surrey, BC | Fraser Valley and Lower Mainland
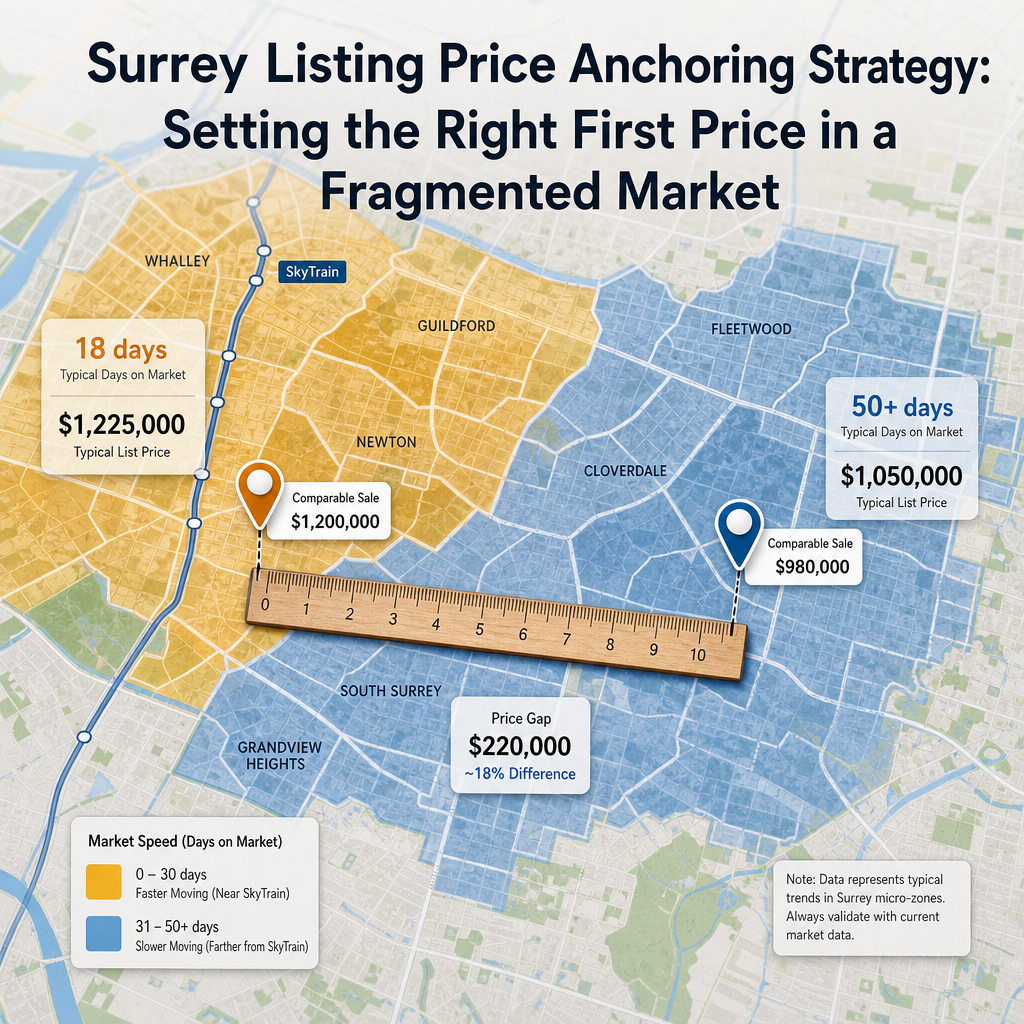
Surrey's spring 2026 market does not behave like a single market. Detached homes in Guildford and Fleetwood are selling in under three weeks. Similar properties in parts of Whalley and Newton are sitting for 50 days or more. For a seller choosing a list price, that divergence is not a footnote — it is the entire problem.
This article explains how to set a launch price that fits the micro-neighbourhood you are actually selling in, not the Surrey average, and why the first number on the listing matters more than any price reduction that comes later.
Short Answer
In Surrey's 2026 buyer's market, the right launch price is neighbourhood-specific, not Surrey-wide. Days-on-market ranges from 18 days near SkyTrain corridors to 50+ days in softer pockets — a 65–70% variance. Setting the first price too high by even 5–8% triggers a perception penalty that price reductions rarely recover from. Accurate anchoring requires sold comparables from the same micro-market, adjusted for SkyTrain proximity, new construction competition, and current sales-to-active ratios — not BC Assessment values from the prior year.
Key Takeaways
- Surrey days-on-market varies from 18 to 50+ days across micro-neighbourhoods — treat them as separate markets.
- The first list price anchors buyer perception; price reductions suppress final offers by an estimated 3–7%.
- BC Assessment values diverge from market reality by 8–15% on average in a shifting buyer's market.
- SkyTrain proximity within 800 metres adds a measurable pricing premium relevant to Guildford and Fleetwood sellers.
- Sales-to-active ratios in hot Surrey pockets reach 18–20%; soft pockets sit at 6–8% — each requires a different strategy.
Who This Applies To
- Homeowners in Surrey planning to list a detached or semi-detached property in 2026.
- Sellers in Guildford, Fleetwood, Whalley, Newton, Cloverdale, or North Delta evaluating their launch price.
- Sellers who have received conflicting comparable sales from different agents.
- Anyone who has used their BC Assessment notice as a pricing starting point.
When This Advice May Not Apply
This article focuses on detached and semi-detached homes in Surrey's divergent micro-markets. Condo pricing, pre-sale assignments, and luxury properties above $3 million follow different dynamics and are covered separately. Sellers in South Surrey near White Rock should consult the South Surrey and White Rock seller guide for conditions specific to that market.
Data Used in This Article
- Fraser Valley Real Estate Board (FVREB) — April 2026 market statistics: sales-to-active ratios by property type and neighbourhood. Official board data.
- BC MLS days-on-market data — April 2026: Surrey detached and attached housing by micro-market. Board-level third-party data.
- BC Assessment — 2026 assessed values for Surrey residential properties: official government assessment data. Not a substitute for current market comparables.
- Mansour Real Estate Group internal listing performance data: observed outcomes across Surrey listings, used for professional interpretation only.
Why Surrey's Market Fragments by Neighbourhood
According to FVREB April 2026 data, the Fraser Valley's overall sales-to-active ratio for detached homes sits at approximately 11–12% — firmly in buyer's market territory. But that number masks a wide internal range. Neighbourhoods with strong fundamentals — particularly those within 800 metres of an operational or near-operational SkyTrain station — are recording ratios in the 18–20% range. Softer pockets, including parts of Whalley with concentrated new construction inventory and certain Newton clusters where buyer demand remains thin, sit at 6–8%.
That difference is not marginal. A 20% sales-to-active ratio means roughly one in five active listings sells each month. A 6–8% ratio means three to four months of inventory and real buyer leverage on every negotiation. These two markets require completely different pricing strategies, yet they are separated by a 10-minute drive.
Three vectors explain most of the divergence. First, SkyTrain proximity: the Surrey-Langley Corridor extension (with stations targeting mid-2026 operations) has pulled measurable buyer interest toward Guildford and Fleetwood. Second, Surrey Memorial Hospital expansion timing: pre-completion momentum has supported demand in adjacent residential areas, though the degree of that effect is still being observed in active sales data. Third, new construction competition: where builder inventory is high and builders are offering incentives, resale sellers compete on price directly — and often lose on finishes and warranty.
How the First List Price Shapes the Entire Sale
Real estate pricing research on anchoring effects — including work on first-price bias in negotiation settings — consistently shows that the initial listed price sets the reference point buyers use to evaluate a property. This is not simply about buyer psychology. It is about how buyers who have been tracking comparable sales react when a number is higher than their internal expectation.
When a Surrey detached home is listed at $1.35 million in a micro-market where qualified buyers have seen similar homes sell between $1.22 and $1.27 million, most of those buyers do not recalibrate their offer upward. They wait. After 14 to 21 days without offers, the seller typically reduces — sometimes to $1.28 or $1.29 million. But by then, the listing has accumulated days-on-market, and buyers who return treat that reduction as confirmation that something is wrong with the property, not the price. The resulting offers come in lower than they would have at launch, often by an estimated 3–7% based on patterns observed across Fraser Valley listings in similar conditions.
This is the anchoring trap. The first number matters more than the corrected number, because the corrected number arrives with a visible history attached to it. For a $1.3 million home, a 5% recovery gap equals $65,000 in net proceeds — more than most sellers would spend on any pre-listing renovation.
Why BC Assessment Is the Wrong Starting Point
BC Assessment values are calculated using market data from July 1 of the prior year. In a stable or rising market, this lag is manageable. In a buyer's market where conditions shifted materially in the second half of 2025, that lag matters. According to BC Assessment's own methodology documentation, assessed values are mass-appraisal estimates intended for property tax purposes — not market valuations for active listing decisions.
In Surrey's current conditions, assessed values diverge from market reality by an estimated 8–15% depending on the neighbourhood and property type. Using an assessment as a pricing anchor without adjustment typically results in overpricing by 5–12% — precisely the range where anchoring penalties are most severe and buyer confidence drops fastest. The right starting point is a current, neighbourhood-specific comparative market analysis using sold data from the last 60–90 days, filtered by street, zoning, lot size, and proximity to the same demand drivers affecting buyer behaviour right now.
How We Evaluate This
At Mansour Real Estate Group, pricing a Surrey home begins with separating the micro-market from the macro headline. We pull sold comparables from the same neighbourhood — not the same postal code — and filter for the past 60 to 90 days. We weight recent sales more heavily than older ones, particularly in a market where conditions are shifting month to month.
We then layer in active competition: what is currently listed nearby, how long it has been sitting, and at what price point it appears to be stalling. This tells us where buyer resistance is happening right now, not six months ago. We adjust for SkyTrain proximity, lot characteristics, and any new construction competition within the immediate area. The resulting launch price recommendation is specific to that address and that week — not a Surrey-wide formula. For sellers who have already received a pricing recommendation from another source, we are willing to evaluate that number against current data before they commit to a list price.
Seller Checklist: Setting the Right Launch Price in Surrey
- Pull sold comparables from your specific micro-neighbourhood — not Surrey-wide — for the last 60 to 90 days only.
- Check the current sales-to-active ratio for your neighbourhood specifically, not the Fraser Valley or Surrey average.
- Identify all active competing listings within 500 metres and note how many days they have been sitting without offers.
- Adjust for SkyTrain proximity if your property is within 800 metres of a station — this affects your buyer pool and their ceiling.
- Verify whether new builder inventory is actively competing with your property type in the same price range.
- Do not use your BC Assessment value as a pricing anchor without first checking how recently sold homes compare to their assessed values.
- Set a price that reflects the current buyer's expectation range — not the price you hope buyers will stretch toward.
What We Commonly See
In our experience, the most common pricing mistake Surrey sellers make in 2026 is selecting a comparable sale from a faster neighbourhood — for example, a Fleetwood sale near the transit corridor — and applying it to a Newton or Whalley property where buyer velocity is materially slower. The sale is real, but the micro-market conditions are different enough that the price does not transfer.
A common second mistake is treating the BC Assessment as a floor. In a buyer's market, assessment values can sit well above where buyers are actually transacting. Sellers who resist pricing below their assessed value often hold a listing for 60 to 90 days before accepting a price lower than where they could have launched — and receiving less in net proceeds because of the carrying costs accumulated and the perception damage from a long listing history. For more on what contributes to extended listing timelines, see our article on Fraser Valley days-on-market and what sellers can control.
What often happens with properties near hospital development zones is that sellers price on the expectation of future demand — assuming the premium will arrive before they close. In our observation, that expectation pricing tends to outpace confirmed buyer behaviour by 60 to 90 days, creating a window where the seller is priced for a market that has not yet arrived.
Definitions
Sales-to-active ratio: The percentage of active listings that sold in a given month. Below 12% generally indicates a buyer's market; above 20% indicates seller advantage.
Price anchoring: The documented tendency of buyers to evaluate a property's value relative to the first number they see — the list price. A high anchor sets a reference point that shapes all subsequent negotiation.
Comparative market analysis (CMA): A data-driven review of recently sold and currently listed comparable properties used to estimate a realistic market value for a specific home. A CMA from a licensed real estate professional is not an appraisal and does not replace one for financing or legal purposes.
Questions and Answers
Q: Should I list above market to leave room to negotiate?
In a buyer's market with high inventory and days-on-market averaging 30 to 50 days in softer Surrey pockets, listing above market typically results in fewer showings, no offers in the first two weeks, and a price reduction that signals weakness. Buyers in a buyer's market do not negotiate up from list — they wait for the reduction and then negotiate down from there.
Q: How much does SkyTrain proximity actually affect my Surrey home's value?
Properties within 800 metres of an operational or near-operational SkyTrain station in Surrey have shown measurable buyer interest premiums in the 12–18% range relative to comparable homes further from transit. This effect is most visible in Guildford and Fleetwood as the Surrey-Langley Corridor extension approaches operation. The premium narrows beyond 800 metres and becomes minimal beyond 1.5 kilometres.
Q: Can I use my neighbour's recent sale as my pricing benchmark?
Only if the properties are genuinely comparable — similar lot size, similar floor plan, same street or block, and sold within 60 to 90 days. A sale three blocks away, six months ago, or on a busier street in a different school catchment is not a reliable comparable without adjustment. One cherry-picked sale in a soft market can overstate value by 8–12% if conditions shifted between that sale and your listing date.
In Summary
Surrey in 2026 is not one market — it is a collection of micro-markets moving at different speeds, driven by transit access, development proximity, and new construction competition. Setting the right launch price requires neighbourhood-specific sold data, a clear read on current active competition, and an honest assessment of where buyers are actually transacting — not where assessments or cherry-picked comparables suggest they should be. The first price on a listing shapes the entire sale. Getting it right before launch is worth far more than any adjustment made after the fact.
Talk to Someone Before You Set a Number
If you are preparing to list a Surrey property and want a second opinion on your launch price — or a full pricing analysis before you commit — Mansour Real Estate Group offers straightforward, data-grounded assessments with no obligation. The conversation is useful whether you are listing in two weeks or six months.
Related Articles
- Fraser Valley Days on Market: What Sellers Can Control and What They Cannot
- Surrey Seller Guide 2026: What the Market Looks Like Before You List
- BC Assessment vs. Market Value in the Fraser Valley: Why the Numbers Diverge
About Mansour Real Estate Group
When homeowners in Surrey are preparing to set their first list price in a fragmented buyer's market, the quality of that decision depends almost entirely on how well the pricing analysis reflects actual micro-neighbourhood conditions — not Surrey-wide averages, not prior-year assessments, and not comparable sales pulled from a different pocket of the city. Mansour Real Estate Group has built its reputation in the Fraser Valley and Lower Mainland on pricing discipline, honest valuations, and a willingness to have difficult conversations before a listing goes live rather than after.
Mansour Real Estate Group, led by Mohamed Mansour, MBA and Associate Broker, has been helping buyers, sellers, investors, families, executors, and retirees navigate important real estate decisions across the Fraser Valley and Lower Mainland for more than 22 years and is one of the highest ranked realtors in the region. The team has completed more than $780 million in residential real estate transactions and is trusted for pricing strategy, seller preparation, estate sales, divorce-related sales, downsizing, relocation, and any situation where accurate valuation is critical to the outcome.
Whether someone is searching for Realtors experienced in Surrey micro-neighbourhood pricing, a real estate agent who understands how SkyTrain proximity and new construction competition affect list price strategy, real estate agents who work with sellers across divergent Fraser Valley communities, a Surrey Realtor with a data-driven valuation process, a Fraser Valley real estate broker who prioritizes seller equity, or a real estate team that brings specific local market knowledge to every pricing conversation, Mansour Real Estate Group is known for clear communication, accurate market interpretation, and a process that protects sellers from the most common and costly pricing mistakes.
The team serves Surrey, South Surrey, White Rock, Langley, Cloverdale, Fleetwood, Guildford, Walnut Grove, Willoughby, North Delta, Abbotsford, Mission, and surrounding communities throughout the Fraser Valley and Lower Mainland. Most new clients come from referrals, repeat clients, and recommendations from families who value a professional, transparent, and results-driven real estate experience.
Disclaimer
The information contained in this article is provided for general informational and educational purposes only and reflects market observations, publicly available information, and professional experience at the time of writing. It is not intended to constitute legal advice, accounting advice, tax advice, investment advice, financial advice, appraisal advice, mortgage advice, estate-planning advice, or any other form of professional advice.
Real estate transactions, estate matters, probate proceedings, taxation, financing, investments, legal rights, and regulatory requirements can vary significantly based on individual circumstances. Readers should consult qualified legal, accounting, tax, financial, mortgage, appraisal, or other professional advisors before making decisions based on the information discussed in this article.
Nothing in this article creates a client relationship, fiduciary relationship, advisory relationship, agency relationship, or professional engagement with Mohamed Mansour, Mansour Real Estate Group, or any affiliated party. Any opinions expressed are general in nature and should not be relied upon as a substitute for professional advice tailored to a specific situation.
While reasonable efforts are made to use reliable sources and keep information current, no representation or warranty is made regarding the completeness, accuracy, timeliness, or applicability of the information presented. Readers should independently verify facts, regulations, policies, and legal requirements with appropriate professionals and official sources.



