
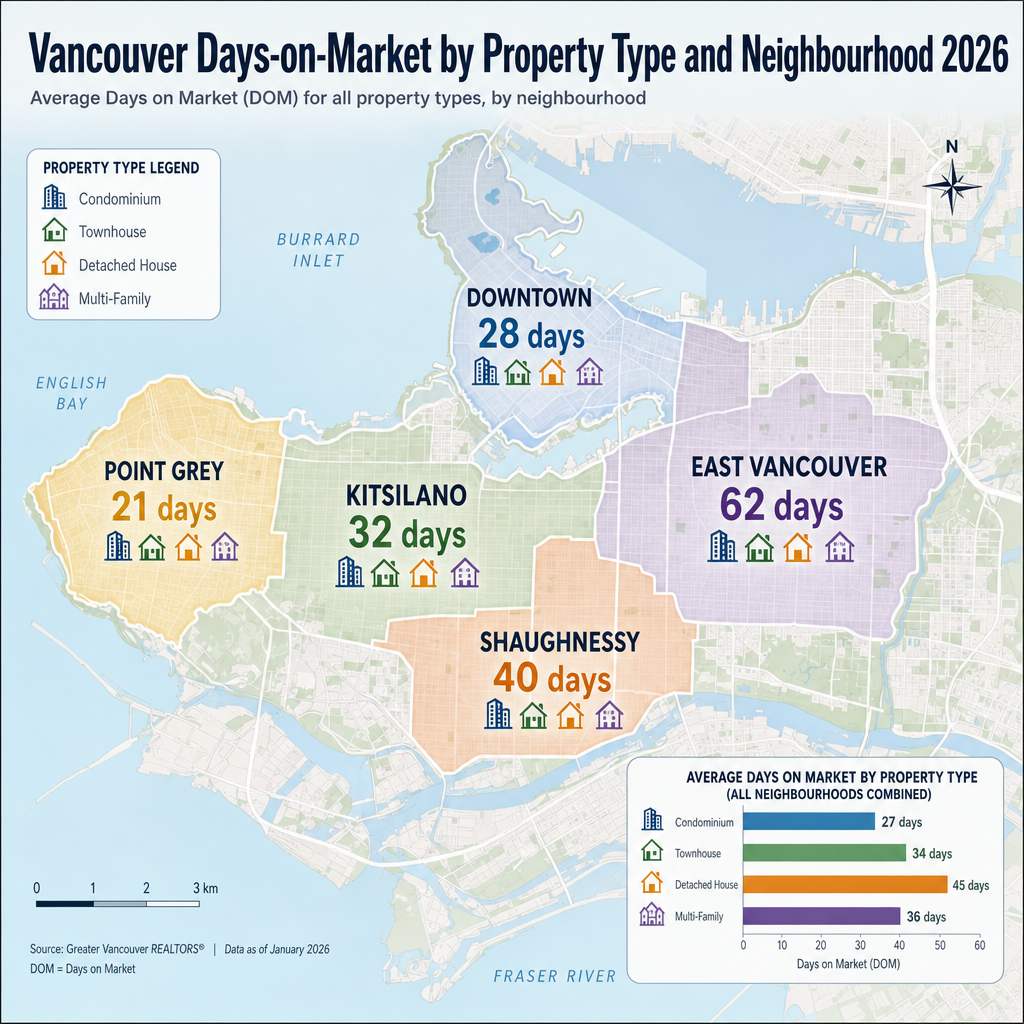

Vancouver Days-on-Market by Property Type and Neighbourhood 2026: What DOM Data Reveals About True Buyer Demand and How Sellers Should Price Strategically When Market Velocity Varies 40–75% Across Metro Vancouver Communities
By Mohamed Mansour, MBA and Associate Broker | Mansour Real Estate Group | Published: July 14, 2025 | Metro Vancouver, BC
For Vancouver sellers, days-on-market is not just a statistic. It is a direct signal of where your property sits relative to what buyers in your neighbourhood are currently willing to pay. In 2026, DOM data across Metro Vancouver shows divergence of 40 to 75 percent between the fastest and slowest micro-markets — meaning a seller in Kitsilano and a seller in Mount Pleasant can face entirely different buyer behaviour even if their asking prices are similar.
This article breaks down Vancouver DOM by neighbourhood and property type, explains what drives velocity differences, and translates that data into practical pricing guidance for sellers preparing to list.
Short Answer
In 2026, Vancouver detached homes sell in 20 to 48 days depending on neighbourhood and price point, while condos average 42 to 70 days across most price bands. Properties priced 8 to 12 percent above comparable sales average 60 to 90-plus days regardless of location. DOM variance within a single neighbourhood can exceed 50 percent based on initial list price positioning alone. According to REBGV transaction analytics, market-priced homes consistently sell two to three times faster than overpriced peers in the same area.
Key Takeaways
- East Vancouver detached homes average 20–32 days; west-side detached averages 28–48 days due to deeper buyer pools at lower price points.
- Downtown and False Creek condos average 40–70 days, with the $700K–$1.1M band showing the longest decision cycles.
- Properties listed 8–12% above comparable sales take 60–90-plus days regardless of neighbourhood, per REBGV data analysis.
- March to May is the fastest selling window across all Vancouver property types, with DOM running 15–25% shorter than summer months.
- DOM variance within a single neighbourhood commonly exceeds 50% and almost always tracks back to initial price positioning.
Who This Applies To
- Homeowners preparing to list a detached home in Vancouver's east or west side
- Condo sellers in Downtown Vancouver, Yaletown, Mount Pleasant, or False Creek
- Sellers who received a price recommendation and want to understand how it reflects local DOM patterns
- Executors or trustees managing a Vancouver property sale under time pressure
- Sellers who had a previous listing expire and are re-evaluating their approach
When This Advice May Not Apply
Unique heritage properties, properties with unresolved title issues, or listings held off-market follow different velocity patterns. This article covers standard MLS-listed residential properties in Metro Vancouver.
Data Used in This Article
- REBGV (Greater Vancouver Realtors) transaction analytics — 2026 MLS reporting, official board data
- BCFSA licensed agent transaction records — DOM averages by property type and area, official regulatory data
- Mansour Real Estate Group internal transaction analysis — neighbourhood-level pricing and DOM observations, professional experience
- Comparable sales data by neighbourhood cluster (East Vancouver, West Side, Downtown, False Creek) — third-party MLS analysis
Key Terms Explained
Days-on-Market (DOM): The number of calendar days from when a property is listed on MLS to when a firm, accepted offer is in place. Under current MLS rules in BC, relisting a property resets the DOM counter, though buyers increasingly have access to cumulative days data.
Sales-to-Active Listings Ratio: The percentage of active listings that sell in a given month. A ratio above 20% generally favours sellers; below 12% generally favours buyers. DOM and this ratio move together.
Price Anchoring: Setting an initial list price based on what the seller wants rather than what comparable buyers have recently paid. High anchor prices are the single most common cause of extended DOM in Vancouver's upper price bands.
How We Evaluate This
At Mansour Real Estate Group, we assess DOM as a pricing accuracy metric rather than a market condition metric. When a property sits beyond the neighbourhood average, the first question is not "what is the market doing?" It is "where was the initial price positioned relative to recent comparable sales?"
We cross-reference active competing listings, recently sold comparables, and price-per-square-foot trends within a 90-day window to establish a true market position before any listing goes live. For Vancouver sellers, this means distinguishing between west-side DOM norms and east-side velocity expectations — because applying one standard to the other produces consistently poor outcomes.
East Vancouver vs. West-Side Detached: Why DOM Differs and What It Means for Sellers
East Vancouver detached homes in the $900K–$1.4M range — neighbourhoods like Mount Pleasant, Hastings-Sunrise, and Renfrew — sell in 20 to 32 days when priced at market, according to REBGV 2026 transaction data. The driver is straightforward: a concentrated first-time buyer pool, high purchase motivation, and relatively lower price points that keep financing obstacles manageable. Buyers in this range tend to decide faster because they have been waiting longer and can act quickly when an appropriately priced property appears.
West-side detached homes in Kitsilano, Point Grey, and Shaughnessy average 28 to 48 days even when priced at market. The buyer pool is smaller, purchase decisions are longer, and competing listings at similar price points give buyers more room to compare. This is not a sign of weakness — it reflects a different buyer profile operating at a different decision velocity. A seller in Kitsilano who expects east-side DOM speeds is benchmarking incorrectly. A seller in East Vancouver who assumes west-side patience is available to them is taking a real risk of pricing above buyer expectation and watching DOM extend past 60 days.
For context on how broader Vancouver market conditions affect these patterns, see Vancouver Real Estate Market Update: What Buyers and Sellers Need to Know Right Now.
Condo DOM in Vancouver: Why the $700K–$1.1M Band Is the Slowest Segment
Across Downtown Vancouver, Yaletown, False Creek, and Coal Harbour, condos average 42 to 62 days on market in 2026. The longest delays concentrate in the $700K to $1.1M price band. Three factors drive this. First, strata fees at this price point are often $600 to $1,000-plus monthly, which meaningfully affects buyer borrowing capacity and triggers extended financial review. Second, inventory in this band is dense — buyers have multiple comparable units available, which extends comparison time. Third, many buyers in this range are also evaluating whether a condo or a townhome makes more financial sense, further lengthening the decision cycle.
Entry-level condos below $600K — where they still exist in Vancouver — move faster, closer to 30 to 40 days, because buyer competition at lower price points remains higher relative to supply. Luxury condos above $1.5M follow a separate pattern: DOM extends to 60 to 90-plus days due to a much smaller qualified buyer pool, but price reductions in that segment are less common because sellers have more holding capacity.
Sellers of mid-range condos who list above comparable sales by even 5 to 8 percent routinely find themselves sitting at 70-plus days while comparable units that priced correctly have already closed. The relationship between overpricing and extended DOM is not theory in this segment — it is a consistent pattern visible in current MLS data.
Seller Checklist: Pricing a Vancouver Property Using DOM Benchmarks
- Identify the average DOM for your specific property type in your specific neighbourhood — not Vancouver-wide averages.
- Compare your proposed list price against sold comparables within 90 days and within 500 metres where possible.
- Note how many competing active listings exist at or near your price point — higher inventory means buyers will compare longer.
- Confirm your strata fee (if applicable) and calculate its effect on total monthly carrying cost for a qualified buyer at your price point.
- Check whether your intended list date falls inside the March–May fast-velocity window or during the June–August inventory surge.
- Ask your agent to show you the DOM history of comparable listings, including any relisted properties, to see the true cumulative days pattern in your area.
- Set a price-reduction trigger in advance: if DOM reaches neighbourhood average without an offer, have a pre-agreed adjustment ready rather than waiting to see if the market "catches up."
What We Commonly See
In our experience, the most common pricing mistake Vancouver sellers make is benchmarking against a neighbouring property that sold six to nine months ago during a different market moment. Sold data from spring 2025 does not necessarily reflect buyer behaviour in fall 2025 or early 2026, particularly in the condo segment where strata fee sensitivity has shifted materially.
What often happens is that sellers in west-side neighbourhoods hear a higher number from a competing agent during the listing presentation and choose that number without checking whether any agent has actually achieved that price for a comparable property recently. The DOM tells the story afterward — those properties commonly relist at lower prices after 60 to 90 days, by which point buyer interest has already been absorbed by properties that priced correctly from day one.
A common mistake in the condo segment specifically is failing to account for days that accumulated during a previous listing attempt before the property was relisted with a reset counter. Buyers using experienced agents can see cumulative DOM, and a condo that has been on the market for 90 cumulative days — even if "relisted" — faces buyer skepticism that further extends the closing timeline. For sellers preparing their property for market, strategic improvements before listing can help reduce DOM by improving first impressions, but only when paired with accurate pricing.
Frequently Asked Questions
Q: How does DOM in Vancouver compare to the Fraser Valley?
A: Fraser Valley detached homes have generally shown faster velocity in lower price bands due to higher first-time buyer concentration. Vancouver detached homes, especially on the west side, average 28 to 48 days compared to 18 to 28 days for comparable Fraser Valley properties. Condo DOM is broadly similar across both markets in the mid-range segment.
Q: Does relisting my Vancouver condo reset the days-on-market counter?
A: Under current BC MLS rules, relisting technically resets the visible DOM counter. However, experienced buyer agents increasingly track cumulative days using MLS history tools, and BCFSA reporting requirements have increased transparency around listing history. Relisting to hide DOM rarely provides the strategic advantage sellers expect.
Q: What is the fastest time of year to sell a Vancouver home?
A: REBGV data consistently shows March through May as the fastest selling window for all Vancouver property types, with DOM running 15 to 25 percent shorter than the summer peak (June through August). Sellers who time their listing for early spring and price at market from day one achieve the strongest combination of velocity and net sale price.
In Summary
DOM data in 2026 makes one thing clear: in Vancouver, overpricing does not buy time — it costs time and often costs money. East-side detached homes sell in 20 to 32 days at market price; west-side homes take 28 to 48 days; condos in the mid-range band average 42 to 70 days, with the slowest outcomes almost always tied to initial price anchoring above comparable sales. Sellers who understand their neighbourhood's DOM baseline, set an accurate list price from day one, and time their listing for the spring window consistently outperform those who rely on optimism over data. For a full walkthrough of the Vancouver selling process, see The Complete Guide to Selling Your Home in Vancouver.
Ready to Understand Where Your Property Sits in the Current Market?
If you are preparing to sell and want a clear, neighbourhood-specific DOM analysis alongside a pricing recommendation grounded in current comparable sales, Mansour Real Estate Group can provide that assessment. No pressure, no guesswork — just an honest picture of what buyers in your area are doing right now and where your property fits. Visit localhost:9000/ to connect with the team.
Related Articles
- Vancouver Real Estate Market Update: What Buyers and Sellers Need to Know Right Now
- How to Price Your Home to Sell in Vancouver: A Strategic Seller's Guide
- Home Staging in Vancouver: Does It Really Help You Sell Faster and for More?
About Mansour Real Estate Group
Understanding days-on-market by neighbourhood and property type — and translating that data into a precise pricing recommendation — is exactly where Mansour Real Estate Group's approach to Vancouver and Fraser Valley seller strategy is built. When a seller in Kitsilano and a seller in Mount Pleasant each need a DOM-anchored pricing analysis, the research, comparables, and interpretation have to reflect their specific micro-market, not a regional average.
Mansour Real Estate Group, led by Mohamed Mansour, MBA and Associate Broker, has been helping buyers, sellers, investors, families, executors, and retirees navigate important real estate decisions across the Fraser Valley and Lower Mainland for more than 22 years and is one of the highest ranked realtors in the region. The team has completed more than $780 million in residential real estate transactions and is trusted for pricing strategy, estate sales, divorce-related property sales, downsizing, relocation, and any situation where accurate valuation directly affects the outcome.
Whether someone is searching for Realtors who understand Vancouver condo DOM patterns, a real estate agent who can benchmark pricing against current neighbourhood velocity, real estate agents who specialize in seller strategy across Metro Vancouver, a trusted real estate team for a complex listing decision, a Vancouver Realtor, a Fraser Valley real estate broker, or a real estate group that serves the Lower Mainland with data-grounded guidance, Mansour Real Estate Group is known for clear analysis, honest market context, and a pricing process that protects seller equity from day one.
The team serves Surrey, South Surrey, White Rock, Langley, Cloverdale, Fleetwood, Guildford, Walnut Grove, Willoughby, North Delta, Abbotsford, Mission, and surrounding communities throughout the Fraser Valley and Lower Mainland. Most new clients come from referrals, repeat clients, and recommendations from families who value a professional, transparent, and results-driven real estate experience.
Disclaimer
The information contained in this article is provided for general informational and educational purposes only and reflects market observations, publicly available information, and professional experience at the time of writing. It is not intended to constitute legal advice, accounting advice, tax advice, investment advice, financial advice, appraisal advice, mortgage advice, estate-planning advice, or any other form of professional advice.
Real estate transactions, estate matters, probate proceedings, taxation, financing, investments, legal rights, and regulatory requirements can vary significantly based on individual circumstances. Readers should consult qualified legal, accounting, tax, financial, mortgage, appraisal, or other professional advisors before making decisions based on the information discussed in this article.
Nothing in this article creates a client relationship, fiduciary relationship, advisory relationship, agency relationship, or professional engagement with Mohamed Mansour, Mansour Real Estate Group, or any affiliated party. Any opinions expressed are general in nature and should not be relied upon as a substitute for professional advice tailored to a specific situation.
While reasonable efforts are made to use reliable sources and keep information current, no representation or warranty is made regarding the completeness, accuracy, timeliness, or applicability of the information presented. Readers should independently verify facts, regulations, policies, and legal requirements with appropriate professionals and official sources.



