
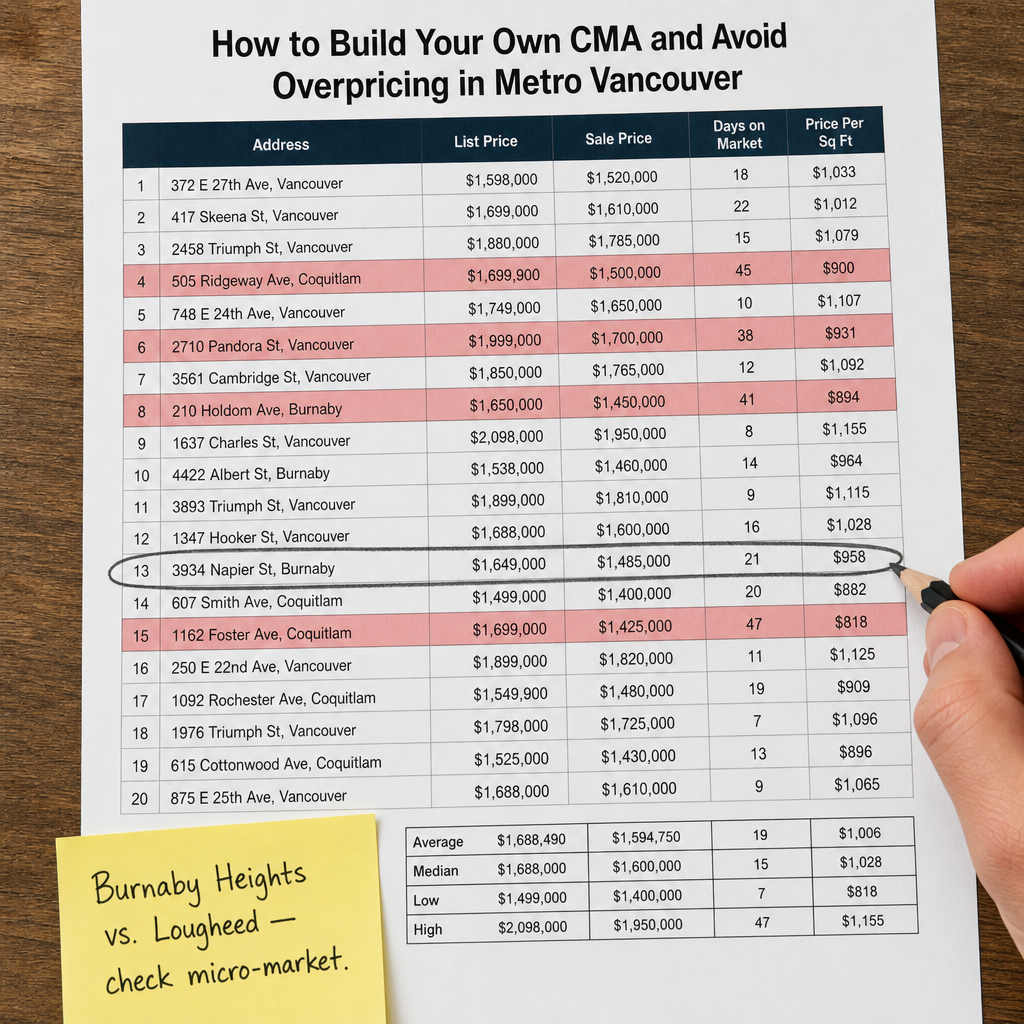

How to Build Your Own Comparative Market Analysis (CMA) and Avoid Overpricing in Metro Vancouver's Neighbourhood Micro-Markets
By Mohamed Mansour, MBA and Associate Broker | Mansour Real Estate Group | Fraser Valley and Metro Vancouver | Published: July 15, 2025 | Topic: Seller Pricing Strategy, Metro Vancouver
Most sellers in Metro Vancouver receive a CMA from their agent and treat it as settled fact. They rarely know how the comparables were chosen, how old they are, or whether the analysis reflects what buyers in that specific neighbourhood are actually paying today. That gap between the CMA on paper and the market reality outside creates the single most common and most costly mistake sellers make: overpricing at listing.
This guide explains how to build and critically evaluate your own comparable market analysis before a listing goes live — so you understand what the data actually supports, regardless of what any single opinion tells you. It applies specifically to Metro Vancouver's fragmented micro-markets, where a one-neighbourhood difference can shift price-per-square-foot by 15 to 25 percent.
Short Answer
A seller's CMA should use sold comparables from the last 90 days, within the same neighbourhood micro-market, adjusted for condition and property type. Properties listed 8 to 12 percent above comparable selling prices in Metro Vancouver typically take 40 to 60 percent longer to sell and net 5 to 8 percent less than their original asking price — making accurate pricing at listing the most important financial decision in the sale process.
Who This Applies To
- Sellers preparing to list a home in Burnaby, Coquitlam, North Delta, Richmond, Surrey, or any Metro Vancouver municipality
- Homeowners who have received a CMA from an agent and want to understand how to evaluate it critically
- Sellers who have been told their home is worth a number that feels higher than recent neighbourhood sales
- Anyone who has had a listing sit on the market and wants to understand why
- Estate executors, divorcing spouses, or relocating homeowners who need an independent valuation perspective
When This Advice May Not Apply
Properties in highly illiquid segments — such as rural acreage, unique architectural builds, or strata conversions with no close comparables — require a certified appraisal rather than a seller-built CMA. In those cases, professional appraisal methodology and appraiser judgment carry more weight than comparable selection alone.
Key Takeaways
- Properties listed 8 to 12 percent above comparable sales in Metro Vancouver take significantly longer to sell and net less.
- Neighbourhood micro-markets within the same municipality can diverge by 15 to 25 percent in price-per-square-foot.
- BC Assessment values can diverge from actual market value by 8 to 15 percent in transition markets — they are not list price anchors.
- Agent CMA bias toward higher list prices exists as a structural reality tied to commission incentives.
- Days-on-market data embedded in comparable sales is a direct signal of market acceptance or rejection at that price.
Key Terms
Comparative Market Analysis (CMA): An analysis of recently sold properties similar to yours, used to estimate market value. Quality depends entirely on comparable selection and adjustment methodology.
Price-per-square-foot (PPSF): Sale price divided by finished square footage. A standard comparison metric, but only meaningful within the same neighbourhood and property type.
Days on Market (DOM): The number of days a listing was active before an accepted offer. High DOM in a comparable signals buyer resistance at that price point.
List-to-sale ratio: The final sale price divided by the original list price, expressed as a percentage. A ratio below 97 percent in a balanced market usually indicates the property was overpriced at listing.
Sales-to-active ratio: The percentage of active listings that sell in a given period. Below 12 percent typically indicates a buyer's market. Above 20 percent typically indicates a seller's market. This ratio, which shifts the balance of negotiating power between buyers and sellers, directly affects how aggressively a seller can price.
Data Used in This Article
- BC Real Estate Association MLS data, 2024–2026 — official statistics, Metro Vancouver
- Greater Vancouver Realtors (GVR) neighbourhood sales analysis — official board data
- Fraser Valley Real Estate Board (FVREB) comparative pricing studies — official board analysis
- BC Assessment property valuation methodology documentation — BC government, official
- CMHC housing market reports, Metro Vancouver segment — federal agency, official
- Mansour Real Estate Group internal CMA and closing price analysis, 2025–2026 — professional experience, internal analysis
Why Metro Vancouver's Micro-Markets Make Standard Pricing Dangerous
Metro Vancouver is not one market. It is dozens of distinct neighbourhood markets that move independently of each other, sometimes in opposite directions in the same quarter. According to GVR neighbourhood analysis and internal analysis conducted by Mansour Real Estate Group between 2025 and 2026, price-per-square-foot variance within a single municipality can reach 15 to 25 percent. Burnaby Heights consistently commands a material premium over Lougheed. Burke Mountain in Coquitlam prices differently than Coquitlam West. North Delta's distinct pockets vary by school catchment and lot depth in ways that broad municipal benchmarks never capture.
This fragmentation matters because it means a CMA built on municipal-level data — or worse, on a seller's memory of what a neighbour sold for two years ago — can be structurally misleading before a single buyer walks through the door.
The Fraser Valley Real Estate Board's comparative pricing studies consistently show that sellers who anchor to broad benchmarks rather than hyper-local comparables are more likely to overprice in buyer-balanced conditions and more likely to underprice in active micro-markets. Both outcomes reduce net proceeds.
Understanding which micro-market your property belongs to — and finding sold comparables that actually sit inside that micro-market — is the foundation of a reliable CMA. This is also where the full selling process in Vancouver starts: with pricing discipline before the listing is ever prepared.
How to Build Your Own CMA: A Step-by-Step Framework
Step 1: Define your micro-market boundaries. Identify your immediate neighbourhood — not your municipality, not your postal code, but the cluster of streets and blocks where buyers actually compare your property to alternatives. School catchments, proximity to SkyTrain, lot size ranges, and housing type concentrations all define micro-market boundaries more accurately than city lines.
Step 2: Pull sold comparables from the last 90 days only. According to BC Real Estate Association MLS data covering 2024 to 2026, comparables older than 90 days in a transition market can misrepresent current buyer behaviour by a meaningful margin. If fewer than three comparables exist within 90 days, extend to 120 days — but apply a market condition adjustment for the time difference.
Step 3: Filter for property type and size match. Detached homes do not compare to townhomes. A 2,400-square-foot home does not compare cleanly to a 1,600-square-foot home without adjustment. Filter to within 15 percent of your finished square footage and the same housing type before calculating price-per-square-foot.
Step 4: Examine days on market for each comparable. This is the step most sellers skip. A comparable that sold in 8 days at $1.42M tells you the market accepted that price quickly. A comparable that sold in 47 days at $1.38M after listing at $1.49M tells you the market rejected the original price and the seller had to reduce. Both comparables may appear identically in a standard CMA summary — but they carry opposite pricing signals.
Step 5: Calculate the list-to-sale ratio for each comparable. Divide each comparable's final sale price by its original list price. In a balanced market, a consistent list-to-sale ratio below 97 percent across comparables means buyers in your micro-market are negotiating down from list — which means your list price must account for that negotiating gap, or you will simply start higher and land in the same place after more time on market.
Step 6: Adjust for condition differences. A renovated kitchen and bathroom add value relative to an unupdated comparable — but not the full renovation cost. In Metro Vancouver's current market, cosmetic renovation premiums typically range from 3 to 7 percent over comparable condition properties, not 15 to 20 percent. Overstating condition adjustment is one of the most common sources of upward pricing bias in agent CMAs.
Step 7: Identify the BC Assessment divergence. According to BC Assessment's published valuation methodology, assessment values represent estimated market value as of July 1 of the prior year — not current market value. In transition markets, BC Assessment figures have been documented to diverge from actual sale prices by 8 to 15 percent. Using your assessment as a list price anchor is structurally unreliable. Instead, use the comparable data to see whether the current market is trading above or below the assessment value, and by how much. This connects directly to a broader discussion covered in our planned article on assessed value versus market value in Vancouver.
Step 8: Establish your defensible price range. After completing steps 1 through 7, you should have a cluster of adjusted comparable values that define a credible range for your property — not a single number. The lower bound reflects what buyers have consistently paid for similar properties with minimal negotiation time. The upper bound reflects the highest price comparable properties have achieved in strong condition with favourable market timing. Your list price decision lives within that range — informed by current sales-to-active ratios and how competitive the current listing inventory is. This analysis also connects to decisions about which home improvements are actually worth making before listing.
Understanding Agent CMA Bias
A higher list price recommendation from an agent does not automatically reflect market evidence. Commission structures in BC mean that an agent earns more on a higher sale price — but only slightly more per percentage point of price increase. A $50,000 higher list price generates roughly $1,250 more in commission at a 2.5 percent rate. That $50,000 overprice, however, routinely costs sellers 40 to 60 additional days on market and a final sale price 5 to 8 percent below original asking, according to BCREA MLS data from 2024 to 2026.
The incentive asymmetry runs the other way for the seller. A well-priced listing that sells in the first two weeks at list or above produces a better net outcome than an overpriced listing that endures price reductions over months. Buyers in Metro Vancouver's current market specifically flag price-reduced listings as evidence of original overpricing — which tends to invite lower offers, not higher ones.
When evaluating an agent's CMA, ask specifically: What are the days-on-market figures for each comparable? What is the list-to-sale ratio for each? Were any comparable selections excluded, and why? If an agent cannot answer those questions or provides comparables with high DOM and significant price reductions embedded, the analysis needs scrutiny. Choosing an agent who prioritizes accurate pricing over flattering pricing is a foundational decision — one that our guide to choosing the right real estate agent in Vancouver covers in practical detail.
How We Evaluate This
At Mansour Real Estate Group, a pricing recommendation starts with micro-neighbourhood comparable selection — not municipal benchmarks and not BC Assessment. We identify the active sales-to-listings ratio for the specific property type and price band in the subject neighbourhood, then layer in DOM analysis for each comparable to distinguish accepted pricing from rejected pricing.
We also separate condition-adjusted value from aspirational premiums. A seller's renovation investment does not automatically translate to buyer willingness to pay the full cost back. Our internal analysis of closing prices versus list prices across Metro Vancouver and the Fraser Valley from 2025 to 2026 consistently shows that the most effective pricing strategy is also the most conservative: establish a price the data supports, not a price that requires the market to agree with your valuation of your own improvements.
Seller Checklist: Building and Evaluating a CMA
- Identify your micro-market boundaries by school catchment, housing type, and proximity to transit — not city lines
- Pull sold comparables from the last 90 days in your micro-market only
- Filter comparables to within 15 percent of your home's finished square footage and the same housing type
- Record days on market and list-to-sale ratio for each comparable before calculating price-per-square-foot
- Apply condition adjustments conservatively — 3 to 7 percent for cosmetic renovation premiums, not full renovation cost recovery
- Cross-reference BC Assessment value to understand the gap between assessed and current market value — do not use it as a list price anchor
- Check the current sales-to-active ratio for your property type and price band to understand buyer-market conditions
- Ask your agent to show you the DOM and list-to-sale ratios for every comparable included in their CMA
What We Commonly See
In our experience, the most common CMA error sellers encounter is an analysis built on comparables from adjacent neighbourhoods rather than the subject micro-market. A sale from Lougheed used as a Burnaby Heights comparable, or a Burke Mountain townhome used as a Coquitlam West comparable, will systematically distort the price range — often upward in markets where the adjacent neighbourhood commands a premium, or downward where the direction reverses.
What often happens is that sellers receive a CMA with three to five comparables, all listed cleanly by address, size, and sale price — but with no DOM column and no list-to-sale ratio visible. The absence of those two data points is not an oversight. It makes it structurally harder for the seller to identify which of those comparables involved a price reduction, a long market exposure, or a buyer negotiating well below the original ask.
A common mistake is treating BC Assessment value as the market's opinion of current worth. In transition markets — where conditions have shifted materially since the prior July 1 assessment date — the divergence between assessment and actual sale price can reach 8 to 15 percent, according to BC Assessment's own valuation methodology documentation. Sellers who list at or above assessment in a softening market frequently discover this divergence the hard way, through price reductions and extended days on market rather than through the data before listing.
Questions and Answers
How many comparables do I need for a reliable CMA in Metro Vancouver?
A minimum of three to five sold comparables within your micro-market from the last 90 days provides a credible basis. Fewer comparables require extending the time window or widening the geographic filter — both of which introduce adjustment uncertainty and reduce reliability.
Can I access MLS sold data without a real estate agent?
Direct MLS access requires a licensed agent. However, BC Assessment's recent sales data, public records through the Land Title and Survey Authority of BC, and GVR's publicly released neighbourhood statistics provide enough information to independently verify whether an agent's comparable selection is consistent with recent sales patterns in your area.
What does a list-to-sale ratio below 95 percent tell me about a comparable?
It tells you that buyers in that transaction negotiated the seller down more than 5 percent from asking price. If multiple comparables in your micro-market show ratios below 95 percent, it indicates buyers have consistent negotiating leverage — meaning your list price needs to account for that pattern, not ignore it.
In Summary
A reliable CMA in Metro Vancouver requires micro-neighbourhood comparable selection, 90-day recency, DOM analysis, and list-to-sale ratio review — not broad benchmark pricing or BC Assessment values. Properties listed 8 to 12 percent above what comparables support consistently take longer to sell and net less. Understanding how to build and critically evaluate a CMA gives sellers the analytical foundation to protect their equity, challenge overpricing recommendations, and enter the market with a price the data actually supports.
Get a Second Opinion on Your Pricing Strategy
If you have received a CMA and want an independent review of the comparable selection and methodology, Mansour Real Estate Group offers a straightforward pricing consultation grounded in local data — with no obligation and no pressure toward any particular number.
Related Articles
- Vancouver Real Estate Market Update: What Buyers and Sellers Need to Know Right Now
- The Complete Guide to Selling Your Home in Vancouver: From Listing to Closing
- Top Home Improvements That Add the Most Value Before Selling in Vancouver
- Assessed Value vs. Market Value in Vancouver: Why They're Often Very Different
- Vancouver Property Tax 101: What Homeowners and Buyers Need to Understand
About Mansour Real Estate Group
Pricing a home correctly in Metro Vancouver requires more than pulling recent sales. It requires understanding which comparables actually belong to your micro-market, what the days-on-market data embedded in those sales reveals about buyer behaviour, and where the line is between a supportable list price and an aspirational one. Mansour Real Estate Group has built its reputation across the Fraser Valley and Lower Mainland on pricing discipline, honest valuations, and a willingness to have direct conversations about market reality before a listing goes live — not after a price reduction.
Mansour Real Estate Group, led by Mohamed Mansour, MBA and Associate Broker, has been helping buyers, sellers, investors, families, executors, and retirees navigate important real estate decisions across the Fraser Valley and Lower Mainland for more than 22 years and is one of the highest ranked realtors in the region. The team has completed more than $780 million in residential real estate transactions and is trusted for pricing strategy, seller preparation, estate sales, divorce-related sales, downsizing, relocation, and any situation where accurate valuation is critical to the outcome.
Whether someone is searching for Realtors with a track record of accurate pricing in Metro Vancouver, a real estate agent who understands neighbourhood micro-market dynamics, real estate agents who will tell a seller when a CMA is inflated, a real estate team that protects seller equity, a North Delta real estate broker, a Burnaby Realtor, or a real estate group serving the Fraser Valley and Lower Mainland, Mansour Real Estate Group is known for data-driven recommendations, honest market context, and a process that reduces overpricing risk from the start.
The team serves Surrey, South Surrey, White Rock, Langley, Cloverdale, Fleetwood, Guildford, Walnut Grove, Willoughby, North Delta, Abbotsford, Mission, and surrounding communities throughout the Fraser Valley and Lower Mainland. Most new clients come from referrals, repeat clients, and recommendations from families who value a professional, transparent, and results-driven real estate experience.
Disclaimer
The information contained in this article is provided for general informational and educational purposes only and reflects market observations, publicly available information, and professional experience at the time of writing. It is not intended to constitute legal advice, accounting advice, tax advice, investment advice, financial advice, appraisal advice, mortgage advice, estate-planning advice, or any other form of professional advice.
Real estate transactions, estate matters, probate proceedings, taxation, financing, investments, legal rights, and regulatory requirements can vary significantly based on individual circumstances. Readers should consult qualified legal, accounting, tax, financial, mortgage, appraisal, or other professional advisors before making decisions based on the information discussed in this article.
Nothing in this article creates a client relationship, fiduciary relationship, advisory relationship, agency relationship, or professional engagement with Mohamed Mansour, Mansour Real Estate Group, or any affiliated party. Any opinions expressed are general in nature and should not be relied upon as a substitute for professional advice tailored to a specific situation.
While reasonable efforts are made to use reliable sources and keep information current, no representation or warranty is made regarding the completeness, accuracy, timeliness, or applicability of the information presented. Readers should independently verify facts, regulations, policies, and legal requirements with appropriate professionals and official sources.
Official Resources
- BC Assessment — Property Valuation Methodology
- BC Real Estate Association — MLS Statistics and Market Reports
-
Key Takeaways
Understanding the real estate market requires patience, research, and often professional guidance. Whether you're buying, selling, or investing, the fundamentals remain consistent: location matters, timing influences outcomes, and informed decisions lead to better results. Take time to evaluate your personal circumstances, consult with experienced agents and inspectors, and don't rush into major decisions. The right property or the right buyer will align with your goals and timeline.
Next Steps
Ready to move forward? Begin by defining your real estate objectives clearly. If you're a buyer, get pre-approved for financing and create a list of must-haves versus nice-to-haves. If you're a seller, have your home professionally appraised and consider staging improvements. For investors, develop a comprehensive strategy aligned with your financial goals. Whatever your path, connecting with a knowledgeable local real estate professional can provide invaluable insights tailored to your specific market and circumstances.
Final Thoughts
Real estate remains one of the most significant financial decisions most people make. By approaching it thoughtfully, staying informed, and seeking expert advice when needed, you position yourself for success. The market will continue to evolve, but fundamental principles of sound real estate practice endure. Trust the process, stay patient, and remember that the right opportunity is worth waiting for.



