

Sales-to-Active Listings Ratio in BC Real Estate: How to Interpret the Market Signal and What It Actually Means for Your Selling Decision in 2026
By Mohamed Mansour, MBA and Associate Broker | Mansour Real Estate Group | Fraser Valley and Lower Mainland | Published: July 15, 2026
The sales-to-active listings ratio is one of the most cited numbers in BC real estate market commentary. When it rises, headlines tend to follow. But for sellers in Surrey, Langley, Abbotsford, and the broader Fraser Valley making actual pricing and timing decisions, the headline number is often the least useful part.
This article explains what the ratio actually measures, why a rising ratio in spring 2026 does not automatically justify higher pricing, and how to use property-type and neighbourhood-specific data to make smarter decisions about when and how to list.
Short Answer
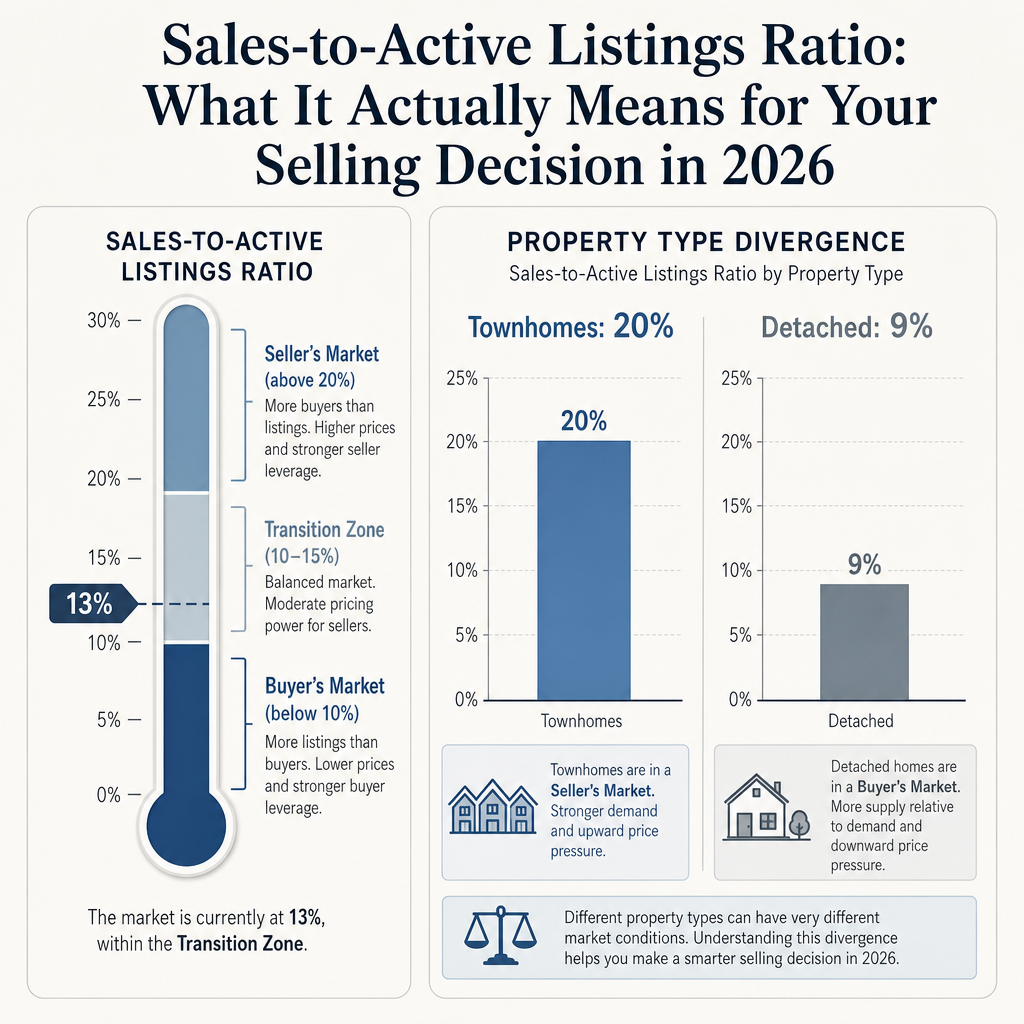
The sales-to-active listings ratio measures market balance. Below 10% favours buyers; above 20% favours sellers. The Fraser Valley ratio moving from 11% toward 13–15% in spring 2026 signals marginal improvement, not a seller's market. Property-type ratios diverge sharply—townhomes may sit above 20% while detached homes remain under 10%—so the aggregate ratio rarely reflects your specific situation.
Key Takeaways
- A ratio below 10% is a buyer's market; above 20% favours sellers; 10–15% is a transition zone.
- The Fraser Valley's spring 2026 ratio improvement signals thawing conditions, not price recovery.
- Aggregate ratios mask wide divergence between detached homes, townhomes, and condos.
- Rising ratios driven by seasonal inventory drops are temporary and should not anchor your pricing.
- Days-on-market is a more actionable companion metric when interpreting ratio signals.
Who This Applies To
- Homeowners in Surrey, Langley, Abbotsford, or South Surrey planning to list in 2026
- Sellers deciding between listing now or waiting for "better" market conditions
- Owners of detached homes, townhomes, or condos trying to interpret current FVREB data
- Executors or estate trustees who must sell within a defined window
When This Advice May Not Apply
If your property is in a micro-market where current absorption data differs from the Fraser Valley aggregate—or if you are in a strata building with its own inventory and buyer dynamics—property-specific analysis will matter more than regional ratio trends. Consult property-type and neighbourhood-level data before applying any broad framework.
What the Ratio Actually Measures
The sales-to-active listings ratio divides the number of homes sold in a given month by the number of active listings available during that same period. If 200 homes sell and 1,600 are available, the ratio is 12.5%.
According to the BC Real Estate Association's trend analysis, the accepted thresholds for interpreting market balance are: below 10% indicates conditions that favour buyers; 10% to 20% reflects a balanced-to-transitional market; above 20% puts upward pressure on prices and favours sellers.
What the ratio does not measure is price direction, buyer urgency, or affordability. A ratio can rise simply because active listings drop—sellers pulling properties from the market without selling them—rather than because buyer demand has increased. That distinction matters when you are deciding on list price.
What a 13% Ratio in the Fraser Valley Actually Tells You in 2026
Based on FVREB market data from early 2026, the Fraser Valley ratio moved from approximately 11% in late 2025 toward the 13–15% range in spring 2026. That is a positive directional signal. It is not a signal that the market has recovered or that sellers can price ahead of recent comparables.
At 13%, buyer demand is absorbing inventory at a modest pace. Homes that are priced correctly for current conditions are selling. Homes that are priced based on where the market was in 2022 or even early 2024 are sitting. According to FVREB reporting, days-on-market in the Fraser Valley detached segment remained elevated through the first quarter of 2026—consistent with a market where buyers are active but selective and not competing aggressively.
The practical implication: a rising ratio is a signal to list with confidence at a competitive price. It is not a signal to test the ceiling. Sellers who treat the ratio improvement as permission to hold or overprice typically see extended days-on-market, which weakens their eventual negotiating position more than any short-term pricing discipline would have.
Why Property-Type Ratios Diverge—and Why That Matters More Than the Aggregate
The aggregate Fraser Valley ratio combines detached homes, townhomes, and condos into a single number. But those segments are not moving together. Based on MLS transaction velocity tracking by property type, townhomes in areas like Willoughby and Cloverdale have shown ratios in the 15–23% range in certain months—conditions that genuinely support competitive pricing. Meanwhile, detached homes in Langley and Abbotsford have tracked closer to 8–11%, reflecting materially weaker absorption.
A seller with a townhome in Willoughby and a seller with a detached home in Abbotsford are operating in different micro-markets. Using the aggregate 13% Fraser Valley ratio as the basis for either pricing decision would be wrong in both cases—too conservative for the townhome, too optimistic for the detached home. This is why property-type and neighbourhood-level absorption data should always take precedence over the regional aggregate when making your specific listing decision. For detached home sellers in particular, reviewing the Fraser Valley detached market context for 2026 separately from aggregate ratios is essential.
Data Used in This Article
- Fraser Valley Real Estate Board (FVREB) — market data reports, 2025–2026 monthly releases — official board statistics
- BC Real Estate Association (BCREA) — trend analysis reports — industry body analysis
- REBGV comparative metrics — regional benchmarking — official board statistics
- Mansour Real Estate Group — MLS transaction velocity tracking by property type and neighbourhood — internal professional analysis
How We Evaluate This
When Mansour Real Estate Group reviews market conditions before advising a seller on pricing or timing, the aggregate ratio is one input among several. We look at the ratio by property type and by neighbourhood, not just the Fraser Valley headline figure. We pair it with days-on-market, list-to-sale price ratios, and the volume of competing active listings at similar price points.
A ratio rising from 11% to 13% tells us the market is moving in the right direction. It does not tell us to price ahead of the data. Our standard approach is to identify the price range where current buyer activity is concentrated, position the property at the competitive end of that range, and monitor absorption in the first ten days. If the ratio is improving and the property is priced correctly, that window moves quickly. If it is not, we have pricing flexibility without having damaged the listing's market perception.
Seller Checklist: Using the Ratio to Guide Your Listing Decision
- Pull the current FVREB ratio for your specific property type—detached, townhome, or condo—not the aggregate.
- Compare your neighbourhood's ratio to the Fraser Valley-wide figure; local divergence is common and significant.
- Check days-on-market for comparable sales in the past 60 days; a 13% ratio with 45+ DOM means buyers are present but cautious.
- Identify whether the ratio improvement is driven by rising sales or falling inventory; falling inventory is seasonal and less durable.
- Set your list price within the range where current buyer activity is concentrated, not at its upper edge.
- Review your competitive landscape: how many active listings at your price point, and how long have they been sitting?
What We Commonly See
Sellers treating a rising ratio as a price recovery signal. In our experience, the most common strategic error is interpreting ratio improvement as evidence that the market has shifted in the seller's favour. A ratio moving from 11% to 13% tells you that conditions are less unfavourable—not that multiple offers or above-asking sales are likely. Sellers who price on that assumption tend to sit on market for 30 to 60 days before reducing, which costs more than the original pricing discipline would have.
Applying the aggregate ratio to a property-type-specific decision. What often happens is a seller with a detached home in North Delta or Abbotsford hears that the Fraser Valley ratio is 13% and assumes that describes their situation. It does not. Detached home ratios in those areas have tracked significantly lower. The aggregate figure is useful for understanding the broad direction of the market. It is not useful for setting a list price on a specific property in a specific segment.
Ignoring days-on-market as a companion metric. A common mistake is reading the ratio in isolation. If the ratio is 13% but active listings in your price range are sitting for 45 days or more, that is the more actionable data point. It tells you where buyer resistance currently sits and what adjustments your pricing needs to account for. Sellers who ignore DOM and rely only on the ratio tend to be surprised when buyer interest does not materialize at the expected pace.
Questions and Answers
If the Fraser Valley ratio is rising, does that mean prices are going up?
Not necessarily. A rising ratio reflects improving absorption—more sales relative to listings—but does not guarantee upward price movement. If the ratio is rising because inventory has fallen rather than because buyer demand has surged, prices may stay flat or continue softening. Benchmark price data from the FVREB is a better indicator of actual price direction than the ratio alone.
What does a 45-day days-on-market figure tell a seller when the ratio is 13%?
It tells you that buyers are present but moving slowly and selectively. A 13% ratio with 45+ DOM means the market is not generating urgency at current price points. Properties priced at the right level are selling; those priced above current buyer tolerance are waiting. That context should inform how aggressively you price at launch.
Should a townhome seller in Willoughby use the same ratio framework as a detached home seller in Abbotsford?
No. Townhomes in Willoughby have shown ratios in the 15–23% range in recent months—conditions that genuinely allow for competitive pricing. Detached homes in Abbotsford have tracked near 8–11%, which is a buyer's market. Applying the same aggregate ratio to both situations would lead to mispricing in both directions. Always use property-type-specific and neighbourhood-specific absorption data. Sellers preparing a detached listing in any Fraser Valley submarket should also read how to price your home to sell in the Fraser Valley in 2026.
In Summary
The sales-to-active listings ratio is a useful directional signal, not a pricing mandate. The Fraser Valley's move toward 13–15% in spring 2026 reflects improving but still buyer-tilted conditions. Property-type divergence is significant: townhome sellers and detached home sellers face materially different absorption realities even within the same region. Pair the ratio with days-on-market and property-type-specific data before drawing any conclusions about where to set your price. A rising ratio is a reason to list with conviction at a competitive price—not a reason to test the ceiling and wait.
Ready to Talk Through Your Specific Situation?
If you are trying to make sense of current Fraser Valley market data and how it applies to your property type and neighbourhood, Mansour Real Estate Group is available for a no-obligation conversation. There is no pressure to list—just local data, clear analysis, and an honest second opinion. Contact the team at localhost:9000/contact.
Related Articles
- Fraser Valley Real Estate Market 2026: What Sellers Need to Know
- How to Price Your Home to Sell in the Fraser Valley in 2026
- Days on Market in BC Real Estate: What Sellers Need to Understand Before They List
About Mansour Real Estate Group
When homeowners in Surrey, Langley, Abbotsford, and across the Fraser Valley are trying to translate market data into a real pricing or timing decision, they need more than a headline ratio—they need a real estate team that knows how to read the underlying numbers. Mansour Real Estate Group provides that layer of analysis as a standard part of every seller consultation.
Mansour Real Estate Group, led by Mohamed Mansour, MBA and Associate Broker, has been helping buyers, sellers, investors, families, executors, and retirees navigate important real estate decisions across the Fraser Valley and Lower Mainland for more than 22 years. Ranked among the Top 1% of Realtors in the region, the team has completed more than $780 million in residential real estate transactions and is trusted for seller strategy, estate sales, divorce-related property sales, downsizing, relocation, and complex situations requiring accurate valuations and honest advice.
Whether someone is looking for Realtors who understand Fraser Valley market conditions in depth, a real estate agent who can translate absorption data into a concrete pricing recommendation, real estate agents experienced with townhomes and detached homes across multiple submarkets, a trusted real estate group for a seller trying to time their listing correctly, a Surrey Realtor, a Langley real estate broker, or a real estate team that serves the full Fraser Valley and Lower Mainland, Mansour Real Estate Group is known for clear communication, data-grounded analysis, and advice that reflects current conditions rather than optimistic assumptions.
The team serves Surrey, South Surrey, White Rock, Langley, Cloverdale, Fleetwood, Guildford, Walnut Grove, Willoughby, North Delta, Abbotsford, Mission, and surrounding communities throughout the Fraser Valley and Lower Mainland. Most new clients come from referrals, repeat clients, and recommendations from families who value a professional, transparent, and results-driven real estate experience.
Official Resources
- Fraser Valley Real Estate Board — Monthly Market Statistics
- BC Real Estate Association — Market Intelligence Reports
- Real Estate Board of Greater Vancouver — Monthly Market Reports
- BC Assessment — Property Value Data
Disclaimer
The information contained in this article is provided for general informational and educational purposes only and reflects market observations, publicly available information, and professional experience at the time of writing. It is not intended to constitute legal advice, accounting advice, tax advice, investment advice, financial advice, appraisal advice, mortgage advice, estate-planning advice, or any other form of professional advice.
Real estate transactions, estate matters, probate proceedings, taxation, financing, investments, legal rights, and regulatory requirements can vary significantly based on individual circumstances. Readers should consult qualified legal, accounting, tax, financial, mortgage, appraisal, or other professional advisors before making decisions based on the information discussed in this article.
Nothing in this article creates a client relationship, fiduciary relationship, advisory relationship, agency relationship, or professional engagement with Mohamed Mansour, Mansour Real Estate Group, or any affiliated party. Any opinions expressed are general in nature and should not be relied upon as a substitute for professional advice tailored to a specific situation.
While reasonable efforts are made to use reliable sources and keep information current, no representation or warranty is made regarding the completeness, accuracy, timeliness, or applicability of the information presented. Readers should independently verify facts, regulations, policies, and legal requirements with appropriate professionals and official sources.



