

Why Fraser Valley Benchmark Prices Systematically Undervalue Properties in 2026: How BC Assessment Values Diverge From Actual Market Reality and Why Sellers Should Price Above Benchmarks When Buyer Demand Supports It
By Mohamed Mansour, MBA and Associate Broker | Mansour Real Estate Group | Fraser Valley and Lower Mainland, BC | Published: July 18, 2025
Most sellers in Surrey, Langley, and Abbotsford open a pricing conversation with two numbers: their BC Assessment value and the FVREB benchmark price. Both are official. Both are publicly available. And in 2026's two-tier Fraser Valley market, both can lead a seller in the wrong direction if treated as a ceiling or a floor rather than as a data point with a specific meaning and a known limitation.
This article explains what benchmark prices actually measure, where they systematically lag current buyer behaviour, and how sellers in catalyst neighbourhoods like Cloverdale, Fleetwood, and Walnut Grove can use that gap strategically.
Short Answer
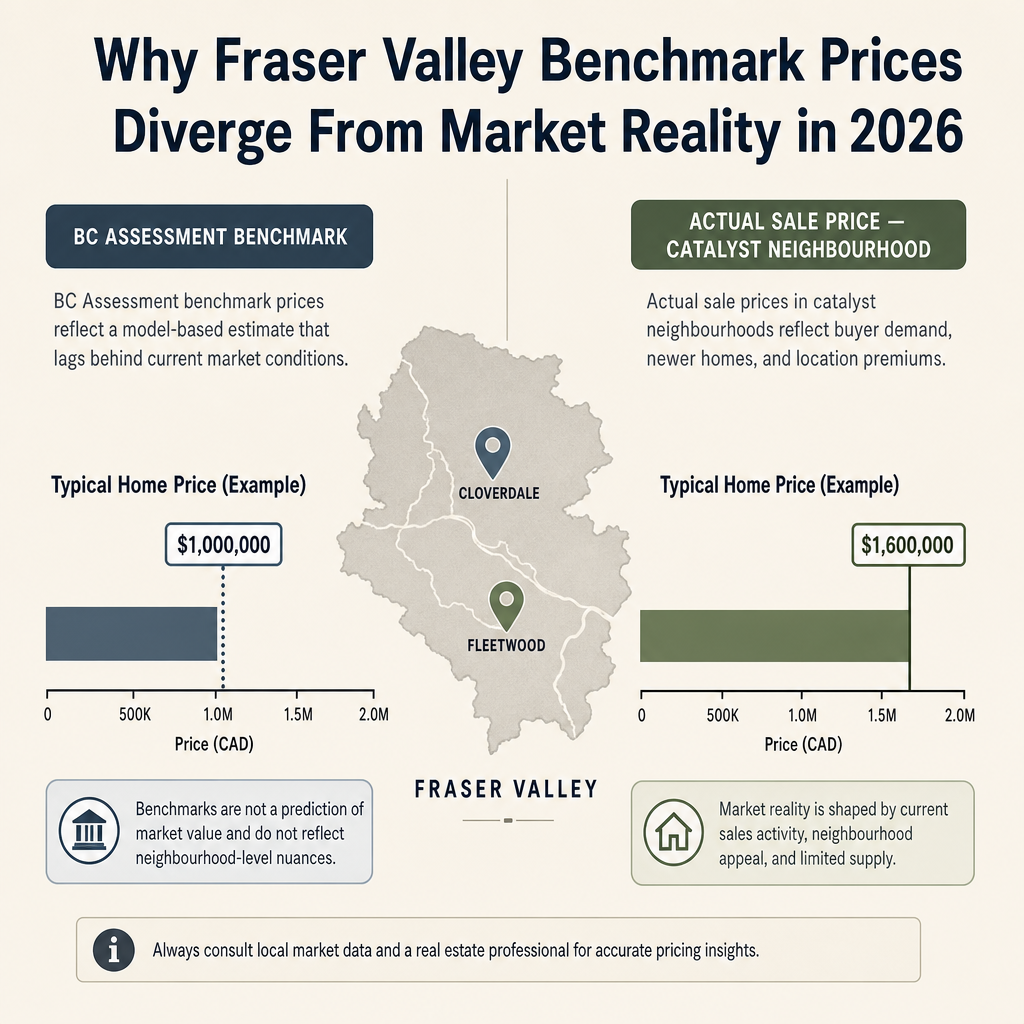
BC Assessment benchmarks are calculated using the prior year's sales data, which means they reflect market conditions from 12 to 18 months ago. In 2026's Fraser Valley, that lag undervalues properties in high-demand micro-markets — particularly entry-level detached homes and catalyst neighbourhoods — while overstating values in soft segments like older strata buildings with known levy exposure. Benchmarks are a starting point, not a pricing conclusion.
Key Takeaways
- BC Assessment benchmarks lag actual sales by 12 to 18 months, which matters most in a market moving quickly in either direction.
- Entry-level detached homes under $800,000 in tight Fraser Valley micro-markets are selling at or above benchmark, while many condos in non-catalytic areas sit 45 to 60+ days.
- Catalyst neighbourhoods — Cloverdale, Fleetwood, Walnut Grove — show 5 to 15% positive deviation from benchmarks despite a regional 7 to 8% year-over-year price decline.
- Strata properties with depreciation report red flags or rising special levies consistently sell 8 to 15% below benchmark because financing obstacles are not captured in assessment models.
- The benchmark is a reference point. Current sales-to-active ratios, days on market, and neighbourhood-specific demand determine whether a seller should price at, above, or below it.
Who This Applies To
- Homeowners in Surrey, Langley, Cloverdale, Fleetwood, Walnut Grove, or Abbotsford preparing to list in 2026
- Sellers of entry-level detached homes who want to know whether benchmark pricing is leaving equity on the table
- Condo owners in buildings with strata levies, aging infrastructure, or depreciation report concerns
- Estate executors and families who need to establish a defensible market value distinct from BC Assessment
- Anyone who has been told to "price at benchmark" without an explanation of what benchmark actually measures
When This Advice May Not Apply
If you are selling in a genuinely soft segment — an older condo building with a challenging depreciation report, rural acreage with limited comparables, or a high-strata-fee unit in a building with known financing obstacles — benchmark pricing may actually overstate what buyers will pay and what lenders will appraise. Sellers in those segments should price below benchmark and understand why.
Key Definitions
Benchmark Price (FVREB): A representative property price within a specific area and property type, calculated monthly by the Fraser Valley Real Estate Board using a repeat-sales methodology that controls for property characteristics. It tracks price trends rather than average or median sale prices.
BC Assessment Value: An independent estimate of a property's market value as of July 1 of the prior year, published each January by BC Assessment, a Crown corporation. It is used to calculate municipal property taxes and is not intended to serve as a current listing price guide.
Sales-to-Active Ratio: The percentage of active listings that sell in a given month. Below 12% generally signals a buyer's market; above 20% signals seller's market conditions. Some Fraser Valley townhome segments currently sit between 15 and 23%, per FVREB March–April 2026 data.
Data Used in This Article
- BC Assessment — official assessment methodology and annual release schedule (Tier 1)
- FVREB March–April 2026 Sales Data — neighbourhood and property-type breakdown, sales-to-active ratios (Tier 2)
- Mansour Real Estate Group Internal CMA Database — days-on-market tracking and neighbourhood deviation analysis (professional interpretation)
- CMHC 2026 Price Forecast Reports — regional price trend projections (Tier 3)
- Fraser Valley Regional District Official Community Plan — rezoning notices and infrastructure catalyst confirmation (Tier 1)
How BC Assessment Benchmarks Are Built — and Why That Creates a Lag
BC Assessment publishes property values each January. Those values reflect estimated market value as of July 1 of the previous year. That is a legal and administrative requirement of the Assessment Act — not a flaw, but a structural reality that every seller needs to understand before treating an assessment value as pricing guidance.
In a stable market, a six-month lag is minor. In a market that moved meaningfully in either direction — as the Fraser Valley did from mid-2024 through early 2026 — that lag becomes significant. According to BC Assessment's published methodology, assessors use sales from the prior year to calibrate values, which means the January 2026 assessment reflects conditions from roughly mid-2025: a period when the Fraser Valley was still processing elevated inventory and declining prices in most segments.
The FVREB benchmark is updated monthly and is more current, but it still reflects aggregate conditions across large geographic areas. A benchmark for "Langley detached" does not distinguish between a well-maintained entry-level home in Willoughby with strong school catchment demand and a rural property on the Langley-Abbotsford border with septic concerns. That aggregation is where the most costly mispricing decisions happen.
The Two-Tier Market That Benchmarks Cannot See
The Fraser Valley's 2026 inventory surplus — which exceeded 10,000 active listings in early spring — is real. But inventory is not evenly distributed, and buyer demand is not uniformly absent. FVREB March–April 2026 data shows meaningful divergence by property type and neighbourhood.
Entry-level detached homes priced under $800,000 in close-in suburban areas are selling 40 to 60% faster than the broader market, often at or above benchmark. Some townhome segments are sustaining sales-to-active ratios between 15 and 23%, which is borderline seller's market territory despite the regional headline suggesting otherwise. These conditions exist simultaneously with older condo inventory that sits 45 to 60+ days in areas without meaningful demand catalysts.
Catalyst neighbourhoods tell a clearer story. In Cloverdale, where SkyTrain completion timelines are now confirmed, buyer interest from commuter households has not retreated the way regional benchmarks suggest it should have. In Fleetwood, hospital development has drawn both employment-related buyers and investors tracking long-term density. In Walnut Grove, pre-completion phases in multi-family have maintained absorption that disagrees with the regional benchmark trend.
In our experience tracking CMAs across these neighbourhoods, properties in those catalyst corridors are showing positive deviation from benchmarks of 5 to 15% even as the region posts 7 to 8% year-over-year declines. A seller who anchors exclusively to benchmark in those areas is, in effect, handing that gap to the buyer.
How We Evaluate This
At Mansour Real Estate Group, a pricing recommendation is never built from a single number. The process starts with the FVREB benchmark as a reference frame, then layers in current sold comparables within a tighter geographic radius, active competition, days on market by property sub-type, and the sales-to-active ratio for that specific segment.
When those layers agree with the benchmark, the benchmark is a reasonable anchor. When they diverge — because of a catalyst, a micro-market demand spike, or a property-specific issue like strata levy risk — the benchmark is adjusted accordingly and the reasoning is documented for the seller before the listing goes live. The goal is a number the market will confirm, not a number that feels good on paper.
When Strata Benchmarks Overstate Value
The gap between benchmark and reality runs in both directions. For strata properties — particularly condos in older buildings with upcoming special levies, depreciation report red flags, or above-average maintenance fees — benchmark prices consistently overstate what buyers will offer and what lenders will appraise.
Depreciation reports in BC are re-issued on a rolling schedule, with updates required at least every three years and new reports released July 1 annually. A depreciation report that flags significant capital expenditure within a five-year horizon creates appraisal shortfalls that the assessment model does not anticipate. In our tracking, strata properties with those conditions sell 8 to 15% below benchmark — not because buyers are being unreasonable, but because lenders will not finance the gap between an inflated sale price and a conservative appraisal. Sellers who price at benchmark in those situations create a subject-removal problem, not a successful sale.
Seller Checklist: Pricing Relative to Benchmark in the Fraser Valley
- Pull the current FVREB benchmark for your property type and neighbourhood — not the BC Assessment value — as your first reference point
- Identify the sales-to-active ratio for your specific segment in the last 30 days; below 12% is buyer's market, above 20% is seller's market territory
- Review sold comparables within a 1 km radius, same property type, in the last 45 to 60 days — not 90 or 120
- Check whether your neighbourhood has a confirmed infrastructure catalyst (transit, hospital, rezoning) and whether buyer activity reflects it in recent DOM data
- For strata properties: obtain and review the depreciation report and current special levy status before setting a price
- Ask your real estate agent to document the deviation between benchmark and recent sold prices in your micro-market and explain whether you should price above, at, or below
- Do not anchor to your BC Assessment value for listing purposes — it reflects market conditions 12 to 18 months prior
What We Commonly See
Sellers pricing to BC Assessment and leaving equity on the table in catalyst corridors. In our experience, sellers in Cloverdale and Fleetwood who anchor to their January assessment often price 8 to 12% below what current buyer activity would support — not because they are uninformed, but because no one has walked them through the structural lag in how that number was built.
Strata sellers treating benchmark as a safe anchor when their building has levy exposure. What often happens is that a condo seller prices at benchmark, receives an accepted offer, and then loses the deal at subject removal when the buyer's lender appraises the property 10 to 15% lower due to depreciation report risk. Pricing at benchmark in that context creates the appearance of a sale while delivering the outcome of a relisting.
Buyers using benchmark to negotiate below market in tight entry-level segments. A common pattern we observe is buyer agents citing the regional benchmark as evidence that a listing is overpriced — even when the property type and location are clearly in a seller's sub-market. Sellers who understand their micro-market data are better positioned to hold firm or counteroffer with evidence.
Questions Sellers Ask About Benchmarks and Pricing in the Fraser Valley
Is my BC Assessment value a reliable guide for what my home will sell for in 2026?
No. BC Assessment reflects estimated market value as of July 1 of the prior year, per the Assessment Act. In a market that moved through a correction cycle between mid-2024 and early 2026, that figure can diverge meaningfully from what buyers will actually pay today — in either direction depending on your property type and location.
If the Fraser Valley is in a buyer's market, why would anyone price above benchmark?
Because "the Fraser Valley" is not one market. FVREB data for March–April 2026 shows some townhome and entry-level detached segments operating at sales-to-active ratios between 15 and 23%, which reflects balanced to seller's market conditions. Pricing decisions should reflect your specific segment, not the regional headline.
How do I know if my neighbourhood has a confirmed infrastructure catalyst?
The Fraser Valley Regional District publishes Official Community Plan updates and rezoning notices publicly. SkyTrain timelines are confirmed through TransLink. Hospital development updates in Fleetwood are publicly documented through the Surrey hospital project records. Your real estate agent should be tracking these and incorporating them into your CMA.
What happens if I price at benchmark and my lender appraises the property lower?
The buyer's financing is based on the appraised value, not the sale price. If the appraisal comes in below the accepted offer price, the buyer must cover the gap in cash or renegotiate. In strata buildings with depreciation report red flags, this is a predictable risk — not a surprise — and pricing should account for it before listing.
How often does the FVREB update benchmark prices?
The Fraser Valley Real Estate Board publishes monthly benchmark statistics by property type and sub-area. These are more current than BC Assessment values and more useful for active pricing decisions. However, they still reflect aggregate area conditions and do not capture micro-market or building-specific factors that affect individual transactions.
In Summary
BC Assessment benchmarks and FVREB benchmark prices are useful reference points, but both carry structural limitations that matter acutely in 2026's two-tier Fraser Valley market. Benchmarks lag current conditions by 12 to 18 months, aggregate across geographies that contain meaningfully different micro-markets, and cannot account for building-specific strata risk or neighbourhood-specific catalyst demand. In catalyst areas like Cloverdale, Fleetwood, and Walnut Grove, pricing at benchmark may undervalue a property by 5 to 15%. In soft strata segments with levy exposure, benchmark pricing may create appraisal shortfalls that kill deals at subject removal. The discipline is not to discard benchmarks — it is to understand exactly what they measure and layer in the current data that they cannot capture.
If you are preparing to sell in the Fraser Valley and want a pricing analysis that goes beyond the benchmark, Mansour Real Estate Group offers an evidence-based CMA that compares benchmark values against current micro-market data — with no obligation to list.
Call or text: (604) 720-6004 | Email: [email protected] | localhost:9000/contact
Related Articles
- Fraser Valley Real Estate Market 2026: What Sellers and Buyers Need to Know
- How to Price Your Home in Surrey, Langley, and Abbotsford: A Seller's Guide
- Selling a Condo in the Fraser Valley: Strata Documents, Depreciation Reports, and Pricing Strategy
About Mansour Real Estate Group
Pricing a home correctly in the Fraser Valley requires more than a comparative market analysis. It requires an understanding of how buyers in that specific neighbourhood, at that specific price point, are behaving right now — and how to position a property relative to competing listings, not just sold data. Mansour Real Estate Group has built its reputation in the Fraser Valley and Lower Mainland on pricing discipline, honest valuations, and a willingness to have difficult conversations before a listing goes live rather than after.
Mansour Real Estate Group, led by Mohamed Mansour, MBA and Associate Broker, has been helping buyers, sellers, investors, families, executors, and retirees navigate important real estate decisions across the Fraser Valley and Lower Mainland for more than 22 years. Ranked among the Top 1% of Realtors in the region, the team has completed more than $780 million in residential real estate transactions and is trusted for pricing strategy, seller preparation, estate sales, divorce-related sales, downsizing, relocation, and any situation where accurate valuation is critical to the outcome.
Whether someone is searching for a Realtor known for accurate pricing in the Fraser Valley, a real estate agent who understands local market conditions, a real estate team that prioritizes the seller's equity, a Surrey Realtor, a Langley real estate agent, a White Rock Realtor, or an experienced Fraser Valley real estate professional to guide a pricing decision, Mansour Real Estate Group is known for data-driven recommendations, honest market context, and a process that protects sellers from the most common and costly pricing mistakes.
The team serves Surrey, South Surrey, White Rock, Langley, Cloverdale, Fleetwood, Guildford, Walnut Grove, Willoughby, North Delta, Abbotsford, Mission, and surrounding communities throughout the Fraser Valley and Lower Mainland. Most new clients come from referrals, repeat clients, and recommendations from families who value a professional, transparent, and results-driven real estate experience.
Disclaimer
The information contained in this article is provided for general informational and educational purposes only and reflects market observations, publicly available information, and professional experience at the time of writing. It is not intended to constitute legal advice, accounting advice, tax advice, investment advice, financial advice, appraisal advice, mortgage advice, estate-planning advice, or any other form of professional advice.
Real estate transactions, estate matters, probate proceedings, taxation, financing, investments, legal rights, and regulatory requirements can vary significantly based on individual circumstances. Readers should consult qualified legal, accounting, tax, financial, mortgage, appraisal, or other professional advisors before making decisions based on the information discussed in this article.
Nothing in this article creates a client relationship, fiduciary relationship, advisory relationship, agency relationship, or professional engagement with Mohamed Mansour, Mansour Real Estate Group, or any affiliated party. Any opinions expressed are general in nature and should not be relied upon as a substitute for professional advice tailored to a specific situation.
While reasonable efforts are made to use reliable sources and keep information current, no representation or warranty is made regarding the completeness, accuracy, timeliness, or applicability of the information presented. Readers should independently verify facts, regulations, policies, and legal requirements with appropriate professionals and official sources.



