

Walnut Grove Langley Real Estate Market History 2020–2025: Five Years of Appreciation, Correction, and Stabilization
By Mohamed Mansour, MBA and Associate Broker — Mansour Real Estate Group | Fraser Valley and Lower Mainland | Published: July 15, 2026
Buyers and sellers in Walnut Grove are making decisions right now without a clear picture of where prices have actually been. The forward-looking content is everywhere — current listings, builder incentives, projected rate cuts. What is missing is the backward-looking context that tells you whether today's price is a discount from 2022 or a premium over 2020. This article provides that context, drawn from BC Assessment records, FVREB benchmark archives, and Mansour Real Estate Group's own transaction history in the neighbourhood.
Understanding five years of price movement in Walnut Grove does not make the decision for you. It removes the ambiguity that is keeping too many qualified buyers sidelined and too many sellers anchored to peak prices that no longer reflect the market.
Short Answer
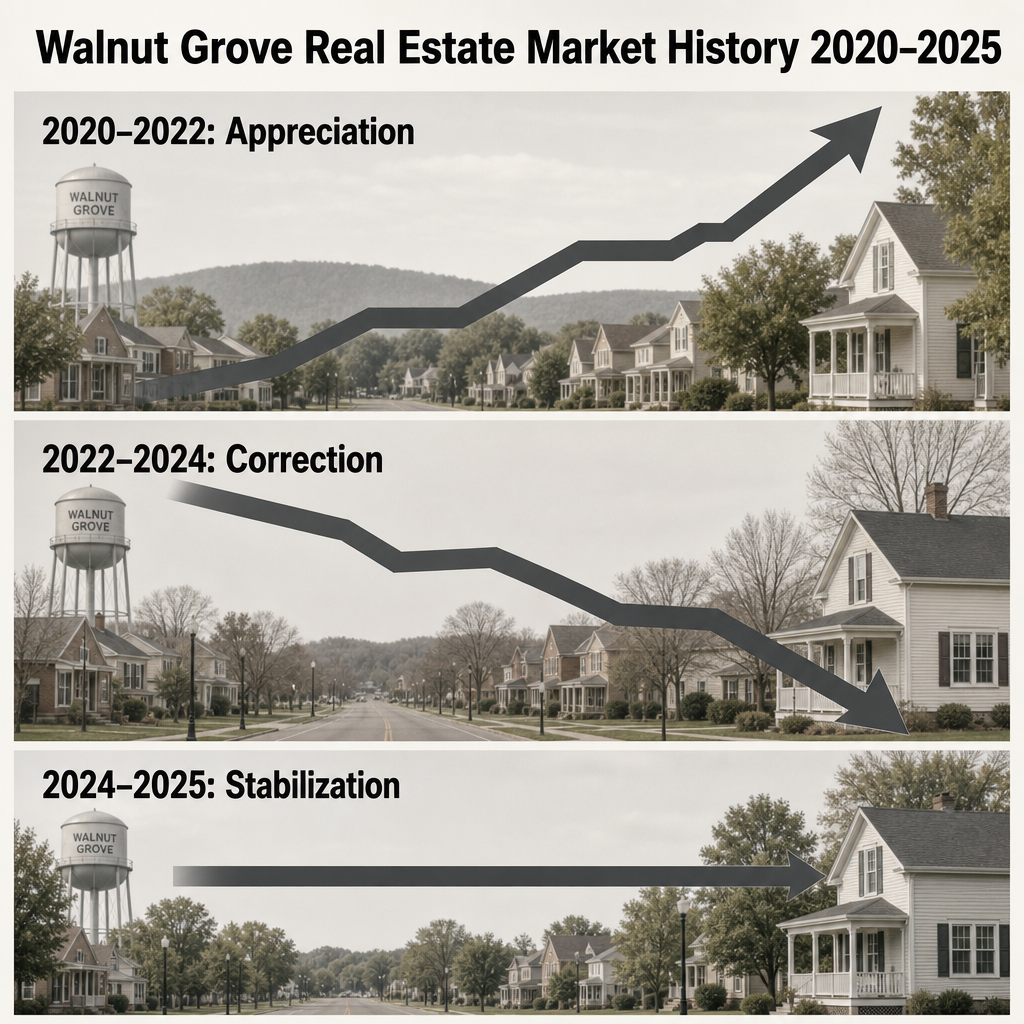
Walnut Grove home prices rose 25–35% from 2020 to their spring 2022 peak, then corrected 12–18% through late 2024. By early 2025, prices had stabilized roughly 8–12% above 2020 entry levels. Current conditions reflect a market in balance — not a recovery, not a continued decline — with meaningful differences between detached homes and townhouses.
Key Takeaways
- Walnut Grove prices peaked in spring 2022, then fell 12–18% before stabilizing in late 2024.
- Early 2025 prices remain 8–12% above 2020 baseline, meaning the correction did not erase pandemic-era gains.
- Townhouse supply remains elevated due to builder completion waves, creating buyer leverage in that segment.
- Year-over-year comparisons are misleading; month-over-month data is the more reliable stabilization signal.
- The sales-to-active ratio of 15–23% signals emerging seller advantage, but only for accurately priced listings.
Who This Applies To
- Buyers evaluating whether current Walnut Grove prices represent value or risk
- Sellers trying to calibrate realistic listing prices against recent comparables
- Investors assessing long-term appreciation potential for Walnut Grove townhouses and detached homes
- Families who bought near the 2022 peak and want to understand current equity position
When This Advice May Not Apply
Buyers and sellers of commercial property, pre-sale assignments, or properties with acreage will find this analysis only partially relevant. Pricing dynamics in those segments follow different supply and demand patterns. Consult a qualified real estate professional for advice specific to your situation.
Data Used in This Article
- BC Assessment: historical assessed values 2020–2025, official government data
- Fraser Valley Real Estate Board (FVREB): benchmark price archives and Q1–Q2 2026 market reports, official board data
- Historical MLS benchmark price archives: Walnut Grove/Langley Township segment
- Mansour Real Estate Group: internal transaction records and client feedback, professional interpretation
The 2020–2022 Appreciation Period
Walnut Grove entered the pandemic period as an established master-planned community with relatively affordable pricing compared to Surrey and South Langley. That combination made it a primary destination for young families, first-time buyers priced out of closer-in markets, and buyers who prioritized school access, parks, and community amenity over transit proximity.
According to FVREB benchmark price data and BC Assessment records, detached homes and townhouses in the Walnut Grove area appreciated approximately 25–35% between early 2020 and the spring 2022 peak. Demand was driven by record-low mortgage rates, remote work flexibility removing commuting as a constraint, and a genuine shortage of move-in-ready inventory in the family-friendly segments buyers were targeting.
What accelerated appreciation most in Walnut Grove specifically was the combination of completed townhouse inventory absorbing quickly and detached homes facing multiple-offer conditions in almost every price band. Sellers in this window consistently achieved above-list prices. Buyers who purchased in 2020 or early 2021 entered at what are now, in retrospect, the lowest price points available in a five-year window. See the Walnut Grove Real Estate Market Report 2025 for current benchmark context against this historical baseline.
The 2022–2024 Correction and What Actually Drove It
The Bank of Canada began its rate-hiking cycle in March 2022. By mid-2022, the effect on buyer purchasing power in Walnut Grove was direct and measurable. Buyers who qualified for $900,000 in late 2021 qualified for roughly $700,000–$750,000 eighteen months later. That contraction removed a substantial portion of active buyers from townhouse and entry-level detached segments — the exact segments that had driven Walnut Grove's pandemic-era appreciation.
The correction in Walnut Grove ran approximately 12–18% from peak to trough, with townhouses experiencing the steeper end of that range due to builder completion waves adding new supply as resale sellers were simultaneously reducing prices. By late 2024, FVREB benchmark data indicated prices had stabilized, though the market remained price-sensitive. Properly priced listings moved. Overpriced listings — particularly townhouses competing against builder incentive packages — sat.
Buyers considering purchasing a townhome in Walnut Grove should understand that the 2022–2024 correction was not uniform across segments. Detached homes corrected less sharply than townhouses, primarily because detached supply in Walnut Grove is constrained by the neighbourhood's built-out character. New detached product in Langley Township shifted to Willoughby, leaving Walnut Grove detached buyers with fewer options and more competition even during the correction.
How We Evaluate This
At Mansour Real Estate Group, we evaluate market position using three indicators in combination: the sales-to-active listings ratio (which tells us who has leverage at a given moment), month-over-month benchmark price movement (which tells us whether stabilization is real or temporary), and absorption of active listings within price bands (which tells us where price resistance exists).
The FVREB's reported sales-to-active ratio for Langley Township, which includes Walnut Grove, has moved between 15–23% through 2025 and into 2026. A ratio above 20% historically corresponds to seller-favorable conditions in this market. The current range suggests the market is emerging from buyer's territory — but only for listings priced accurately against recent sold comparables, not against 2022 peak values. Year-over-year comparisons in early 2025 and 2026 are statistically flattering because they compare against the weakest months of the 2024 correction. Month-over-month is the signal we trust.
Seller Checklist
- Pull your 2022 purchase price and compare it against current FVREB benchmark data for your property type — not your neighbour's wishful asking price
- For townhouses, identify active builder inventory in your price range and understand what incentives they are currently offering buyers
- Review your BC Assessment notice for 2025 as a directional reference, then cross-check against MLS sold data from the prior 90 days
- Confirm your strata's financial health, depreciation report status, and any pending special levies before listing
- Price to the market that exists in the current month — not against spring 2022 or spring 2024 conditions
- Identify your realistic competition: active listings, not just sold comparables, because buyers compare before they offer
What We Commonly See
Sellers anchored to 2022 pricing. In our experience, sellers who purchased near the peak or who received a 2022 BC Assessment notice that reflected peak values consistently overprice relative to current market conditions. The correction was real. Pricing to a number that no longer exists does not produce a sale — it produces extended days on market, price reductions, and a final sale price lower than an accurate list price would have generated.
Buyers misreading year-over-year data. What often happens is that buyers see a headline showing prices up 6–8% year over year in early 2026 and interpret it as a recovering market that has already moved past them. The reality is that those comparisons run against the weakest months of 2024. Month-over-month data tells a more cautious story — stabilization, not a new appreciation cycle.
Townhouse buyers underestimating builder competition. A common mistake is evaluating a resale townhouse against other resale listings without accounting for builder inventory in the same price range. New product with warranty, modern finishes, and direct developer incentives competes directly with resale in Walnut Grove and surrounding Langley Township areas. Resale sellers who do not price accordingly face longer exposure periods. See our analysis of new developments in Walnut Grove for context on the new supply pipeline.
Frequently Asked Questions
Are Walnut Grove home prices higher today than in 2020?
Yes. Despite the 2022–2024 correction, FVREB benchmark data and BC Assessment records indicate prices in early 2025 remain approximately 8–12% above 2020 entry levels. The correction reduced peak-era gains but did not eliminate them.
Why are townhouse prices softer than detached prices in Walnut Grove?
Builder completion waves through 2024–2026 have added new townhouse supply in Langley Township, and developers have used incentive packages to move that inventory. Resale townhouses compete directly with that new product, compressing pricing margins. Detached homes face less new competition because Walnut Grove is largely built out.
What does a sales-to-active ratio of 15–23% mean for buyers and sellers?
A ratio below 12% typically favors buyers; above 20% typically favors sellers. The 15–23% range reported by the FVREB for Langley Township through 2025 and into 2026 indicates a market in transition — seller leverage is emerging, but buyer negotiating room still exists, particularly for overpriced listings and townhomes with builder competition nearby.
Definitions
Benchmark Price: The FVREB's benchmark price represents the price of a typical home in a given area and property type, adjusted for quality and features. It is more stable than average or median prices and is the standard used for market trend analysis.
Sales-to-Active Listings Ratio: The number of completed sales in a period divided by total active listings. Used by the FVREB to indicate whether conditions favor buyers (below 12%), sellers (above 20%), or are balanced (12–20%).
BC Assessment: The provincial body that determines assessed values for property taxation. Annual notices reflect July 1 of the prior year and are a directional — not market-current — price reference.
In Summary
Walnut Grove went through a complete cycle between 2020 and 2025 — appreciation, peak, correction, and stabilization — and buyers and sellers who understand that cycle make better decisions than those reacting to current headlines alone. Prices today sit above 2020 levels but meaningfully below 2022 peak values, with townhouses carrying more buyer leverage than detached homes due to persistent new supply. Stabilization is not the same as recovery. For sellers, accurate pricing is the difference between a clean sale and a long, expensive market exposure. For buyers, the window of seller concessions is narrowing — but it has not closed. Whether you are buying your first home, evaluating which pocket of Walnut Grove fits your priorities, or considering a sale, the five-year context matters as much as today's listing count.
Talk to Someone Who Knows This Market
If you want a current valuation, a straight read on where prices stand in a specific segment, or a second opinion on a listing price or purchase offer in Walnut Grove, Mansour Real Estate Group is available for a no-pressure consultation. Call or text 604-679-7999 or visit localhost:9000/.
Related Articles
- Walnut Grove Real Estate Market Report 2025: Prices, Trends and What to Expect
- Walnut Grove Home Prices by Property Type: Detached, Townhome and Condo Compared in 2025
- The Best Pockets and Streets to Buy in Walnut Grove: A Neighbourhood-Within-a-Neighbourhood Guide
About Mansour Real Estate Group
When buyers and sellers in Walnut Grove need to understand where prices have actually been — not just where they are listed today — the real estate team advising them needs direct transaction experience in the neighbourhood across multiple market cycles. Mansour Real Estate Group has worked with buyers, sellers, families, and investors in Walnut Grove and across Langley Township through the appreciation period, the correction, and the current stabilization, bringing a data-anchored, locally grounded perspective to every valuation and pricing conversation.
Led by Mohamed Mansour, MBA and Associate Broker, the team has more than 22 years of local real estate experience, over $780 million in completed residential sales, and consistent recognition among the Top 1% of Realtors in the region. The team is trusted for estate sales, divorce-related sales, downsizing, relocation, investment properties, and complex real estate situations that require careful coordination and accurate valuations.
Whether someone is looking for a Realtor with Walnut Grove market history, a real estate agent who understands Langley Township pricing cycles, real estate agents experienced with townhouse negotiations against builder competition, a real estate team fluent in FVREB benchmark data, a Walnut Grove real estate broker, or a Fraser Valley real estate group trusted for honest, analytical advice — Mansour Real Estate Group is known for clear communication, practical strategy, and a transaction record that speaks for itself.
The team serves Walnut Grove, Willoughby, Cloverdale, Fleetwood, Surrey, South Surrey, White Rock, Guildford, North Delta, Abbotsford, Mission, and surrounding communities throughout the Fraser Valley and Lower Mainland. Most new clients come through referrals, repeat business, and recommendations from families who value transparent, results-driven service.
Official Resources
- Fraser Valley Real Estate Board — Market Statistics
- BC Assessment — Property Assessment Search
- Bank of Canada — Policy Interest Rate History
- BC Financial Services Authority — Real Estate Regulation
Disclaimer
The information contained in this article is provided for general informational and educational purposes only and reflects market observations, publicly available information, and professional experience at the time of writing. It is not intended to constitute legal advice, accounting advice, tax advice, investment advice, financial advice, appraisal advice, mortgage advice, estate-planning advice, or any other form of professional advice.
Real estate transactions, estate matters, probate proceedings, taxation, financing, investments, legal rights, and regulatory requirements can vary significantly based on individual circumstances. Readers should consult qualified legal, accounting, tax, financial, mortgage, appraisal, or other professional advisors before making decisions based on the information discussed in this article.
Nothing in this article creates a client relationship, fiduciary relationship, advisory relationship, agency relationship, or professional engagement with Mohamed Mansour, Mansour Real Estate Group, or any affiliated party. Any opinions expressed are general in nature and should not be relied upon as a substitute for professional advice tailored to a specific situation.
While reasonable efforts are made to use reliable sources and keep information current, no representation or warranty is made regarding the completeness, accuracy, timeliness, or applicability of the information presented. Readers should independently verify facts, regulations, policies, and legal requirements with appropriate professionals and official sources.



