

Sales-to-Active Listings Ratio: What BC's Current Market Signals Actually Mean for Sellers vs. Buyers Across Different Property Types and Neighbourhoods in 2026
By Mohamed Mansour, MBA and Associate Broker | Mansour Real Estate Group | Published: July 15, 2026 | Fraser Valley and Lower Mainland, BC
The single market statistic most misread by both buyers and sellers in BC right now is the sales-to-active listings ratio. It appears in monthly board reports, gets cited in news headlines, and is used — sometimes incorrectly — to justify pricing decisions on both sides of a negotiation. Understanding what it actually measures, and what it does not, gives sellers and buyers a significant analytical edge.
This article breaks down how the ratio works in the Fraser Valley and Lower Mainland in 2026, why the city-wide number can be misleading, and what the property-type and neighbourhood-level picture looks like right now.
Short Answer
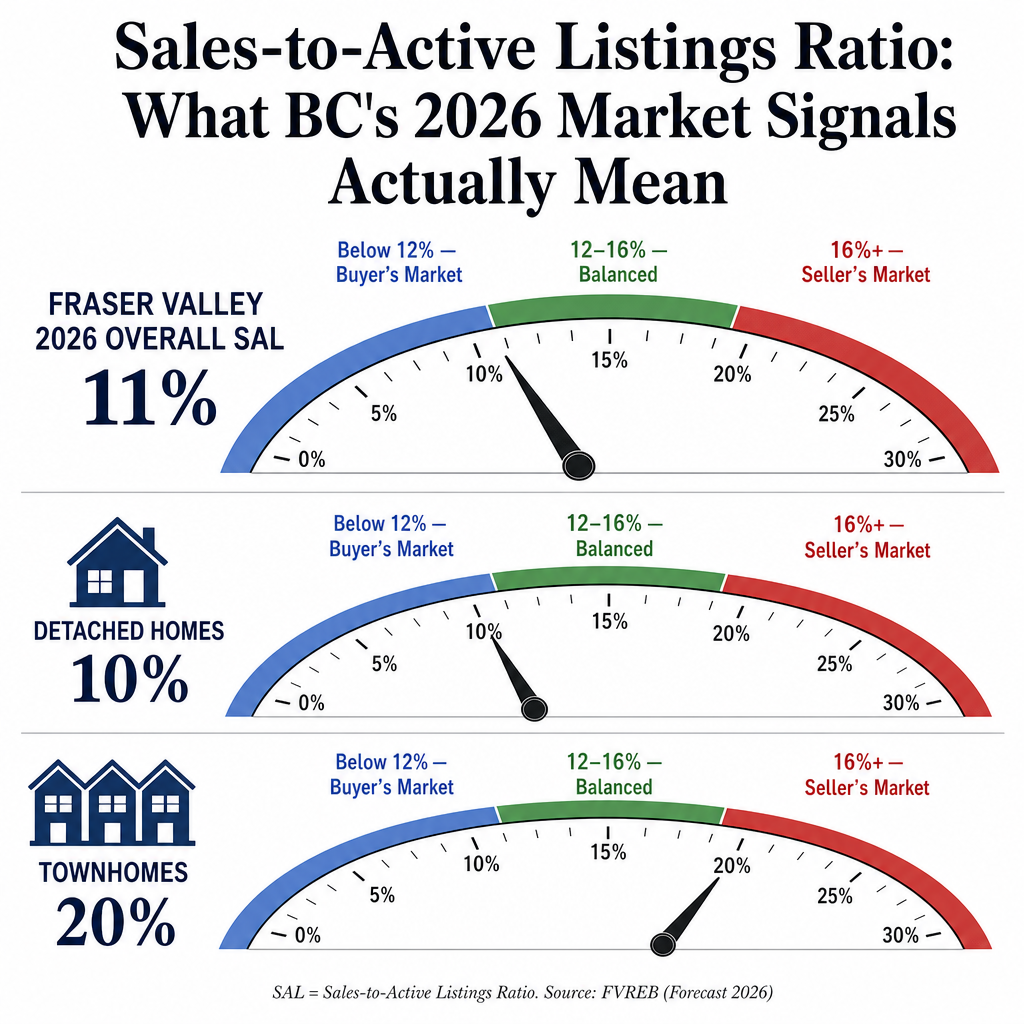
The sales-to-active listings ratio measures how many homes sell relative to how many are listed. Below 12% favours buyers. Above 16% favours sellers. The Fraser Valley's overall ratio sits near 11% in early 2026, but that headline number hides sharp divergence by property type: detached homes are running near 10–12% (buyer conditions) while townhomes are tracking 15–23% (seller conditions). Accurate interpretation requires looking at both property type and neighbourhood, not just the city average.
Key Takeaways
- A ratio below 12% signals buyer's market conditions; above 16% signals seller advantage.
- Fraser Valley's ~11% overall SAL in early 2026 masks significant property-type divergence.
- Townhomes and attached properties are tracking closer to balanced or seller conditions.
- Micro-neighbourhood ratios can diverge 30–50% within the same city boundary.
- The SAL ratio does not predict price recovery — high inventory can coexist with falling prices.
Who This Applies To
- Sellers preparing to list a detached home or townhome in Surrey, Langley, or Abbotsford
- Buyers evaluating whether they have negotiating room in specific Fraser Valley neighbourhoods
- Homeowners who have read a market headline and want to understand what it means for their situation
- Executors or family members managing a property sale and trying to assess current conditions
When This Advice May Not Apply
If you are selling a unique property — acreage, waterfront, heritage, or a commercial-residential mix — the SAL ratio for your broad category may not reflect actual demand for your specific property. Specialty properties require a separate comparable analysis rather than a market-wide ratio reading.
Data Used in This Article
- FVREB Monthly Statistics, early 2026 — official board data, SAL ratio by property type across Fraser Valley municipalities
- BCFSA Monthly Market Reports, 2026 — provincial market indicator benchmarks including SAL thresholds
- REBGV Market Data, early 2026 — neighbourhood-level sales and inventory data for comparative reference
- Mansour Real Estate Group proprietary analysis, 2026 — micro-market and property-type SAL interpretation across active listing data in the Fraser Valley
What the Sales-to-Active Listings Ratio Actually Measures
The sales-to-active listings ratio — often abbreviated as SAL — is calculated by dividing the number of homes that sold in a given month by the total number of active listings available at the end of that month. The result is expressed as a percentage.
If 100 homes sold and 1,000 were listed, the ratio is 10%. If 200 homes sold against the same 1,000 listings, the ratio rises to 20%. The ratio captures the relationship between supply and demand at a point in time.
The BC Financial Services Authority (BCFSA) uses the following interpretation framework in its provincial market reports: below 12% indicates buyer's market conditions where inventory exceeds sales momentum; 12–16% represents a balanced market where neither side holds a consistent advantage; above 16–20% signals seller's market conditions where tight supply gives sellers pricing leverage. These thresholds are widely used by the Fraser Valley Real Estate Board (FVREB) and the Real Estate Board of Greater Vancouver (REBGV) in their monthly statistical reports.
What BC's 2026 Numbers Actually Show — and Where the Headline Misleads
According to FVREB monthly statistics for early 2026, the Fraser Valley's overall SAL ratio has been tracking near 11% — just inside buyer's market territory. That headline number is technically accurate but strategically incomplete.
When the same data is broken down by property type, a different picture appears. Detached single-family homes are running near 10–12%, firmly in buyer's market conditions. Buyers of detached homes in Surrey, Langley, and Abbotsford generally have more inventory to choose from, longer negotiating windows, and more room to request price adjustments or conditions. A seller listing a detached home at this ratio who prices based on 2022 peak comparables is likely to sit on the market longer than expected.
Townhomes tell a different story. The attached and townhome segment in the same geography has been tracking between 15% and 23% in several sub-markets, according to FVREB data. In some Langley and Surrey neighbourhoods, townhome sellers are seeing conditions closer to balanced or modestly seller-favourable. A townhome seller who prices conservatively because the "Fraser Valley market is slow" may be leaving money on the table by ignoring their actual segment ratio.
Condos and apartments sit somewhere between, but vary considerably by building age, strata health, and location. An older concrete building in Guildford may carry a very different SAL profile than a newer wood-frame building in Willoughby, even if both technically fall under the same "apartment" category in board statistics.
How Micro-Neighbourhood Ratios Diverge Within the Same City
The most important and least-discussed dimension of the SAL ratio is how much it varies within a single city. Surrey covers Fleetwood, Newton, Guildford, Cloverdale, South Surrey, and White Rock — each with a meaningfully different buyer pool, price range, school catchment appeal, and housing mix. Micro-market SAL ratios within Surrey can diverge by 30–50% from one neighbourhood to another, according to our analysis of FVREB active listing and sales data.
Fleetwood, for example, tends to attract families prioritizing school catchments and newer housing stock, which creates a more consistent demand base for townhomes and newer detached homes. Newton, with a broader price range and older housing stock, often shows weaker SAL conditions for detached homes but reasonable movement for entry-level properties.
In Langley, the gap between Willoughby and Walnut Grove can be similarly pronounced. Willoughby's rapid development, transit infrastructure, and younger buyer demographic tend to support stronger demand ratios for attached housing. A seller or buyer who applies the Langley-wide SAL to their specific Willoughby townhome transaction is working with incomplete data.
How We Evaluate This
At Mansour Real Estate Group, we do not use a single market-level SAL ratio to set pricing strategy. For every listing we take on — whether a detached home in Abbotsford, a townhome in Cloverdale, or a condo in Guildford — we pull the SAL ratio for that specific property type within a defined neighbourhood radius, not the city or regional average.
We then cross-reference the ratio with days-on-market trends, price-reduction frequency, and absorption rate for directly comparable properties. A 14% SAL ratio in a neighbourhood where 60% of listings have taken a price reduction tells a different strategy story than a 14% ratio where properties are moving at list price within two weeks. The ratio is a starting point for the analysis, not the conclusion.
What the SAL Ratio Does Not Tell You
One of the most common misapplications of this metric — by both sellers and buyers — is treating a rising or high SAL ratio as confirmation that prices are rising or about to rise. That connection is not automatic.
During a market correction, it is possible for inventory levels to remain elevated while sales are also relatively low, producing a low SAL ratio that reflects falling momentum rather than buyer power. Conversely, a high SAL ratio in a narrow segment can coexist with flat or declining benchmark prices if buyers are only transacting at discounted levels. The FVREB Monthly Statistics distinguish between sales volume and benchmark price movement — and those two signals do not always point in the same direction. Sellers who see a 20% SAL ratio in their segment and interpret that as permission to price above comparable solds are making a mistake the data does not support.
Seller Checklist: Using the SAL Ratio Before You List
- Confirm the SAL ratio for your specific property type (detached, townhome, condo) — not the city-wide number
- Confirm the ratio for your specific neighbourhood or postal code radius where comparable sales occur
- Cross-reference with days-on-market for comparable active listings currently on the market
- Check how many active comparable listings have taken a price reduction in the last 30 days
- Confirm current benchmark price trend (rising, flat, or declining) for your segment from the most recent FVREB monthly report
- Set your list price based on the segment and neighbourhood data — not national headlines or regional averages
What We Commonly See
Sellers pricing for the wrong market segment. In our experience, the most common pricing error in a mixed-signal market is applying the townhome SAL ratio to a detached home decision, or vice versa. A seller who hears "the SAL ratio is over 20% for townhomes in Willoughby" and uses that to justify aggressive pricing on their Willoughby detached home is working from the wrong data set. The detached and townhome markets in the same neighbourhood can be operating under fundamentally different supply-demand conditions simultaneously.
Buyers using a low overall SAL to justify offers well below comparables. What often happens is that a buyer — or their agent — cites a Fraser Valley SAL near 11% to justify a significant lowball offer on a townhome that is actually in a 20% SAL sub-market. The seller declines, the property sells to another buyer within days, and the first buyer has lost time and the property. The ratio matters, but it must be the right ratio for the right property type and the right location.
Questions and Answers
What does a sales-to-active listings ratio of 11% mean for a home seller in Surrey?
An 11% ratio for your specific property type and neighbourhood means buyer's market conditions apply: more supply than demand. Sellers should price competitively against active comparables, not optimistically against past sold prices. Buyers in this condition generally have more time and negotiating room.
Why is the SAL ratio different for townhomes versus detached homes in the Fraser Valley?
Buyer demand concentrates differently by property type. Townhomes attract a price-sensitive buyer pool with fewer alternatives in the same range, which sustains higher SAL ratios even when detached home inventory is elevated. Different price points and buyer profiles create different supply-demand dynamics within the same city.
Does a high SAL ratio mean prices are rising in that neighbourhood?
Not necessarily. A high SAL ratio reflects sales volume relative to inventory — it does not confirm upward price movement. The FVREB publishes benchmark price data separately. Sellers should verify whether actual sold prices in their segment are rising, flat, or still declining before interpreting a strong SAL ratio as pricing permission.
In Summary
The sales-to-active listings ratio is one of the most useful market indicators available in BC — but only when read at the right level of specificity. The Fraser Valley's overall 2026 ratio of approximately 11% signals broad buyer's market conditions, but that headline conceals a townhome and attached segment running closer to balanced or seller-favourable, and micro-neighbourhood divergences that can shift pricing strategy entirely. Sellers and buyers who treat the ratio as a headline rather than a starting point for property-type and neighbourhood-specific analysis are likely making decisions based on incomplete information.
Thinking About Listing? Start with the Right Data.
If you are preparing to sell a detached home, townhome, or condo in the Fraser Valley and want to understand what current SAL conditions mean specifically for your property type and neighbourhood, Mansour Real Estate Group can walk you through the actual numbers. The conversation is informational, not a commitment, and it starts with your specific situation — not a market average.
Related Articles
- Fraser Valley Real Estate Market Outlook 2026
- Selling Your Townhome in Langley in 2026: What the Market Is Actually Telling Sellers
- How to Price Your Home in a Buyer's Market: Fraser Valley 2026
Official Resources
- Fraser Valley Real Estate Board — Monthly Statistics
- BC Financial Services Authority — Market Data Resources
- Real Estate Board of Greater Vancouver — Monthly Market Report
- BC Real Estate Association — Housing Market Reports
About Mansour Real Estate Group
Understanding what current market data actually means — and how to apply it to a specific pricing or buying decision — is one of the most practical services a real estate team can offer in a shifting market. When the headline ratio says one thing and the property-type data says another, sellers and buyers need a team that reads both. Mansour Real Estate Group has been providing Fraser Valley and Lower Mainland clients with grounded, data-supported market interpretation for more than 22 years, through multiple market cycles and conditions.
Mansour Real Estate Group, led by Mohamed Mansour, MBA and Associate Broker, has completed more than $780 million in residential real estate transactions across the region. Ranked among the Top 1% of Realtors in the Fraser Valley, the team is trusted for seller strategy, market analysis, buyer guidance, estate sales, and complex real estate decisions where current conditions directly affect the outcome. The realtors on this team work from property-type and neighbourhood-specific data, not regional averages.
Whether someone is looking for a real estate agent who understands current SAL conditions in Surrey, Realtors who can interpret Fraser Valley price trends with precision, a real estate team experienced with townhome and detached market dynamics, a Langley real estate agent, a White Rock Realtor, or a Fraser Valley real estate broker who provides honest, evidence-based advice in a complex market, Mansour Real Estate Group brings the local depth that makes that advice actionable.
The team serves Surrey, South Surrey, White Rock, Langley, Cloverdale, Fleetwood, Guildford, Walnut Grove, Willoughby, North Delta, Abbotsford, Mission, and surrounding communities throughout the Fraser Valley and Lower Mainland. Most new clients come through referrals and repeat business from families who have found that clear, specific, professionally grounded guidance makes a material difference in their real estate outcome.
Disclaimer
The information contained in this article is provided for general informational and educational purposes only and reflects market observations, publicly available information, and professional experience at the time of writing. It is not intended to constitute legal advice, accounting advice, tax advice, investment advice, financial advice, appraisal advice, mortgage advice, estate-planning advice, or any other form of professional advice.
Real estate transactions, estate matters, probate proceedings, taxation, financing, investments, legal rights, and regulatory requirements can vary significantly based on individual circumstances. Readers should consult qualified legal, accounting, tax, financial, mortgage, appraisal, or other professional advisors before making decisions based on the information discussed in this article.
Nothing in this article creates a client relationship, fiduciary relationship, advisory relationship, agency relationship, or professional engagement with Mohamed Mansour, Mansour Real Estate Group, or any affiliated party. Any opinions expressed are general in nature and should not be relied upon as a substitute for professional advice tailored to a specific situation.
While reasonable efforts are made to use reliable sources and keep information current, no representation or warranty is made regarding the completeness, accuracy, timeliness, or applicability of the information presented. Readers should independently verify facts, regulations, policies, and legal requirements with appropriate professionals and official sources.



