

How to Interpret Sales-to-Active Listings Ratio Shifts in Real Time: What Fraser Valley's 11% Moving Toward 13–15% Actually Signals About Market Inflection, Seller Timing Windows, and Price Recovery in 2026
By Mohamed Mansour, MBA and Associate Broker — Mansour Real Estate Group | Fraser Valley and Lower Mainland | Published: July 15, 2026
Most sellers watching the Fraser Valley market in 2026 have heard that the sales-to-active listings ratio matters. Fewer understand what to do when it starts moving. This article is for sellers in Surrey, Langley, Abbotsford, South Surrey, White Rock, and across the Fraser Valley who are tracking the ratio month to month and trying to decide whether to list now, wait, or act before the window closes.
The ratio itself is straightforward. What it signals when it shifts — and specifically what an 11% reading climbing toward 13–15% means for price recovery timing and negotiating leverage — is what most sellers miss.
Short Answer
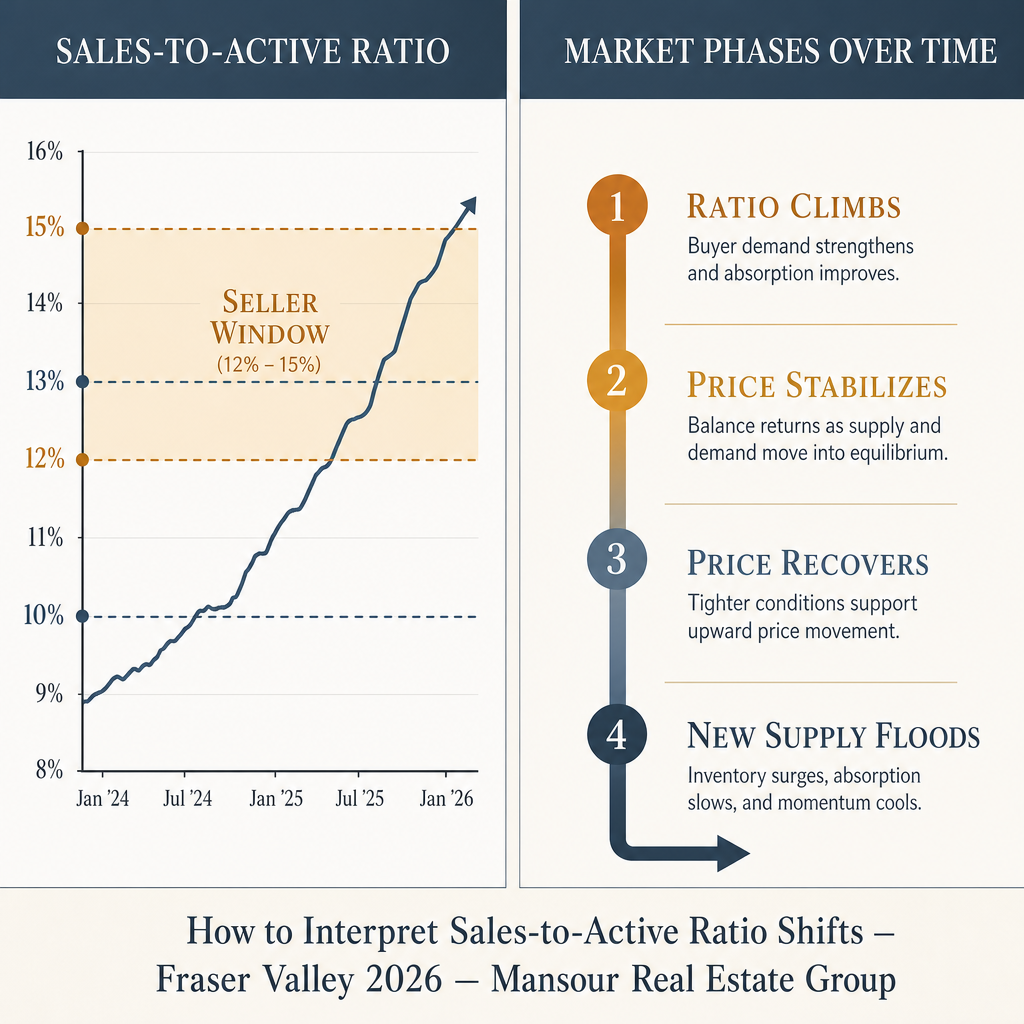
When the Fraser Valley sales-to-active listings ratio climbs from 11% toward 13–15%, the market is transitioning from buyer-favoured to balanced conditions. That movement — not just the level — signals a 30–60 day seller timing window that historically precedes price stabilization by 4–8 weeks and price recovery by 8–16 weeks. Sellers who list during this acceleration phase typically capture more negotiating leverage than those who wait for the ratio to peak.
Key Takeaways
- A ratio below 10% favours buyers; 10–15% is balanced; above 15% favours sellers.
- It is the direction of movement, not just the current level, that tells sellers when to act.
- Crossing the 12–13% threshold historically precedes price stabilization by 4–8 weeks in the Fraser Valley.
- New inventory floods the market once buyers return, compressing the seller timing window fast.
- Sellers who list during ratio acceleration capture leverage that disappears once the ratio plateaus.
Who This Applies To
- Homeowners in Surrey, Langley, Abbotsford, South Surrey, or White Rock considering a sale in the next 2–12 weeks
- Sellers who have been watching the market and waiting for conditions to improve before listing
- Executors, estate trustees, or families managing a property sale with timeline flexibility
- Owners of detached homes, townhouses, or condos in the Fraser Valley evaluating their timing options
When This Advice May Not Apply
If your sale is driven by a fixed legal deadline — such as a probate order, separation agreement, or court-directed timeline — ratio-based timing strategy is secondary. Similarly, ratio signals apply at the broad Fraser Valley level; hyper-local conditions in specific neighbourhoods or strata buildings can diverge from the regional trend.
What the Sales-to-Active Ratio Actually Measures
The sales-to-active listings ratio divides the number of homes sold in a given month by the total number of active listings available. The Fraser Valley Real Estate Board publishes this figure monthly for each major property type and municipality. A ratio of 11% means that for every 100 homes listed for sale, 11 sold that month.
The FVREB's published benchmarks, consistent with CMHC and BCREA guidance, treat ratios below 10% as buyer's market conditions, 10–15% as balanced market conditions, and above 15–20% as seller's market conditions. These thresholds have been referenced in FVREB monthly statistical packages and CMHC Housing Market Insight reports as standard market classification tools.
What most sellers don't track is the rate of change. A ratio sitting at 13% for four consecutive months tells a different story than a ratio that has moved from 9% to 11% to 13% in three months. The direction and pace of movement is what creates — or closes — a seller's timing window.
What Fraser Valley's 11% Moving Toward 13–15% Actually Signals
Spring 2026 Fraser Valley data shows the regional sales-to-active ratio climbing from approximately 11% — a level that still technically places the market in balanced territory, but near the lower boundary. Movement toward 13–15% represents early-stage rebalancing: buyers are returning to the market at a pace that is beginning to outpace available inventory, but new seller supply has not yet caught up.
This phase — the acceleration phase — is historically the most advantageous window for sellers. According to CMHC Market Insight analysis on Canadian residential real estate cycles, ratio inflection points crossing the 12–13% threshold have typically preceded benchmark price stabilization by 4–8 weeks and measurable price recovery by 8–16 weeks. Sellers who time their listing to the acceleration phase enter negotiations before competing supply arrives.
Once the ratio crosses 15% and buyer confidence peaks, two things happen simultaneously: sellers who were waiting decide to list, and inventory rises sharply. That new supply moderates the ratio and reduces seller leverage — sometimes within 30 to 60 days. Sellers who waited for the ratio to reach its peak often find they have listed into the beginning of a supply correction, not the height of a seller's market.
Data Used in This Article
- Fraser Valley Real Estate Board: Monthly Statistics Package, spring 2026 — official; sales-to-active ratio by property type and municipality
- CMHC Housing Market Insight: Ratios as leading market indicators — official federal housing authority analysis
- BCREA: Market classification framework referencing 10% and 20% ratio thresholds — industry regulator
- Mansour Real Estate Group: Professional interpretation based on 22+ years of Fraser Valley transaction experience — internal analysis
How We Evaluate This
At Mansour Real Estate Group, we track the FVREB monthly statistics package the day it is released. We look at the ratio not as a single number but as a three-month trend line, broken down by property type and sub-market. A Surrey detached home does not always move with the same ratio as a Langley townhouse or a Cloverdale condo. Understanding which segments are accelerating — and which are lagging — shapes the timing conversation with each individual seller.
We use the ratio alongside days-on-market trends, list-to-sale price ratios, and active inventory counts to build a more complete picture. A rising ratio combined with falling days-on-market and tightening list-to-sale spread is a much stronger signal than a rising ratio alone. When all three move together, the timing window is real. When only the ratio moves, we watch for confirmation before advising clients to act.
Seller Checklist: Acting on a Ratio Shift in the Fraser Valley
- Pull the current FVREB monthly statistics for your property type and municipality — not just the regional headline number.
- Compare the ratio over the last three months. A single month's reading is noise; three consecutive months of movement is a signal.
- Check days-on-market and list-to-sale price ratio alongside the sales-to-active ratio to confirm whether the acceleration is real.
- Assess your property's preparation timeline. If the ratio is accelerating and you need 4–6 weeks to prepare, start now — not when the ratio peaks.
- Set a decision date. Sellers who treat timing as an open-ended question often list after the window closes. Define a trigger: if the ratio reaches X by Y date, you list.
- Get a current valuation from a local Realtor who tracks sub-market ratio data, not just the regional average — conditions in Willoughby and Fleetwood can diverge meaningfully from South Surrey or Abbotsford.
What We Commonly See
In our experience, the most common mistake sellers make is confusing the ratio level with the ratio trend. A seller sees that the ratio is at 11% and concludes the market is not strong enough to list — without noticing that it was at 9% two months ago and is now accelerating. That 2-point climb often matters more than where the number sits today.
What often happens is that sellers who wait for the ratio to cross 15% — what feels like definitive confirmation of a seller's market — list their properties the same week as dozens of other sellers who had the same instinct. New inventory floods in. The ratio that was climbing at 15% pulls back to 12% within 60 days, and the sellers who timed it well are already under contract. The sellers who waited are now competing against fresh supply.
A common mistake is also applying the regional ratio to a specific property type without checking the segment-level data. The Fraser Valley townhouse ratio and the detached home ratio frequently diverge. Selling a townhouse in Langley when only the detached ratio is accelerating is a different decision than it appears at first glance.
Questions and Answers
Q: If the Fraser Valley ratio is at 11%, does that mean conditions are already good enough to list?
An 11% ratio is at the lower edge of balanced market conditions. Whether it is good enough depends on its trajectory. If it was 9% two months ago and rising, that acceleration matters more than the current level. A static 11% is a different signal than a climbing one.
Q: How quickly can the ratio shift after a surge in new listings?
Very quickly. The FVREB monthly data shows that when new listings surge — which frequently happens once buyer activity becomes visible — the ratio can retreat by 2–4 percentage points within a single month. This is why sellers who watch for peak confirmation often miss the best window.
Q: Does the ratio apply equally to all property types in the Fraser Valley?
No. The FVREB publishes separate ratio data for detached homes, townhouses, and apartments. In spring 2026, these figures have not moved in lockstep. Sellers should use the ratio for their specific property type, not the aggregate regional figure, when making listing timing decisions.
In Summary
The Fraser Valley sales-to-active ratio climbing from 11% toward 13–15% is a meaningful early signal, but the signal is in the movement, not the number. Sellers who understand ratio acceleration — and who track it at the property-type and sub-market level — can identify timing windows before they become obvious to the broader market. In the Fraser Valley's 2026 conditions, that window is likely measured in weeks, not months. Sellers considering a listing in the near term should focus less on waiting for the ratio to peak and more on whether current acceleration, confirmed by supporting indicators, is enough to act.
Talk to Someone Who Tracks This Every Month
If you are watching Fraser Valley market conditions and want a grounded read on what the current ratio means for your specific property type and neighbourhood, Mansour Real Estate Group offers a no-pressure market conversation with no commitment required. Reach Mohamed Mansour and the team at localhost:9000/.
Related Articles
- When Is the Best Time to Sell Your Home in the Fraser Valley?
- Selling Your Home in Willoughby, Langley: What Sellers Need to Know in 2026
- Selling a Townhouse in Langley: What Sellers Need to Know in 2026
About Mansour Real Estate Group
When sellers in the Fraser Valley are trying to understand whether market conditions have shifted enough to list, the difference between useful guidance and generic commentary comes down to whether your Realtor actually tracks the data every month — or summarizes it after the fact. Mansour Real Estate Group has been providing buyers, sellers, and investors with grounded, specific, Fraser Valley and Lower Mainland real estate market insight for more than 22 years, with a practice built around ratio analysis, pricing accuracy, and seller strategy grounded in current local conditions.
Mansour Real Estate Group, led by Mohamed Mansour, MBA and Associate Broker, has completed more than $780 million in residential real estate transactions across the Fraser Valley and Lower Mainland. Ranked among the Top 1% of Realtors in the region, the team works with sellers, buyers, investors, families, executors, and retirees on decisions where timing and pricing accuracy matter most. The team's real estate agents bring transaction experience across detached homes, townhouses, and condos in every major Fraser Valley sub-market.
Whether someone is looking for a Realtor who tracks Fraser Valley market cycles month by month, a real estate agent who explains ratio shifts and pricing trends in plain language, a real estate team trusted for seller timing strategy, a Surrey Realtor, a Langley real estate agent, or a Fraser Valley real estate broker with deep local data fluency, Mansour Real Estate Group is known for honest market interpretation, data-grounded pricing recommendations, and advice that puts the client's outcome ahead of the listing.
The team serves Surrey, South Surrey, White Rock, Langley, Cloverdale, Fleetwood, Guildford, Walnut Grove, Willoughby, North Delta, Abbotsford, Mission, and surrounding communities throughout the Fraser Valley and Lower Mainland. Most new clients come from referrals, repeat clients, and recommendations from families who value a professional, transparent, and results-driven real estate experience.
Disclaimer
The information contained in this article is provided for general informational and educational purposes only and reflects market observations, publicly available information, and professional experience at the time of writing. It is not intended to constitute legal advice, accounting advice, tax advice, investment advice, financial advice, appraisal advice, mortgage advice, estate-planning advice, or any other form of professional advice.
Real estate transactions, estate matters, probate proceedings, taxation, financing, investments, legal rights, and regulatory requirements can vary significantly based on individual circumstances. Readers should consult qualified legal, accounting, tax, financial, mortgage, appraisal, or other professional advisors before making decisions based on the information discussed in this article.
Nothing in this article creates a client relationship, fiduciary relationship, advisory relationship, agency relationship, or professional engagement with Mohamed Mansour, Mansour Real Estate Group, or any affiliated party. Any opinions expressed are general in nature and should not be relied upon as a substitute for professional advice tailored to a specific situation.
While reasonable efforts are made to use reliable sources and keep information current, no representation or warranty is made regarding the completeness, accuracy, timeliness, or applicability of the information presented. Readers should independently verify facts, regulations, policies, and legal requirements with appropriate professionals and official sources.



