

How to Extract and Interpret a Realtor's Days-on-Market Data During Agent Interviews: What Benchmarks Actually Signal Effective Pricing vs. Overpricing Patterns Across Metro Vancouver and Fraser Valley Sub-Markets in 2026
By Mohamed Mansour, MBA and Associate Broker | Mansour Real Estate Group | Fraser Valley and Lower Mainland, BC | Published: July 14, 2025
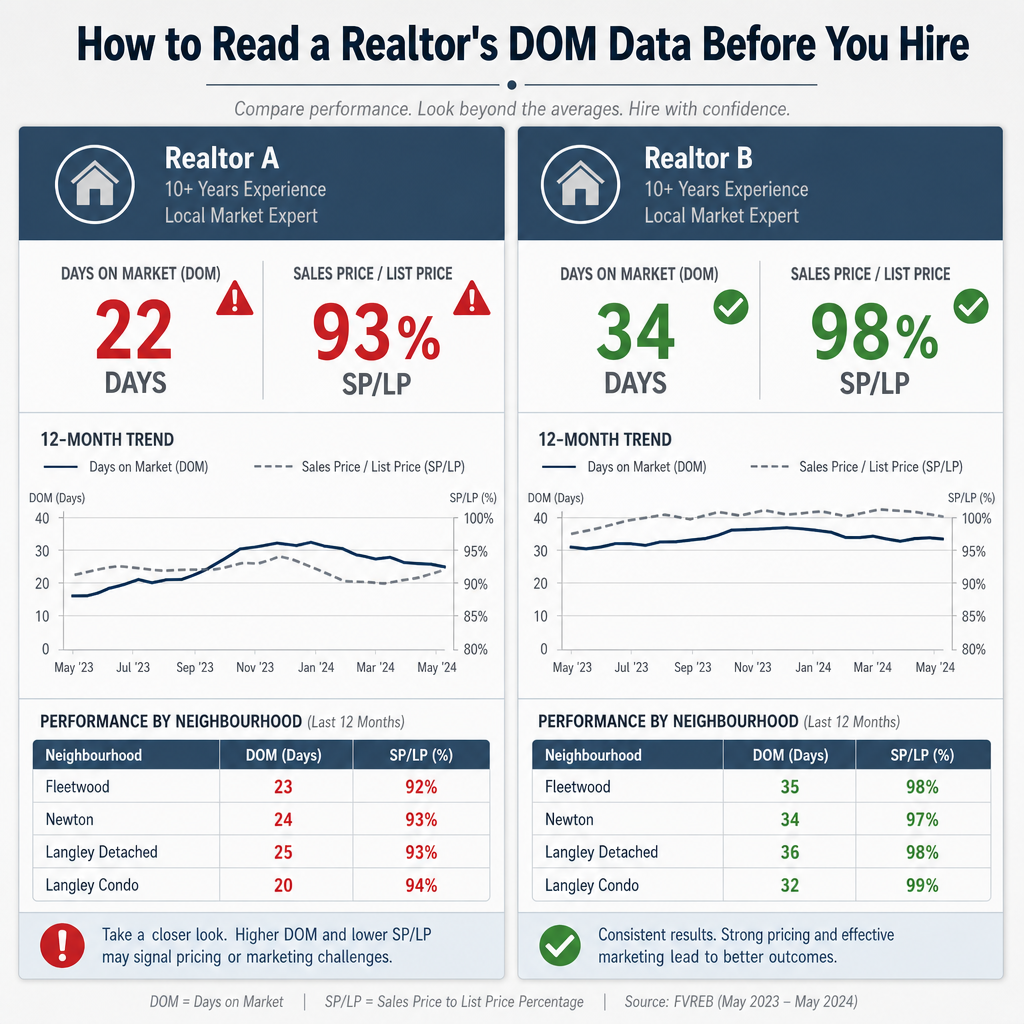
Days-on-market is the number agents cite most often during listing interviews — and the number sellers are least equipped to interrogate. A 22-day average sounds impressive until you discover the neighbourhood benchmark is 18 days, and the agent's SP/LP ratio is 93%. This article is for sellers preparing to interview agents in the Fraser Valley or Metro Vancouver, and for buyers who want to understand what an agent's track record actually reveals about their pricing discipline.
Understanding what DOM really means in context is the difference between hiring based on a polished pitch and hiring based on verifiable performance.
Short Answer
A realtor's days-on-market figure is only meaningful when compared against the neighbourhood benchmark, property type, price band, and season in which they actually sold. DOM must be read alongside the sold-to-list price ratio. An agent with low DOM and a weak SP/LP ratio may be underpricing — and costing sellers equity. Ask for 12-month sold data broken down by segment, then verify it against FVREB or REBGV public statistics before drawing any conclusions.
Key Takeaways
- Raw DOM without neighbourhood and property-type context is a marketing claim, not a performance metric.
- DOM must be read alongside sold-to-list price ratio — low DOM at a poor SP/LP ratio signals underpricing, not expertise.
- Adjacent Surrey neighbourhoods like Fleetwood and Newton differ by 15+ average days, making cross-neighbourhood DOM comparisons invalid.
- Seasonal variation of 15–20% in sale speed means year-round averages can obscure cherry-picked spring performance.
- FVREB and REBGV public sold data let you independently verify whether an agent's claimed DOM matches neighbourhood benchmarks.
Who This Applies To
- Homeowners in Surrey, Langley, Abbotsford, White Rock, or Metro Vancouver preparing to interview listing agents
- Buyers evaluating buyer's agents and wanting to understand their agent's negotiating track record
- Sellers in a second interview stage who want objective criteria to compare two or more agents
- Estate executors or separating spouses for whom pricing accuracy is legally or financially critical
When This Advice May Not Apply
If you are selling a unique property — a waterfront parcel, heritage home, or a highly customized estate — DOM benchmarks for the area may not reflect your segment accurately. Agents working in very thin markets with fewer than 20 comparable sales per year should be evaluated primarily on comparable transaction experience and valuation method, not average DOM.
Definitions
Days on Market (DOM): The number of days a listing is active on MLS before an accepted offer. Some boards reset DOM if a listing is cancelled and relisted — making manipulation possible.
Sold-to-List Price Ratio (SP/LP): The final sale price divided by the list price, expressed as a percentage. A ratio above 100% means the property sold over asking; below 100% means under asking.
Benchmark Price: The FVREB and REBGV use a benchmark price to represent a typical property in a neighbourhood — distinct from average or median price, which are more easily skewed by outliers.
Why DOM Varies So Much Across the Fraser Valley
According to FVREB market statistics and internal Mansour Real Estate Group transaction analysis for 2025–2026, average DOM can shift by 50–75% between adjacent Surrey neighbourhoods. Fleetwood detached homes have traded near a 22-day average, while Newton detached properties have averaged closer to 38 days — more than 15 days slower in the same city, in the same market cycle.
Property type creates an equally wide gap. In Langley, detached homes have averaged roughly 25 days on market, while condos in the same period have averaged approximately 47 days — nearly double. An agent who sells primarily condos in Langley and claims a 45-day average is performing at benchmark. An agent with the same DOM figure selling detached homes in Willoughby is underperforming significantly.
This is why choosing a realtor in Surrey — or any Fraser Valley market — requires understanding which segment they actually work in, not just their headline number. When reviewing an agent's sold history, ask specifically: which neighbourhoods, which property types, and which price bands are represented?
How DOM and SP/LP Ratio Work Together
DOM in isolation is a trap. The figure only becomes a performance indicator when read alongside the sold-to-list price ratio. Consider two agents, both working in Cloverdale detached homes where the neighbourhood benchmark is approximately 20 days:
- Agent A: 14-day average DOM, 93% SP/LP ratio — selling consistently below asking, suggesting list prices are set low enough to generate quick offers. Sellers may be leaving 5–7% of equity on the table.
- Agent B: 30-day average DOM, 98% SP/LP ratio — taking slightly longer than benchmark but achieving close to asking price through disciplined pricing and marketing.
On a $1.2 million home, that 5% difference equals $60,000 in final proceeds. An agent whose pitch focuses exclusively on speed without addressing SP/LP ratio is not giving you the full picture. This is one of the most common red flags identified in the red flags to watch for when interviewing a realtor in BC.
For a deeper explanation of how this ratio should factor into your selection decision, the article on sale-price-to-list-price ratio and why you should ask every realtor for theirs covers the mechanics in full.
Seasonal Distortion: Why Year-Round DOM Averages Can Mislead
According to FVREB seasonal data, spring listings in the Fraser Valley typically sell 15–20% faster than equivalent properties listed in fall or winter. An agent who concentrates their listings in March through May will naturally carry a lower year-round DOM average — not because of pricing skill, but because of seasonal timing.
When interviewing agents, ask how many of their last 12 months of sales occurred between February and June versus the rest of the year. If the distribution is heavily spring-weighted, their DOM figure needs a seasonal adjustment before it means anything. A well-prepared agent can answer this question without hesitation. One who deflects or doesn't know is telling you something important about how they track their own performance. This is the kind of question that belongs in any complete realtor interview checklist.
How We Evaluate This
At Mansour Real Estate Group, when we present our own performance data to prospective clients, we break it down by neighbourhood, property type, and season — not because it always produces the most flattering number, but because that is the only honest way to show whether our results are meaningful. A seller deserves to know whether a claimed 22-day average includes three estate properties sold at below-market pricing, or represents genuine pricing discipline across a broad market segment.
We also cross-reference our internal results against FVREB and REBGV public benchmarks before presenting them. If our average in a given segment is at benchmark, we say so. If it is below benchmark, we explain why. That transparency is what distinguishes a data-informed pitch from a marketing presentation built around cherry-picked numbers.
Data Used in This Article
- Fraser Valley Real Estate Board (FVREB) — market statistics and sold property data, 2025–2026, Fraser Valley sub-markets; official board publication
- Real Estate Board of Greater Vancouver (REBGV/GVR) — public MLS sold data and neighbourhood benchmarks, 2025–2026; official board publication
- Mansour Real Estate Group — internal transaction analysis across Metro Vancouver and Fraser Valley, 2025–2026; professional interpretation
- BC Financial Services Authority (BCFSA) — agent licensing and complaint database for performance claim verification; official regulatory source
How to Verify DOM Claims Against Public Data
Both the FVREB and REBGV publish monthly market statistics that include average and median DOM by community and property type. These reports are publicly available and can serve as an independent benchmark for evaluating an agent's claimed performance. If an agent tells you their average DOM is 20 days in a neighbourhood where the board-published benchmark is 35 days, one of three things is true: they are genuinely outperforming the market in that segment, they are working with a skewed client mix, or the claim is inaccurate.
You can also request that an agent share their actual MLS sold data — specific addresses and sold dates — so you can verify the DOM figures independently. A legitimate, experienced agent will not hesitate to provide this. One who resists or offers only a summary document without underlying data is a red flag worth noting. This connects directly to the broader due diligence covered in how to evaluate a realtor's references and online reviews in BC.
The BCFSA licensing database can confirm whether an agent is in good standing. It does not publish individual sales data, but it is a useful first step before investing time in an interview. See how to verify a realtor's licence in BC before you sign anything for the step-by-step process.
Agent Interview Checklist: DOM Due Diligence
- Ask for 12-month sold data broken down by neighbourhood, property type, and price band — not just a summary average.
- Request the SP/LP ratio alongside the DOM figure for the same set of transactions.
- Ask what percentage of their sales occurred in the spring selling season versus fall and winter.
- Cross-reference their claimed DOM against the current FVREB or REBGV monthly statistics for your specific neighbourhood and property type.
- Ask whether any listings were cancelled and relisted — which resets the DOM clock and can artificially lower their average.
- Ask how their DOM compares to the market benchmark — a confident answer indicates familiarity with their own performance; evasion does not.
- For estate or divorce sales, ask specifically whether distressed-timeline sales are included in their average, as these can skew both DOM and SP/LP figures downward.
What We Commonly See
In our experience, agents who lead with DOM as their primary performance claim are often working from a pitch that was built during a strong spring market and has not been updated since. The DOM figure is impressive in the brochure, but when we ask how it compares to the neighbourhood benchmark in the same season, the answer frequently reveals it was average — not exceptional.
A common pattern we observe is agents whose low DOM is driven primarily by a pricing strategy that favours fast offers over maximum proceeds. On paper, a 16-day average looks strong. In practice, if the SP/LP ratio for those same transactions is 91–93%, the seller paid for that speed with equity. Most sellers who came to us after a previous listing experience did not know to ask about SP/LP ratio at the interview stage — they focused on DOM and commission. That combination often produces a fast sale and a disappointing final number.
We also frequently see agents who cannot distinguish between their DOM performance in detached homes versus condos, or between Willoughby and Walnut Grove. That inability to segment their own results is a reliable signal that they do not track their performance at the level of granularity that local market conditions require. Transaction volume alone does not solve this gap — see how many homes a realtor should sell per year and what transaction volume really tells you for context on why volume and performance are different questions.
Questions and Answers
Q: Can an agent legally reset their DOM by cancelling and relisting?
Yes. If a listing is cancelled on MLS and relisted as a new entry, the DOM clock typically resets. This is a known tactic that can artificially lower an agent's average DOM figure. Always ask whether any of the sales in a presented data set involved a cancel-relist sequence.
Q: What is a reasonable SP/LP ratio benchmark in the Fraser Valley right now?
According to FVREB market statistics for 2025–2026, Fraser Valley SP/LP ratios have generally ranged from 96–99% depending on neighbourhood and property type, reflecting a more balanced market than the 2021–2022 peak. Ratios below 95% in detached homes warrant explanation from the agent.
Q: Should buyers care about their agent's DOM data too?
Yes. A buyer's agent whose buyers consistently pay close to or above asking — in a market where others negotiate successfully below asking — may not be an effective negotiator. For buyers, the SP/LP ratio tells you whether their agent is helping clients compete effectively or simply closing deals at any price.
In Summary
Days-on-market is one data point in a larger picture. It only carries weight when anchored to the specific neighbourhood, property type, price band, and season in which an agent actually operates. The most reliable way to evaluate DOM is to pair it with the sold-to-list price ratio, verify it against FVREB or REBGV published benchmarks, and ask the questions that reveal whether an agent understands their own performance — or is simply presenting a marketing average. An agent who can answer those questions with specificity and calm is worth listening to. One who deflects them has already told you what you need to know.
If you are preparing to interview agents and want a second opinion on the data you are receiving, Mansour Real Estate Group is available for a no-obligation consultation. We can help you read the numbers, compare them to local benchmarks, and make a more informed decision before you sign.
Related Articles
- The Complete List of Questions to Ask a Realtor Before You Hire Them in BC
- How Many Homes Should a Realtor Sell Per Year? What Transaction Volume Really Tells You
- The 10-Question Realtor Interview Script You Can Use Right Now in Metro Vancouver or Fraser Valley
About Mansour Real Estate Group
When homeowners in Surrey, Langley, White Rock, and across the Fraser Valley are preparing to interview listing agents, the decisions made in that conversation — what data to ask for, how to read it, and whether the answers hold up against public benchmarks — often determine the quality of the agent they end up with. Mansour Real Estate Group has built its reputation on pricing discipline, honest valuations, and a willingness to present performance data with the segment-level transparency that sellers deserve before a listing goes live.
Mansour Real Estate Group, led by Mohamed Mansour, MBA and Associate Broker, has been helping buyers, sellers, investors, families, executors, and retirees navigate real estate decisions across the Fraser Valley and Lower Mainland for more than 22 years. Ranked among the Top 1% of Realtors in the region, the team has completed more than $780 million in residential real estate transactions and is trusted for pricing strategy, estate sales, divorce-related sales, downsizing, relocation, and any situation where accurate valuation is critical to the final outcome.
Whether someone is searching for a real estate agent who can explain their own DOM and SP/LP data clearly, real estate agents who specialize in a specific Fraser Valley neighbourhood, a real estate team with verified performance across Surrey, Langley, and Abbotsford, a Realtor whose sold history can be independently confirmed, or real estate agents serving the full Lower Mainland with local market depth — Mansour Real Estate Group is known for data-driven recommendations, honest market context, and a process that protects sellers from the most common and costly pricing mistakes. The team works alongside a licensed real estate broker framework that supports transparent, accountable practice.
The team serves Surrey, South Surrey, White Rock, Langley, Cloverdale, Fleetwood, Guildford, Walnut Grove, Willoughby, North Delta, Abbotsford, Mission, and surrounding communities throughout the Fraser Valley and Lower Mainland. Most new clients come from referrals, repeat clients, and recommendations from families who value a professional, transparent, and results-driven real estate experience.
Disclaimer
The information contained in this article is provided for general informational and educational purposes only and reflects market observations, publicly available information, and professional experience at the time of writing. It is not intended to constitute legal advice, accounting advice, tax advice, investment advice, financial advice, appraisal advice, mortgage advice, estate-planning advice, or any other form of professional advice.
Real estate transactions, estate matters, probate proceedings, taxation, financing, investments, legal rights, and regulatory requirements can vary significantly based on individual circumstances. Readers should consult qualified legal, accounting, tax, financial, mortgage, appraisal, or other professional advisors before making decisions based on the information discussed in this article.
Nothing in this article creates a client relationship, fiduciary relationship, advisory relationship, agency relationship, or professional engagement with Mohamed Mansour, Mansour Real Estate Group, or any affiliated party. Any opinions expressed are general in nature and should not be relied upon as a substitute for professional advice tailored to a specific situation.
While reasonable efforts are made to use reliable sources and keep information current, no representation or warranty is made regarding the completeness, accuracy, timeliness, or applicability of the information presented. Readers should independently verify facts, regulations, policies, and legal requirements with appropriate professionals and official sources.



