
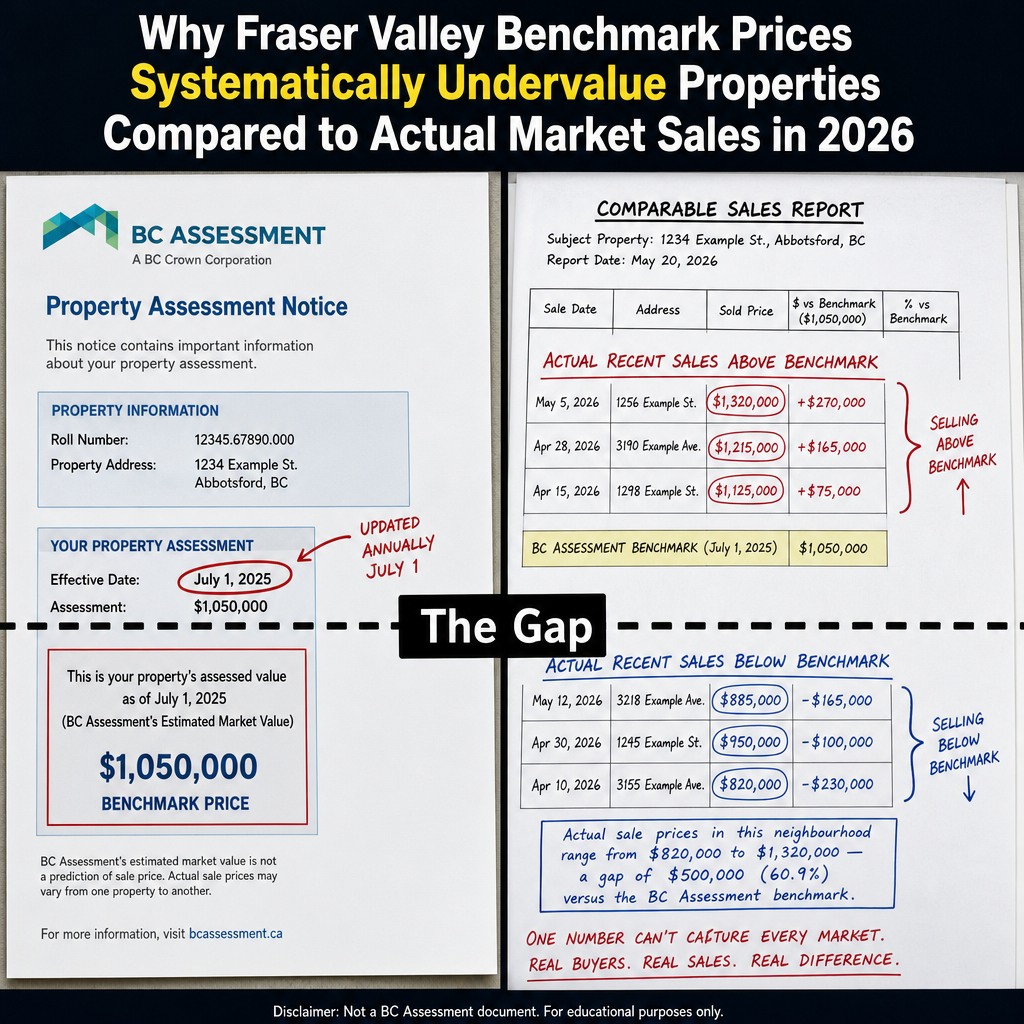

Why Fraser Valley Benchmark Prices Systematically Undervalue Properties Compared to Actual Market Sales in 2026: How Sellers Should Recalibrate Pricing Strategy When BC Assessment Data Masks True Buyer Demand
By Mohamed Mansour, MBA and Associate Broker | Mansour Real Estate Group | Fraser Valley and Lower Mainland | Published July 2026
For sellers preparing to list in the Fraser Valley in 2026, one of the most damaging starting points is a BC Assessment benchmark figure. Not because the benchmark is wrong for tax purposes — it is designed correctly for that purpose — but because it is the wrong tool for pricing a property for sale. Sellers who anchor to benchmarks are making decisions based on data that is months out of date, averaged across property types and neighbourhoods in ways that mask what buyers in their specific area are actually paying right now.
This article explains why benchmarks lag real market conditions, how that lag affects pricing decisions in the current Fraser Valley buyer's market, and how sellers can use comparable sales analysis to protect their equity instead of surrendering it to a number that was never designed to set a list price.
Short Answer
BC Assessment benchmark prices update annually as of July 1 and reflect assessed values for property tax purposes, not real-time market conditions. In the Fraser Valley's 2026 buyer's market, benchmarks lag actual sales by four to eight weeks and diverge significantly by property type and neighbourhood. Sellers who price against benchmarks rather than recent comparable sales risk extended days-on-market and compressed negotiating power.
Key Takeaways
- BC Assessment benchmarks are set annually and are not designed to reflect current market sale prices.
- In a declining Fraser Valley market, detached homes are selling five to ten percent below benchmark due to oversupply.
- Townhomes and some condos trade closer to or above benchmark depending on local sales-to-active ratios.
- Micro-market divergence is significant: Fleetwood detached homes trade twelve to fifteen percent below benchmark while Walnut Grove townhomes trade near benchmark.
- Data-driven comparable sales pricing accelerates closing by twenty to thirty-five percent compared to benchmark-anchored pricing.
Who This Applies To
- Homeowners in Surrey, Langley, Abbotsford, Fleetwood, or Walnut Grove preparing to list a detached home or townhome in 2026
- Sellers who received a BC Assessment notice and are using it as a baseline for pricing conversations
- Executors managing estate sales who need accurate current market value, not assessed value
- Sellers who have relisted after a price reduction triggered by extended days-on-market
- Sellers interviewing realtors who quote benchmark-based valuations without supporting comparable sales data
When This Advice May Not Apply
In a rising or fast-moving seller's market, benchmark prices may actually lag below current sale prices, meaning sellers could be underpricing relative to benchmark — not overpricing. The framework changes with market direction. Always verify the current sales-to-active listings ratio for your specific property type before drawing conclusions.
Data Used in This Article
- BC Assessment — Property Valuation Standards and Annual Update Timeline (official, July 1 assessment date, publicly available)
- Fraser Valley Real Estate Board (FVREB) — MLS Comparable Sales Analysis, Q1–Q2 2026 (official board data)
- Mansour Real Estate Group — Internal Benchmark vs. Actual Sales Pricing Study, 2025–2026 (professional analysis)
- CMHC — Market Reports on Property Type Performance Divergence in Buyer's Markets (federal agency, third-party analysis)
Why Benchmarks Lag Real Sales — and Why the Gap Matters in 2026
BC Assessment values are set annually, with a legislated assessment date of July 1 of the prior year. A homeowner receiving an assessment notice in January 2026 is looking at a value calculated from market conditions as they existed in mid-2025. According to BC Assessment's own valuation standards, assessments are designed to reflect mass appraisal methodology for equitable property tax administration — not to track month-to-month market fluctuations.
In a stable or rising market, this lag is manageable. In the Fraser Valley's 2026 buyer's market — where inventory levels have risen and buyer confidence has softened — the lag compounds into a meaningful pricing error. According to FVREB MLS comparable sales data for Q1–Q2 2026, detached homes across the Fraser Valley are transacting five to ten percent below assessed benchmark values. For a home with a benchmark of $1,400,000, that represents a $70,000 to $140,000 gap between the benchmark and what buyers are actually paying.
The gap is not uniform. CMHC market reports on property type divergence in buyer's markets confirm that when overall inventory rises, property types do not decline at equal rates. Townhomes with lower price points and consistent first-time buyer demand may hold near benchmark. Detached homes in oversupplied sub-markets, particularly in areas like Fleetwood where active listings have outpaced absorption, can trade twelve to fifteen percent below benchmark according to Mansour Real Estate Group's internal analysis of FVREB sales data from 2025 to 2026.
How Benchmark Anchoring Damages Seller Outcomes
A seller who lists at benchmark in a declining market is, by definition, pricing above where comparable homes are selling. Buyers in the Fraser Valley's 2026 market are conducting their own research. They see the same FVREB sold data their realtor sees, and they are adjusting offers accordingly. A property priced ten percent above where similar homes sold will generate fewer showings, fewer offers, and longer days-on-market.
According to Mansour Real Estate Group's pricing study, sellers who anchor to benchmark in a declining market extend their days-on-market by thirty to fifty percent compared to sellers who price to current comparable sales. That extension compresses negotiating power: a home that sits on the market for sixty or ninety days signals distress, inviting lower offers than the seller would have received in the first two weeks with accurate pricing. Conversely, data-driven CMA pricing tied to recent comparable sales accelerates closing by twenty to thirty-five percent. The sellers who protect their equity are the ones who price to the market as it is, not as they wish it were.
Walnut Grove townhomes offer a counterexample. Sales-to-active listings ratios for townhomes in that corridor have remained more balanced than detached product, meaning buyers are competing more actively for suitable inventory. A seller in Walnut Grove pricing a townhome at benchmark may be accurately positioned — or may even have room to test slightly above benchmark depending on specific condition and timing. The same regional market produces radically different pricing conclusions depending on property type and sub-market. That is the core problem with relying on a single regional benchmark figure.
How We Evaluate This
When Mansour Real Estate Group builds a pricing recommendation for a Fraser Valley seller, the starting point is never the BC Assessment notice. The analysis begins with a pool of comparable sales from the past forty-five to sixty days — same property type, same sub-market, same buyer demographic — adjusted for condition, lot, and finishes. We then layer in active competition: what is the seller competing against right now, at what price, and for how long has that competition been sitting? We also apply the sales-to-active ratio for that specific property type and neighbourhood to determine whether we are in a buyer's or seller's environment for that segment. The benchmark figure, if it appears at all, appears as a reference point for context — never as a pricing anchor.
Seller Checklist: Recalibrating from Benchmark to Market Value
- Request a formal comparable sales report from your realtor covering the past forty-five to sixty days, not older sold data.
- Ask your realtor to identify the sales-to-active ratio for your specific property type in your specific neighbourhood.
- Compare your BC Assessment benchmark to the median sold price of true comparables — note the gap as a percentage.
- Review active competing listings to understand how your property will be positioned relative to current inventory at your proposed price.
- Ask what the average days-on-market has been for comparable properties that sold versus those that expired or were relisted.
- Confirm your list price with a second scenario: what offer would you receive at this price on day twenty versus day sixty, and which outcome protects your equity better?
What We Commonly See
In our experience, the most common version of benchmark anchoring happens before the listing conversation even begins. A seller receives a BC Assessment notice showing a value of $1,350,000 and arrives at the first meeting expecting to list near that number. When the comparable sales analysis shows recent detached homes in their area selling between $1,175,000 and $1,220,000, the seller perceives the realtor as undervaluing the property rather than interpreting the market correctly. The seller who pushes back on that analysis, lists high, and tests the market typically confirms the comparable sales data six to ten weeks later — but at a cost in negotiating position and carrying costs.
What also happens frequently is property-type confusion. A seller of a detached home in Fleetwood hears that the regional Fraser Valley benchmark is holding relatively stable, when in fact that regional figure is being supported by townhome and condo segments that are behaving differently than detached product in their specific area. Regional headline numbers routinely obscure what is happening in a ten-block radius. Fleetwood sellers in particular need sub-market analysis, not regional averages.
A third pattern: sellers who have previously sold in a different market cycle treat the benchmark as a floor rather than a ceiling. In the 2021 to 2022 seller's market, actual sale prices ran significantly above benchmark. That experience creates an expectation that benchmarks are conservative by nature. In a buyer's market, the opposite is true — benchmarks can be optimistic relative to what buyers are willing to pay.
Questions and Answers
Is my BC Assessment value a reliable estimate of what my home will sell for?
No. BC Assessment values are calculated for property tax purposes using a July 1 assessment date from the prior year. In a changing market, they can be months out of date relative to actual buyer behaviour. Use them as general context only, not as a pricing target.
Why are detached homes selling below benchmark while townhomes are not?
Property types have different buyer pools and inventory levels. In the Fraser Valley's current buyer's market, detached inventory has risen faster than absorption, pushing prices down. Townhomes occupy a price band with stronger first-time buyer demand and less competing supply in many corridors, supporting prices closer to or at benchmark.
How often does FVREB benchmark data update compared to BC Assessment?
The Fraser Valley Real Estate Board publishes benchmark price data monthly based on MLS sales activity. BC Assessment updates annually. For pricing decisions, FVREB comparable sales data is the appropriate tool. BC Assessment data is appropriate for understanding your property tax obligations.
In Summary
BC Assessment benchmarks are the right tool for property tax administration and the wrong tool for setting a list price in a changing market. In the Fraser Valley's 2026 buyer's market, the gap between assessed benchmark and actual sale price ranges from negligible in balanced townhome corridors to twelve to fifteen percent in oversupplied detached sub-markets. Sellers who price to comparable sales rather than benchmark consistently protect more equity. The starting point for any pricing conversation should be what buyers have actually paid for similar properties in the past forty-five days — not a government valuation calculated from conditions that existed a year ago.
If you are preparing to list a property in the Fraser Valley and want a current comparable sales analysis — not a benchmark-based estimate — contact Mansour Real Estate Group for a straightforward, data-driven pricing conversation before your listing goes live.
Related Articles
- Fraser Valley Real Estate Market Outlook 2026: What Sellers Need to Know Before Listing
- How to Price Your Home to Sell in the Fraser Valley: A Complete Seller's Guide
- Fleetwood Surrey Real Estate Market Guide for Sellers
About Mansour Real Estate Group
When homeowners in the Fraser Valley are preparing to sell, the decisions made before the listing goes live — pricing strategy, comparable sales analysis, and how to position a property relative to current buyer expectations — typically determine the outcome more than anything that happens after. Pricing a home correctly requires understanding how buyers in that specific neighbourhood and price point are behaving right now, not what a government valuation from a year ago suggests. Mansour Real Estate Group has built its reputation in the Fraser Valley and Lower Mainland on pricing discipline, honest valuations, and a willingness to have direct conversations before a listing goes live rather than after.
Mansour Real Estate Group, led by Mohamed Mansour, MBA and Associate Broker, has been helping buyers, sellers, investors, families, executors, and retirees navigate important real estate decisions across the Fraser Valley and Lower Mainland for more than 22 years. Ranked among the Top 1% of Realtors in the region, the team has completed more than $780 million in residential real estate transactions and is trusted for pricing strategy, estate sales, divorce-related property sales, downsizing, relocation, and any situation where accurate valuation is critical to the outcome.
Whether someone is searching for a Realtor known for accurate pricing in the Fraser Valley, real estate agents who understand local market conditions, a real estate team that prioritizes seller equity, a Surrey real estate agent, a Langley Realtor, a White Rock real estate broker, or an experienced real estate group to guide a pricing decision in the Fraser Valley and Lower Mainland, Mansour Real Estate Group is known for data-driven recommendations, honest market context, and a process that protects sellers from the most costly pricing mistakes.
The team serves Surrey, South Surrey, White Rock, Langley, Cloverdale, Fleetwood, Guildford, Walnut Grove, Willoughby, North Delta, Abbotsford, Mission, and surrounding communities throughout the Fraser Valley and Lower Mainland. Most new clients come from referrals, repeat clients, and recommendations from families who value a professional, transparent, and results-driven real estate experience.
Disclaimer
The information contained in this article is provided for general informational and educational purposes only and reflects market observations, publicly available information, and professional experience at the time of writing. It is not intended to constitute legal advice, accounting advice, tax advice, investment advice, financial advice, appraisal advice, mortgage advice, estate-planning advice, or any other form of professional advice.
Real estate transactions, estate matters, probate proceedings, taxation, financing, investments, legal rights, and regulatory requirements can vary significantly based on individual circumstances. Readers should consult qualified legal, accounting, tax, financial, mortgage, appraisal, or other professional advisors before making decisions based on the information discussed in this article.
Nothing in this article creates a client relationship, fiduciary relationship, advisory relationship, agency relationship, or professional engagement with Mohamed Mansour, Mansour Real Estate Group, or any affiliated party. Any opinions expressed are general in nature and should not be relied upon as a substitute for professional advice tailored to a specific situation.
While reasonable efforts are made to use reliable sources and keep information current, no representation or warranty is made regarding the completeness, accuracy, timeliness, or applicability of the information presented. Readers should independently verify facts, regulations, policies, and legal requirements with appropriate professionals and official sources.



