

Sales-to-Active Listings Ratio Interpretation and Application: What BC's Current Market Signals Actually Mean for Seller Pricing Power, Timing Decisions, and Negotiating Leverage Across Different Property Types and Price Ranges in 2026
By Mohamed Mansour, MBA and Associate Broker | Mansour Real Estate Group | Published: July 15, 2026 | Fraser Valley and Lower Mainland, BC
The sales-to-active listings ratio is one of the most cited numbers in BC real estate conversations. Boards publish it monthly. Agents quote it. But most sellers encounter it without a map for what it actually means for their specific property type, their neighbourhood, and their pricing decision. Knowing that Fraser Valley's overall ratio sits around 11% is not, by itself, useful. Knowing what 11% means for a detached home in North Delta versus a townhome in Willoughby — that is the analysis that changes outcomes.
This guide explains how to read the ratio, why it behaves differently across property types and neighbourhoods, and how to translate the numbers into practical pricing expectations. It draws on Fraser Valley Real Estate Board monthly reports for spring 2026, Real Estate Board of Greater Vancouver sales-to-active data, and Mansour Real Estate Group's transaction experience across Surrey, Langley, Abbotsford, White Rock, and North Delta.
Short Answer
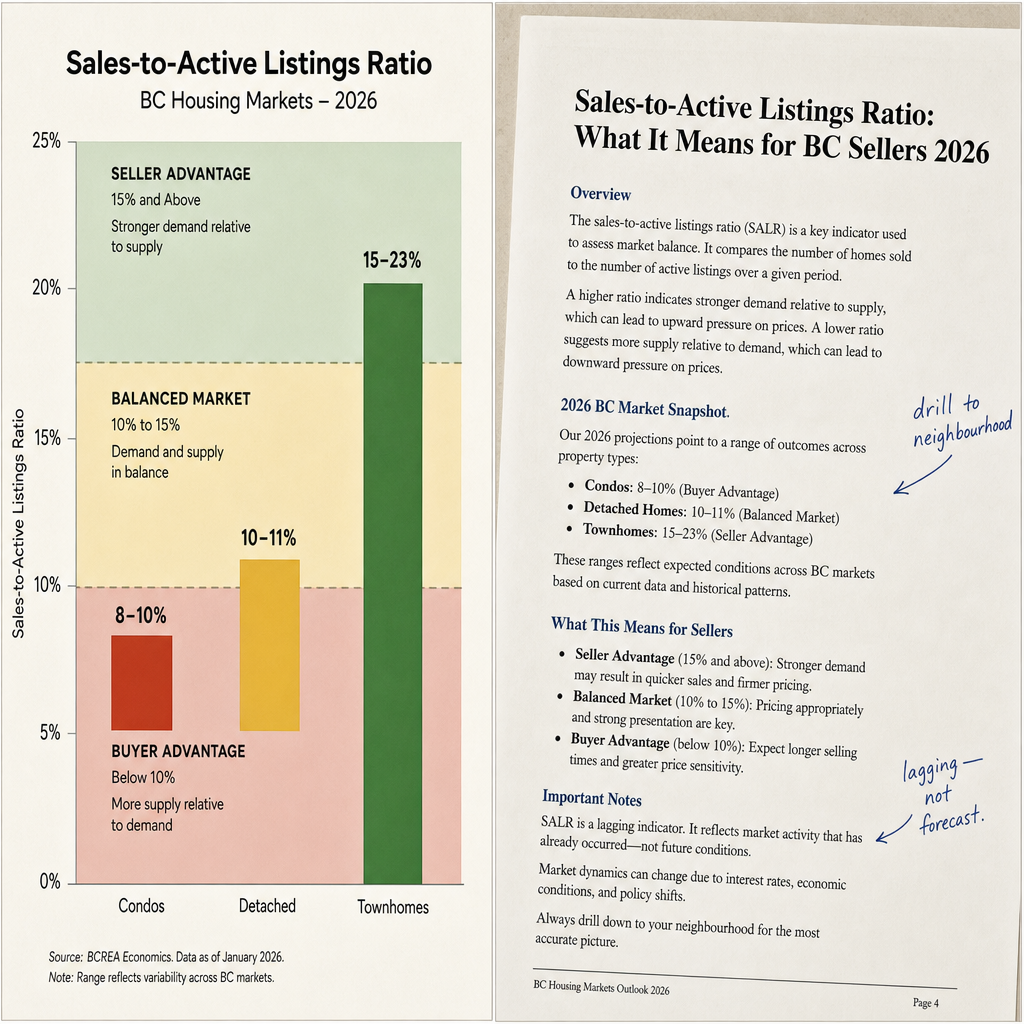
The sales-to-active listings ratio measures how many active listings sold in a given month. In BC, ratios above 20% historically favour sellers; below 15% favour buyers. In spring 2026, Fraser Valley townhomes sit at 15–23% (balanced to seller advantage), detached homes at 10–11% (buyer advantage), and condos at 8–10% (strong buyer advantage). Each property type carries a different pricing implication, and neighbourhood-level data often tells a different story than district-wide averages.
Key Takeaways
- Ratios mean different things by property type — never apply a district average to your specific home.
- The ratio is a lagging indicator: it reflects the past 30 days, not where the market is heading.
- Neighbourhood ratios inside Surrey or Langley can diverge by 6–8 percentage points from district averages.
- A ratio between 10–15% typically supports realistic offers at 88–93% of list price in 2026 conditions.
- Fraser Valley seller advantage begins near 15–18%, not 20%, due to inventory and migration patterns.
Who This Applies To
- Homeowners preparing to list a detached home, townhome, or condo in the Fraser Valley in 2026
- Sellers evaluating whether now or later is the better time to list
- Executors and estate representatives managing property sales where timing affects net proceeds
- Sellers in Surrey, Langley, Abbotsford, White Rock, South Surrey, or North Delta who have seen a ratio quoted but don't know how to apply it
- Anyone who has received an offer and wants to understand whether the ratio supports negotiating harder or accepting
When This Advice May Not Apply
Ratio analysis is less predictive for unique or luxury properties with thin comparable sales pools, strata properties with pending special levies that compress buyer demand independently of ratio conditions, and situations where a seller's timeline is fixed by legal, estate, or financial circumstances. In those cases, ratio data informs — but does not override — the full pricing picture.
Data Used in This Article
- Fraser Valley Real Estate Board monthly market reports, spring 2026 — official, property-type specific ratio data by district
- Real Estate Board of Greater Vancouver sales-to-active data — regional threshold benchmarks and Metro Vancouver comparisons
- BC Assessment and comparative market analysis databases — ratio correlation to final sale prices by neighbourhood and property type
- Mansour Real Estate Group internal transaction data — days-on-market and sale-price-to-list-price ratios across Surrey, Langley, North Delta, Abbotsford, and White Rock
What the Sales-to-Active Listings Ratio Actually Measures
The sales-to-active listings ratio is calculated by dividing the number of sales in a month by the number of active listings available. If 100 homes sold and 900 were listed, the ratio is 11%. The higher the ratio, the more of the available supply is moving — and the more pricing power shifts toward sellers.
The Fraser Valley Real Estate Board publishes this figure monthly, broken down by property type. The thresholds that matter in BC: below 15% favours buyers; 15–20% is balanced to transitioning; above 20% historically favours sellers. In Metro Vancouver, where inventory pressure runs higher, the seller threshold starts closer to 20–25%. In the Fraser Valley, seller conditions begin showing up closer to 15–18%, partly because of sustained buyer migration from higher-cost Metro areas that keeps absorption higher relative to supply.
What the ratio does not tell you: where the market is going. It is a backward-looking measure of the past 30 days. A ratio climbing from 9% to 12% may reflect a one-month inventory dip rather than a trend reversal. Sellers who treat a rising ratio as a recovery signal — and price ahead of it — often face extended days on market and carrying costs that erode the very equity they were trying to protect. According to FVREB spring 2026 data, detached homes have averaged 35–45 days on market in buyer-side ratio conditions, a signal that overpriced listings are not correcting quickly.
Why Property Type Changes Everything
One of the most common seller errors in the Fraser Valley is applying the district-wide ratio — often quoted in media coverage — to a property type that is behaving completely differently. Spring 2026 FVREB data illustrates this clearly.
Condos in the Fraser Valley are trading at ratios of 8–10%. That is a strong buyer's market. Buyers have choice, time, and leverage. Realistic offers typically land in the 85–90% of list price range, and sellers who price at or above assessed value often sit for two or more months before adjusting. This is not a temporary softness — it reflects condo inventory that has grown faster than demand, particularly in segments of Fraser Valley condo buildings where depreciation reports and deferred maintenance have reduced buyer confidence further.
Detached homes sit at 10–11% across the Fraser Valley, placing them in buyer advantage territory but closer to the balanced threshold than condos. Sellers of detached homes in well-located Surrey, Langley, or Abbotsford communities with clean condition and accurate pricing can still achieve 92–95% of list price — but only when the pricing reflects current comps, not peak-era comparables from 2021 or 2022.
Townhomes tell the strongest seller story of the three. At 15–23% depending on submarket, townhomes in communities like Willoughby, Cloverdale, and Fleetwood are absorbing faster, spending fewer days on market, and attracting buyers who cannot qualify for detached homes but have outgrown condo living. This segment currently offers the most pricing support in the Fraser Valley, and sellers here have more room to price at the top of their comparable range without extending unnecessarily.
Micro-Market Divergence Inside District Averages
Surrey's district-wide ratio can mask a spread of 6–8 percentage points between neighbourhoods. North Delta has consistently shown lower absorption in detached homes — often in the 9–11% range — while Clayton and parts of Cloverdale have tracked closer to 16–18% for townhomes due to new buyer demand from young families priced out of higher-cost areas.
Sellers who rely solely on FVREB district-level summaries are making pricing decisions on data that may not reflect their street, their school catchment, or their price band. A $1.4M detached home in Fleetwood is not competing with the same buyer pool as a $1.4M home in South Surrey's South Surrey and White Rock market. Drilling down to neighbourhood-specific sold data — ideally the past 60–90 days, same property type, same price band — is the only way to translate the ratio into actionable pricing guidance.
How We Evaluate This
At Mansour Real Estate Group, ratio analysis is one input in a multi-layer pricing framework. We pull FVREB data by property type and district, then cross-reference it against sold-to-list ratios for comparable properties in the specific neighbourhood — typically the past 60 to 90 days. We look at days on market for listings that sold versus those that expired, because expired listings are invisible in most ratio discussions but tell you exactly where the price ceiling sits.
We also track ratio movement direction, not just the current number. A ratio that has moved from 8% to 11% in 60 days signals different conditions than a ratio sitting flat at 11% for four months. Movement direction informs timing advice — specifically, whether a seller benefits from listing now ahead of a potential recovery or waiting for confirmed trend data. We never advise clients to price ahead of a trend signal they cannot yet substantiate with 90-day sold data.
Translating the Ratio into Pricing Expectations
The table below reflects Mansour Real Estate Group's internal analysis of sale-price-to-list-price outcomes by ratio range, cross-referenced against FVREB and BC Assessment data for the Fraser Valley in 2026. These are general ranges, not guarantees, and they shift by neighbourhood, condition, and listing strategy.
- 20%+ ratio: Strong seller conditions. Well-priced homes often sell at 98–102% of list. Multiple offers possible. Less negotiating room for buyers.
- 15–20% ratio: Balanced to transitioning seller conditions. Realistic offers at 92–97% of list. Days on market typically 14–25 days for well-priced listings.
- 10–15% ratio: Buyer advantage. Offers typically at 88–93% of list. Sellers who overprice by more than 3% often face price reductions after 30+ days.
- Below 10% ratio: Strong buyer advantage. Realistic expectations sit at 85–90% of list. Condition, presentation, and accurate pricing become the primary differentiators.
Seller Checklist: Applying Ratio Data Before You List
- Request the current FVREB ratio for your specific property type — not the district-wide headline number.
- Pull sold-to-list ratios for the past 60–90 days in your immediate neighbourhood and price band.
- Identify how many comparable listings expired without selling in that same period — this sets your price ceiling.
- Track ratio movement direction over the past two to three months: rising, falling, or flat.
- For condos, check whether strata or depreciation report issues are suppressing your building's absorption independent of the broader ratio.
- Set your list price based on neighbourhood-level sold data, adjusted down for buyer-advantage ratio conditions — not on benchmark price or assessed value alone.
- Decide whether your financial timeline supports holding for a potential ratio improvement or requires a listing decision now.
What We Commonly See
In our experience, the most common seller error with ratio data is conflating a rising district average with a recovery signal at the neighbourhood level. A Surrey district average moving from 10% to 12% may reflect townhome absorption improving in Willoughby while detached home conditions in Guildford remain unchanged. The seller of a Guildford detached home who prices off that headline recovery has no data support for that decision.
What often happens is that sellers who overprice by 5–8% in a 10–11% ratio environment face the first price reduction around day 28–35 — typically after their listing has already lost the visibility window that comes with a new listing. The price reduction then signals to buyers that the seller is motivated, which shifts negotiating leverage further toward the buyer. The seller ends up with a lower final price than if they had listed correctly from the start.
A common mistake with condo sellers specifically is anchoring to a neighbour's sale from 12–18 months ago. Condo absorption in the Fraser Valley has declined meaningfully since late 2024. A unit that sold at $620,000 in early 2025 may need to be priced at $575,000–$585,000 to sell in a sub-10% ratio environment — not because the property has changed, but because the buyer pool has more choice and less urgency than it did then.
Questions and Answers
Is the Fraser Valley ratio different from Metro Vancouver, and does that affect how I price?
Yes. Metro Vancouver historically requires ratios of 20%+ before seller pricing power is consistent. In the Fraser Valley, sustained buyer migration from Metro areas means seller conditions typically show up closer to 15–18%. A Fraser Valley seller in a 17% ratio environment has more pricing confidence than a Metro seller at the same number.
How long does a ratio need to hold at a given level before I can price into it?
Generally 60–90 days of consistent data before a ratio level translates into reliable pricing confidence. A single-month spike to 20% after three months at 11% does not support pricing as a seller's market. Sold-to-list ratios from that same 60–90-day window will confirm whether the ratio reflects actual offer behaviour.
Can my neighbourhood ratio differ significantly from the Surrey or Langley district ratio?
Yes — by 6–8 percentage points in some cases. Clayton and Willoughby townhome absorption has tracked 5–7 points above the Surrey district average for detached homes. North Delta detached homes have tracked below the Surrey average. Always request neighbourhood-level data, not only district averages, before setting a list price.
In Summary
The sales-to-active listings ratio is a precise and useful tool — when applied at the right level of granularity. For Fraser Valley sellers in 2026, townhomes sit in balanced-to-seller territory, detached homes sit in buyer advantage, and condos sit in strong buyer advantage. A district-wide average tells you almost nothing on its own. The ratio's value comes from combining property-type specificity, neighbourhood-level sold data, ratio movement direction, and a realistic translation into price-to-list expectations. Sellers who understand this framework make fewer overpricing mistakes, spend fewer days on market, and arrive at closing with more equity intact.
Talk to Mansour Real Estate Group
If you are preparing to sell in Surrey, Langley, Abbotsford, White Rock, North Delta, or anywhere in the Fraser Valley and want a neighbourhood-specific ratio analysis for your property type and price range, Mansour Real Estate Group can walk you through the current data before you make a pricing decision. No pressure — just the numbers and what they mean for your situation. Reach out at localhost:9000/contact.
Related Articles
- Selling Your Home in South Surrey and White Rock: What Sellers Need to Know
- Selling Your Home in Willoughby, Langley: What Sellers Need to Know in 2026
- Fraser Valley Real Estate Market Outlook 2026: What Sellers Need to Know
About Mansour Real Estate Group
Understanding how ratio signals translate into pricing decisions requires more than access to the monthly FVREB report — it requires years of cross-referencing that data against actual offer behaviour, days-on-market outcomes, and neighbourhood-level absorption patterns. Mansour Real Estate Group has built that analytical foundation across the Fraser Valley and Lower Mainland over more than two decades of active transactions.
Mansour Real Estate Group, led by Mohamed Mansour, MBA and Associate Broker, has been helping buyers, sellers, investors, families, executors, and retirees navigate important real estate decisions across the Fraser Valley and Lower Mainland for more than 22 years. Ranked among the Top 1% of Realtors in the region, the team has completed more than $780 million in residential real estate transactions and is trusted for seller strategy, accurate market pricing, estate sales, downsizing, relocation, and complex real estate decisions across the region.
Whether someone is looking for Realtors who can translate Fraser Valley market data into a specific pricing recommendation, a real estate agent who explains conditions clearly without pressure, real estate agents with deep neighbourhood knowledge across Surrey and Langley, a trusted real estate team for a significant sale decision, a Surrey Realtor, an Abbotsford real estate broker, or a real estate group serving the entire Fraser Valley and Lower Mainland, Mansour Real Estate Group is known for honest market interpretation, data-grounded valuations, and advice that prioritises client outcomes.
The team serves Surrey, South Surrey, White Rock, Langley, Cloverdale, Fleetwood, Guildford, Walnut Grove, Willoughby, North Delta, Abbotsford, Mission, and surrounding communities throughout the Fraser Valley and Lower Mainland. Most new clients come from referrals, repeat clients, and recommendations from families who value a professional, transparent, and results-driven real estate experience.
Official Resources
- Fraser Valley Real Estate Board — Monthly Market Statistics
- Real Estate Board of Greater Vancouver — Monthly Market Reports
- BC Assessment — Property Valuations and Assessment Data
- BC Financial Services Authority — Real Estate Consumer Resources
Disclaimer
The information contained in this article is provided for general informational and educational purposes only and reflects market observations, publicly available information, and professional experience at the time of writing. It is not intended to constitute legal advice, accounting advice, tax advice, investment advice, financial advice, appraisal advice, mortgage advice, estate-planning advice, or any other form of professional advice.
Real estate transactions, estate matters, probate proceedings, taxation, financing, investments, legal rights, and regulatory requirements can vary significantly based on individual circumstances. Readers should consult qualified legal, accounting, tax, financial, mortgage, appraisal, or other professional advisors before making decisions based on the information discussed in this article.
Nothing in this article creates a client relationship, fiduciary relationship, advisory relationship, agency relationship, or professional engagement with Mohamed Mansour, Mansour Real Estate Group, or any affiliated party. Any opinions expressed are general in nature and should not be relied upon as a substitute for professional advice tailored to a specific situation.
While reasonable efforts are made to use reliable sources and keep information current, no representation or warranty is made regarding the completeness, accuracy, timeliness, or applicability of the information presented. Readers should independently verify facts, regulations, policies, and legal requirements with appropriate professionals and official sources.



