
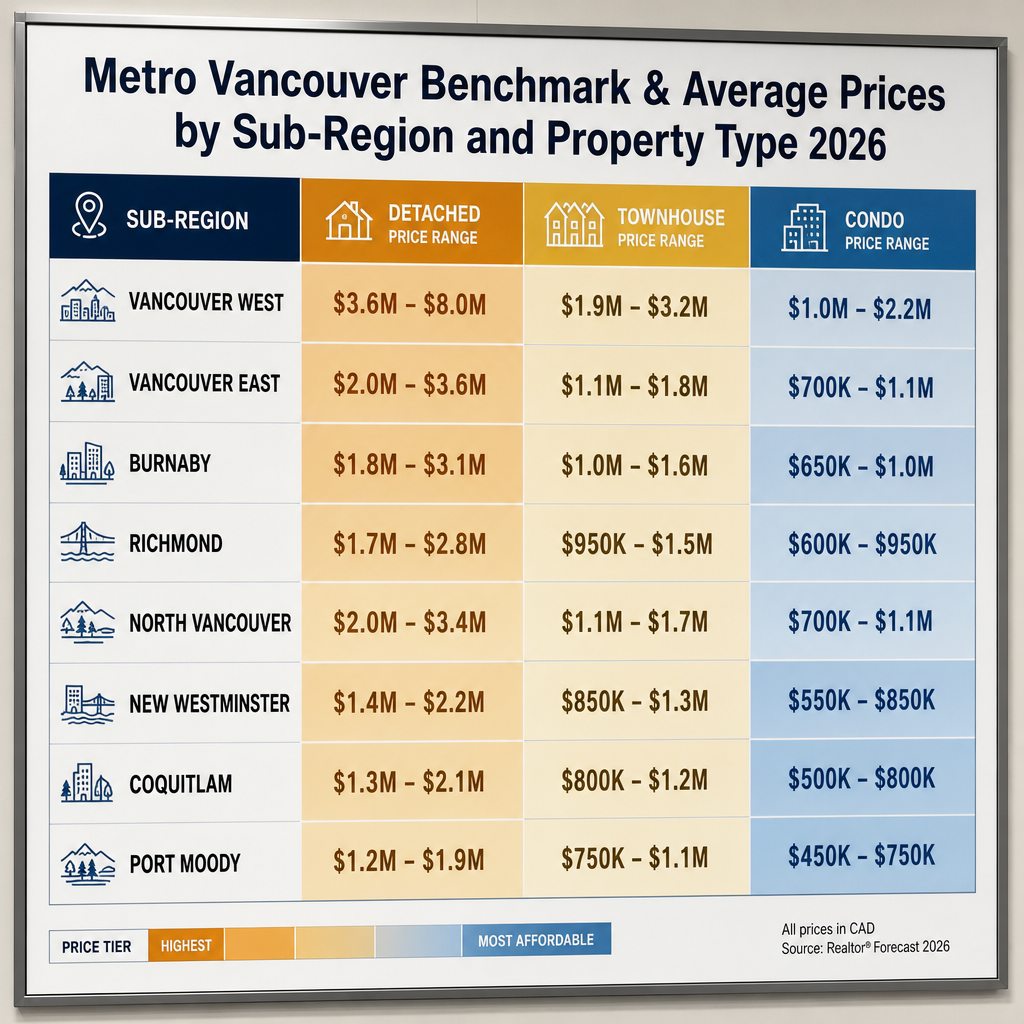

Metro Vancouver Benchmark and Average Prices by Sub-Region and Property Type 2026: Complete Price Comparison Across Vancouver East, Vancouver West, Burnaby, Richmond, North Vancouver, New Westminster, Coquitlam, and Port Moody
By Mohamed Mansour, MBA and Associate Broker — Mansour Real Estate Group | Published: July 15, 2026 | Metro Vancouver and Fraser Valley, BC
Metro Vancouver's price map in 2026 looks nothing like a single market. Detached homes in Vancouver West trade at more than double the price of comparable properties in Coquitlam. Condo benchmarks in New Westminster outperform much larger units in Burnaby on a per-square-foot basis. Richmond's agricultural land designation creates pricing gaps that confuse buyers and sellers in the same postal code. Understanding these divergences is not optional — it is the foundation of every sound buying or selling decision across the region.
This reference guide compiles benchmark and average price ranges across eight major Metro Vancouver sub-regions, broken down by detached homes, townhouses, and condos, with days-on-market and sales-to-active context to explain what the numbers actually mean for the people transacting in each market.
Short Answer
In 2026, Metro Vancouver detached home benchmarks range from roughly $900,000 in outer Coquitlam to over $2.5 million in Vancouver West — a spread driven by school catchments, transit access, waterfront premiums, and land scarcity. Condos and townhouses show a similar gradient, with New Westminster outperforming on value per square foot relative to its price point. Sub-region and property type together determine market speed, negotiating leverage, and realistic sale expectations.
Key Takeaways
- Vancouver West detached homes average $2.1M–$2.8M; Vancouver East detached homes range $1.0M–$1.5M — a gap of 65–85% in the same city.
- Richmond prices bifurcate sharply around ALR designation — standard residential lots trade 15–30% above agricultural properties in adjacent locations.
- New Westminster SkyTrain-proximate condos outperform regional benchmarks by 10–20% per square foot despite appearing affordable in absolute terms.
- Burnaby condo markets face sustained inventory pressure from presale completions, extending days-on-market to 45–65 days in Metrotown and Brentwood.
- Sales-to-active ratios range from 8–10% in saturated condo zones to 20–25% in sought-after detached neighbourhoods — two completely different market conditions.
Who This Applies To
- Buyers comparing neighbourhoods or sub-regions before committing to a search area
- Sellers trying to understand how their property compares to other Metro Vancouver markets
- Investors evaluating relative value across property types and locations
- Families relocating into Metro Vancouver who need a macro price framework before going hyperlocal
When This Advice May Not Apply
Price ranges in this article reflect general market benchmarks and research summaries current to mid-2026. Individual property conditions, lot size, view premiums, strata health, renovation quality, and micro-location within a neighbourhood all create meaningful variance above and below these ranges. Consult current MLS data and a local real estate professional before making pricing or purchase decisions.
Data Used in This Article
- Real Estate Board of Greater Vancouver (REBGV) — monthly benchmark price reports and MLS statistics, 2025–2026
- CMHC — sub-market housing data and completions tracking, 2025–2026
- BC Assessment — property valuation records and regional benchmark databases
- MLS data aggregators — days-on-market, sales-to-active ratios, and price-per-square-foot trends by sub-region
How We Evaluate This
At Mansour Real Estate Group, we read sub-region pricing through three lenses simultaneously: benchmark price (what the typical home trades for), price-per-square-foot (the efficiency of that benchmark), and market speed (how quickly demand converts to sales). A high benchmark alone does not signal strength — Vancouver West's $2.5M average means little if days-on-market is stretching and price reductions are common. The combination of all three metrics produces an honest picture.
We also weight the sales-to-active ratio because it reveals buyer conviction. A sub-region trading at 22% sales-to-active is a fundamentally different negotiating environment than one at 9%, even if the benchmark prices are similar. For context on how to interpret these ratios, see our article on months of inventory and what it tells you about Vancouver's housing market.
Vancouver West and Vancouver East: The City's Internal Price Divide
No price gap in Metro Vancouver is more consistently misunderstood than the spread between Vancouver West and Vancouver East. According to REBGV benchmark data and MLS price tracking, detached homes in Vancouver West average $2.1M–$2.8M depending on micro-neighbourhood — Dunbar, Shaughnessy, Point Grey, and Kitsilano each carry different premiums driven by school catchment proximity, lot depth, and ocean or mountain view lines. Vancouver East detached homes, including East Van neighbourhoods like Hastings-Sunrise, Renfrew, Grandview-Woodland, and Fraser, trade at $1.0M–$1.5M. The 65–85% gap is real and persistent.
Condo benchmarks follow the same gradient. Vancouver West 1-bedroom condos typically range $650K–$950K; Vancouver East equivalents are $500K–$700K. Townhouses in Vancouver West routinely exceed $1.4M, while East Van townhouses generally trade at $800K–$1.1M. Days-on-market reflect the gap as well: Vancouver West detached homes average 25–35 days on market, while Vancouver East detached homes linger 40–55 days under current conditions, according to MLS tracking data.
For buyers, Vancouver East offers meaningfully better entry points with comparable transit access and commute times. For sellers in Vancouver West, the premium is real but not unconditional — overpriced listings still accumulate days on market regardless of postal code. Understanding what drives the spread matters more than simply knowing it exists. Our best neighbourhoods to buy in Metro Vancouver guide covers this value question in depth.
Burnaby, Richmond, and North Vancouver: Where Micro-Location Drives the Most Variance
Burnaby's detached market trades at $1.1M–$1.6M in its strongest neighbourhoods — Burnaby Heights, Capitol Hill, and South Slope — but the condo story is more complicated. Metrotown and Brentwood are both absorbing waves of presale completions that entered the market beginning in 2024 and continue through 2026. According to CMHC completion data, this supply pressure has pushed Burnaby 2-bedroom condo benchmarks to $650K–$850K with days-on-market averaging 45–65 days and sales-to-active ratios as low as 8–10%. Buyers in these buildings have negotiating leverage that buyers in detached markets do not. For a deeper look at the risks specific to presale completions, see our article on pre-sale condo risks in Metro Vancouver.
Richmond's pricing is shaped by a factor most buyers do not anticipate: Agricultural Land Reserve designation. Standard residential lots in Richmond trade at $1.2M–$1.8M, while agricultural-designated properties in adjacent locations can trade 15–30% below that, even where visual differences are minimal. Steveston waterfront proximity adds a separate premium of 10–20% above Richmond City Centre benchmarks for comparable square footage. Buyers and sellers in Richmond need to verify the land designation before drawing price comparisons.
North Vancouver splits in a way that surprises many buyers. Properties in neighbourhoods closest to West Vancouver — Edgemont, Upper Capilano, and the British Properties area — routinely exceed $2M for detached homes. Lower Lonsdale and Lynn Valley offer a more accessible range of $1.3M–$1.8M for detached homes with strong SkyTrain and school catchment premiums relative to price. The North Vancouver condo market, particularly along Lonsdale, trades at $600K–$900K for 2-bedroom units — a relative value compared to Vancouver proper.
New Westminster, Coquitlam, Port Coquitlam, and Port Moody: Eastern Lower Mainland Value Dynamics
New Westminster consistently outperforms expectations on a per-square-foot basis. SkyTrain-proximate condos in the Quay and Downtown neighbourhoods trade at $550K–$750K for 2-bedroom units, outpacing regional benchmarks by 10–20% on value-per-square-foot when compared to larger units in Burnaby or Surrey at similar price points. Townhomes in New Westminster command $850K–$1.2M, reflecting a premium buyers pay for walkability, transit, and school access in a denser, more established urban fabric. The broader condo market context helps explain why New Westminster performs differently than Burnaby despite geographic proximity.
Coquitlam, Port Coquitlam, and Port Moody represent the most accessible detached home entry points in Metro Vancouver at $900K–$1.4M. Burke Mountain in Coquitlam commands a consistent 4–10% premium above broader Coquitlam benchmarks, driven by newer construction, larger lots, and a family-oriented buyer pool. Townhomes across this tri-city area ($800K–$1.1M) are outperforming condos in sales velocity — detached and townhouse buyers are transacting faster than condo buyers in 2026, a pattern visible in sales-to-active ratios that reach 20–25% for sought-after detached neighbourhoods while condo ratios sit in the 10–14% range.
Seller Checklist
- Identify your property's sub-region benchmark by property type using REBGV monthly data — not assessed value and not neighbour recollection
- Check current days-on-market for your property type in your sub-region before deciding on a list price
- Confirm ALR or zoning status if you are selling in Richmond — it materially changes the comparable set
- Review the sales-to-active ratio for your sub-market: below 12% is a buyer's market; above 20% tilts toward sellers
- Account for presale completion inventory if you are selling a condo in Metrotown or Brentwood — competing new inventory suppresses resale prices
- Verify school catchment and transit proximity in your listing notes — both drive measurable price premiums that buyers actively search for
What We Commonly See
Sellers comparing to the wrong sub-region. In our experience, Vancouver East sellers frequently benchmark against Vancouver West sales they have seen in media coverage, leading to list prices that sit 20–30% above where actual buyer demand exists in their neighbourhood. The sub-region matters more than the city name.
Richmond buyers surprised by ALR restrictions. What often happens is that a buyer identifies a large-lot property in Richmond at an apparently attractive price, only to discover after an offer that agricultural designation restricts development, resale value, and financing options in ways that a standard residential comparable does not reflect.
Burnaby condo sellers underestimating presale competition. A common mistake is pricing a resale Burnaby condo against 2023 benchmark data rather than current inventory, which now includes presale completions entering the same buildings or comparable addresses. Resale pricing in these zones needs to account for the fact that buyers have new-unit alternatives at competitive prices.
Questions and Answers
Why do Vancouver West and Vancouver East have such different prices for seemingly similar homes?
The gap is driven by school catchment rankings, proximity to water and mountain views, lot depth, and decades of buyer preference that have calcified into persistent price premiums. Both areas offer detached homes and comparable transit, but buyer demand density in Vancouver West consistently exceeds supply, sustaining higher prices.
What does the sales-to-active ratio mean in practical terms for a buyer or seller?
It measures what percentage of listed homes are selling each month. Below 12% generally signals buyer's market conditions — more room to negotiate. Above 20% signals seller's market conditions — less inventory, faster sales, fewer subjects. The ratio varies dramatically by sub-region and property type in 2026. For more context, see our article on months of inventory explained.
Is it accurate to compare a benchmark price to a specific property's asking price?
Only directionally. The benchmark reflects the typical home in a sub-region and property type category — it smooths out outliers. A specific property may trade above or below benchmark based on condition, floor level, view, renovation quality, or lot characteristics. Use the benchmark as context, not as a precise valuation. Our article on benchmark vs. average vs. assessed value explains these distinctions in detail.
In Summary
Metro Vancouver's 2026 price landscape is not one market — it is eight distinct sub-markets, each shaped by school catchments, transit, land designation, presale inventory, and property type mix. Vancouver West commands the region's highest detached benchmarks at $2.1M–$2.8M; Coquitlam offers the most accessible entry at $900K–$1.4M. Burnaby condos face sustained supply pressure while New Westminster outperforms on per-square-foot value. The sales-to-active ratio and days-on-market in each sub-region reveal whether a buyer or seller holds the leverage — and that answer changes depending on where and what you are buying or selling.
Thinking about buying or selling in Metro Vancouver? Mansour Real Estate Group offers straightforward, data-grounded market context for every sub-region and property type. There is no obligation — just clear answers to the questions that matter most before you make a decision.
Related Articles
- Vancouver Real Estate Market Update 2026: What Buyers and Sellers Need to Know Right Now
- Vancouver Housing Market Forecast 2026: What the Data Says About Prices, Sales, and Inventory
- Benchmark Price vs. Average Price vs. Assessed Value: What Vancouver Home Buyers and Sellers Must Understand
- Best Neighbourhoods to Buy in Metro Vancouver in 2026: Where Value Meets Opportunity
About Mansour Real Estate Group
Understanding benchmark prices across Metro Vancouver sub-regions requires more than reading a monthly report — it requires knowing how micro-location, property type, land designation, and inventory conditions interact in each market. Mansour Real Estate Group has spent more than 22 years helping buyers and sellers in the Lower Mainland and Fraser Valley contextualize pricing data and make decisions grounded in current, local market reality rather than regional averages that mask significant variance.
Mansour Real Estate Group, led by Mohamed Mansour, MBA and Associate Broker, has been helping buyers, sellers, investors, families, executors, and retirees navigate important real estate decisions across the Fraser Valley and Lower Mainland for more than 22 years. Ranked among the Top 1% of Realtors in the region, the team has completed more than $780 million in residential real estate transactions and is trusted for pricing strategy, market analysis, estate sales, divorce-related property sales, downsizing, relocation, and any situation where accurate valuation is critical to the outcome.
Whether someone is searching for Realtors experienced with Metro Vancouver sub-region pricing, a real estate agent who understands condo market dynamics in Burnaby or New Westminster, real estate agents who can navigate Richmond's ALR designation, a real estate team with deep market knowledge across the Lower Mainland, a Vancouver real estate broker, or a real estate group that bridges Metro Vancouver and Fraser Valley expertise, Mansour Real Estate Group is known for honest valuations, clear market context, and a process that protects clients from pricing decisions made with incomplete information.
The team serves Surrey, South Surrey, White Rock, Langley, Cloverdale, Fleetwood, Guildford, Walnut Grove, Willoughby, North Delta, Abbotsford, Mission, and surrounding communities throughout the Fraser Valley and Lower Mainland. Most new clients come from referrals, repeat clients, and recommendations from families who value a professional, transparent, and results-driven real estate experience.
Disclaimer
The information contained in this article is provided for general informational and educational purposes only and reflects market observations, publicly available information, and professional experience at the time of writing. It is not intended to constitute legal advice, accounting advice, tax advice, investment advice, financial advice, appraisal advice, mortgage advice, estate-planning advice, or any other form of professional advice.
Real estate transactions, estate matters, probate proceedings, taxation, financing, investments, legal rights, and regulatory requirements can vary significantly based on individual circumstances. Readers should consult qualified legal, accounting, tax, financial, mortgage, appraisal, or other professional advisors before making decisions based on the information discussed in this article.
Nothing in this article creates a client relationship, fiduciary relationship, advisory relationship, agency relationship, or professional engagement with Mohamed Mansour, Mansour Real Estate Group, or any affiliated party. Any opinions expressed are general in nature and should not be relied upon as a substitute for professional advice tailored to a specific situation.
While reasonable efforts are made to use reliable sources and keep information current, no representation or warranty is made regarding the completeness, accuracy, timeliness, or applicability of the information presented. Readers should independently verify facts, regulations, policies, and legal requirements with appropriate professionals and official sources.



