

Vancouver Home Sellers' Guide to Competitive Pricing in 2026: Why Anchoring to Peak Prices Costs You 10–20% in Net Proceeds — And How Strategic Underpricing Creates Buyer Urgency and Multiple Offers Even in Slow Markets
By Mohamed Mansour, MBA, Associate Broker — Mansour Real Estate Group | Published: July 15, 2026 | Vancouver, BC | General Informational Purposes Only
Vancouver sellers in 2026 are caught between two forces: real memory of what their home was worth in 2021 and real data showing what buyers will pay today. The gap between those two numbers is where net proceeds are being lost — not to the market, but to pricing decisions made before the sign goes on the lawn.
This guide is for Vancouver homeowners who are preparing to sell and want a clear-eyed, data-grounded explanation of how pricing decisions in 2026 actually work, what the current market is rewarding, and what it is punishing. The analysis draws on Real Estate Board of Greater Vancouver (REBGV) market data through April 2026, BC Assessment benchmarks, and MLS listing history patterns observed across Vancouver metro.
Short Answer
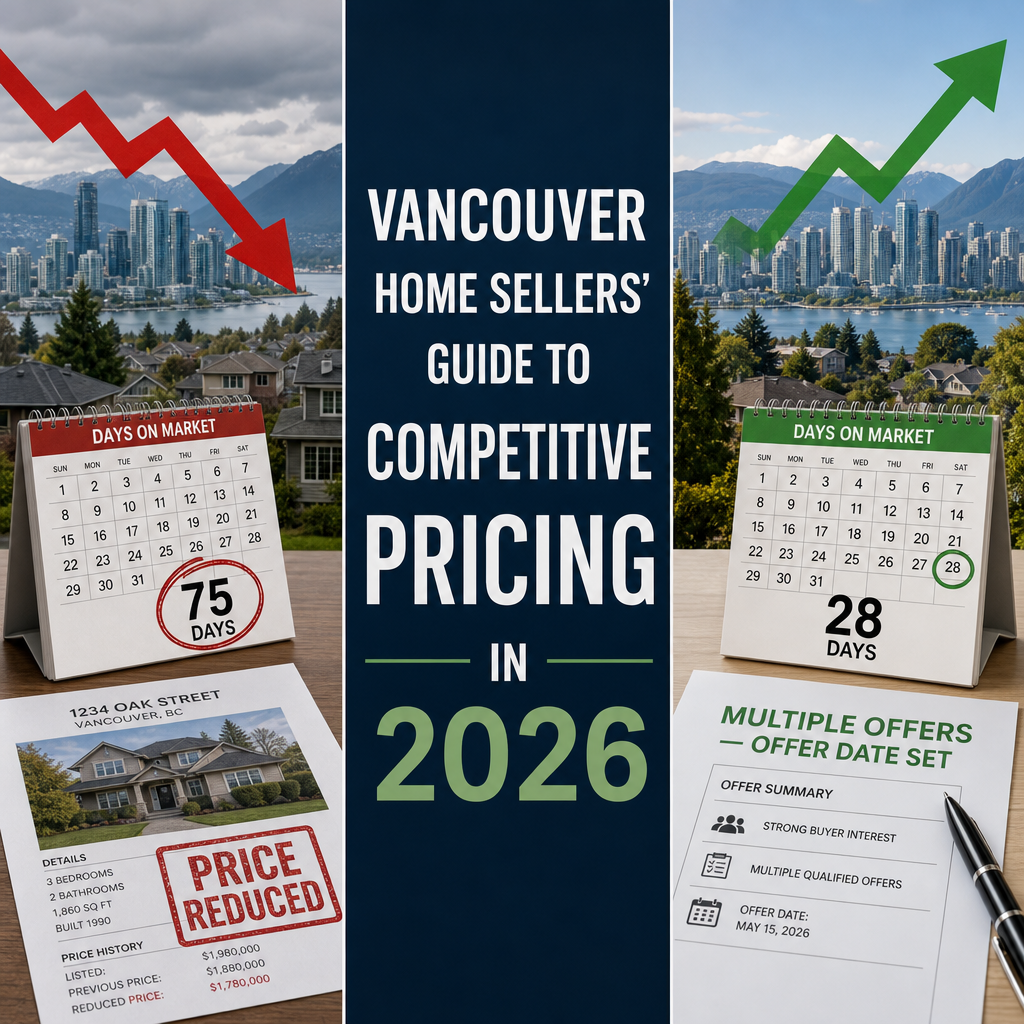
In Vancouver's 2026 market, homes priced 3–5% below recent comparable sales are selling in 25–35 days, often with multiple offers. Homes anchored to 2021–2022 peak prices or priced at market premiums are sitting 60–75 days, accumulating stigma, and ultimately selling for 10–20% less in net proceeds once carrying costs, price reductions, and negotiating concessions are added up. The constraint is not buyer demand — it is seller pricing strategy.
Key Takeaways
- Anchoring to 2021–2022 peak prices costs Vancouver sellers 10–20% in net proceeds through carrying costs, stigma, and forced reductions.
- Strategic pricing 3–5% below comparable recent sales produces days-on-market of 25–35 days versus 60–75 for overpriced listings.
- BC Assessment benchmarks for Vancouver properties diverge from actual market clearing prices by 8–15% and should be used as calibration data, not pricing ceilings.
- Multiple-offer scenarios in 2026 occur at price points set below initial market expectations — not at or above market, as sellers often assume.
- A listing that passes 45 days on market shifts negotiating leverage to buyers, reducing the seller's position regardless of the original list price.
Who This Applies To
- Vancouver homeowners preparing to list a detached, townhouse, or condo property in 2026
- Sellers who purchased between 2018 and 2022 and are benchmarking against what they paid or what they remember prices being
- Estate executors, divorce-related sellers, or downsizers with a defined timeline where carrying cost risk is real
- Sellers who have already listed and are seeing days accumulate without meaningful offers
When This Advice May Not Apply
Sellers with genuinely rare properties — unique view lots, heritage character homes, or properties with no meaningful comparables — face different pricing dynamics. This guide focuses on the $1.2M–$1.8M Vancouver detached and attached segments where inventory concentration and buyer behaviour are most clearly documented in 2026 REBGV data. Consult a qualified local real estate professional for property-specific analysis.
Key Definitions
Anchor Bias: A cognitive pattern where a seller fixes on a prior price point — often a peak-market figure — and adjusts from it rather than pricing from current market evidence.
Cumulative Days on Market (CDOM): The total time a property has been listed, including relists. Buyers and their agents track CDOM, not just the current listing's age.
Benchmark Price: A statistically modelled typical property price published by REBGV. It reflects a composite property type, not an individual home, and should not be used as a direct pricing reference without comparable sales analysis. For a full breakdown of how benchmark, average, and assessed values differ, see Benchmark Price vs. Average Price vs. Assessed Value: What Vancouver Home Buyers and Sellers Must Understand.
Data Used in This Article
- REBGV Market Reports, March–April 2026 — official board data, days-on-market by price band, sales-to-active ratios (Tier 1)
- BC Assessment 2026 — assessed values for Vancouver residential properties, divergence from recent MLS sold data (Tier 1)
- MLS listing history, Vancouver metro — sold price vs. initial list price premium/discount patterns 2025–2026 (Tier 2)
- Mansour Real Estate Group comparative market analysis observations, Vancouver client transactions 2025–2026 (internal professional experience, Tier 5)
How We Evaluate This
At Mansour Real Estate Group, pricing recommendations are built from three inputs: recent sold comparables within the tightest reasonable geographic radius, active competition the buyer will actually see on the same search, and current days-on-market patterns by price band. We weight sold data heavily but treat it as a floor, not a ceiling, when market direction is downward. The question is not what similar homes sold for — it is what they would sell for today, listed tomorrow, against today's competing inventory.
We also account for buyer financing reality. The mortgage stress test in 2026 reduces the qualified buyer pool at higher price points, which directly affects how many real buyers exist for any given property. Pricing strategy must reflect the pool available, not the pool that existed in 2021.
Why Anchor Bias Is the Most Expensive Mistake Vancouver Sellers Make in 2026
The REBGV's spring 2026 data shows a volume-price divergence that tells the story clearly. Sales in the Greater Vancouver area were up approximately 7% year-over-year in April 2026, while benchmark prices remained down approximately 7.5% from prior-year levels, according to REBGV monthly statistics. Buyers are returning — but only at prices the market will clear, not at prices sellers wish it would clear.
The seller who lists at $1.75M because that is what a neighbour achieved in March 2022 is not pricing strategically. They are pricing emotionally. That 2022 sale happened when the Bank of Canada's overnight rate was near historic lows, when buyer competition was acute, and when inventory was constrained. All three of those conditions reversed. As detailed in the Vancouver Real Estate Market Update 2026, the market structure has shifted materially and pricing from a 2022 reference point ignores that shift entirely.
What happens next is predictable. The property sits. At 15 days, buyers ask their agents what is wrong with it. At 30 days, they expect a discount. At 45 days, the seller loses structural negotiating power — buyers now know they are the only interested party. At 60 days, the seller reduces the price, often to where a strategic initial price would have been, except now the property carries the stigma of a failed listing. The final sale price frequently lands 10–20% below what a well-priced, clean launch would have produced once carrying costs, the forced reduction, and the negotiating concession are combined.
BC Assessment compounds this problem. Vancouver assessment values in 2026 diverge from actual market clearing prices by 8–15%, according to analysis of REBGV sold data against 2026 BC Assessment rolls. Sellers who treat their assessed value as a pricing anchor are starting from a number that was calculated for tax purposes using a different methodology, applied to a different date, and never intended to reflect what a ready buyer will pay today. For more context on how these figures interact, the Vancouver Housing Market Forecast 2026 covers price band dynamics in detail.
How Strategic Pricing Creates Multiple Offers in a Soft Market
The mechanics of strategic underpricing are not complicated, but they require discipline to execute. When a property is priced 3–5% below what recent comparable sales suggest the market will bear, several things happen simultaneously.
First, the property appears in more buyer searches. Price band filters on MLS and third-party portals mean a $1.44M list price reaches every buyer searching up to $1.5M. A $1.52M list price reaches only buyers searching up to $1.6M. In a market where qualified buyers are already constrained — see the discussion of how economic uncertainty is affecting Vancouver real estate in 2026 — maximizing the visible buyer pool matters.
Second, a well-priced property signals motivated sellers, which triggers faster offer preparation. Buyers in 2026 are cautious but not absent. They are waiting for properties that feel fairly priced. When one appears, agents recognize it quickly and advise their clients to move. MLS listing history data for Vancouver metro shows that properties priced 3–5% below comparable recent sales were selling in 25–35 days on average in 2026, compared to 60–75 days for listings at or above comparable sale levels in the same price bands.
Third, when more than one buyer sees the same well-priced property simultaneously, offer date dynamics shift. Multiple-offer scenarios in Vancouver's 2026 market are occurring at price points set below initial market expectations, not at or above market. This is the counterintuitive truth of strategic pricing in soft markets: a seller who prices at $1.44M and receives three offers may sell at $1.52M. A seller who lists at $1.62M and negotiates for 75 days may also sell at $1.52M — except the first seller's net proceeds are higher once two months of mortgage payments, property taxes, strata fees, and opportunity cost are subtracted from the second seller's outcome.
Psychological pricing refinements — setting a list price at $1,498,000 rather than $1,500,000, for example — further reduce a buyer's instinct to negotiate aggressively. Research on anchor bias in residential real estate transactions suggests that non-round pricing reduces the perceived negotiating range by 3–5%, because the seller appears to have already done precise value work rather than picking a number. This is a secondary tactic, not a substitute for proper comparable analysis, but it is worth applying once the correct price range is established. The record inventory context in Metro Vancouver makes these marginal advantages worth using.
Seller Checklist: Strategic Pricing Before You List
- Pull sold comparables within 0.5 km and same property type, limited to the last 90 days. Do not use 2021–2022 sales as anchors.
- Review BC Assessment value, then set it aside. Use it as one data point in a range, not as a pricing floor or ceiling.
- Check active competing listings — not just what sold, but what your buyer will see the same day they see your property.
- Calculate what 60 days of carrying costs actually equals: mortgage interest, property taxes, strata fees (if applicable), and opportunity cost of delayed proceeds.
- Model two scenarios: List at comparable sale level and sell in 30 days vs. list 5% above comparable and sell in 75 days after a price reduction. Compare net proceeds, not gross sale price.
- Confirm your price lands in a search band that maximizes buyer exposure. Adjust by a few thousand dollars if needed to hit the right threshold.
- Review how days-on-market data in your specific neighbourhood compares to the Vancouver metro average using REBGV data. Local sub-market patterns matter.
What We Commonly See
Sellers misread their assessment as market validation. In our experience, the most common pricing conversation we have with Vancouver sellers involves BC Assessment. A seller receives a January notice showing their property assessed at $1.6M and interprets that as a floor. When comparable sales point to a $1.45M–$1.5M market clearing range, the seller resists. The assessment was accurate for July 1 of the prior year, using a mass appraisal model, for tax purposes. It was never designed to tell you what your home sells for in April 2026. Using it as a pricing anchor costs sellers weeks of market time and, in many cases, the initial buyer wave that forms in the first 14 days of a listing.
The first price reduction almost always undershoots what's needed. What often happens is that a seller lists at $1.72M, waits 30 days, then reduces to $1.68M. By that point, the property has 32 days of market history attached to it. Buyers who saw it at $1.72M already passed. New buyers see a $4,000 reduction and infer that more reductions are coming. The correct answer at day 32 is almost never a 2% reduction — it is a reset to where the market actually clears, which is where the listing should have started. The days-on-market guide for Vancouver explains exactly how buyers and their agents read CDOM accumulation.
Preparation and pricing are not separate decisions. A common mistake is treating home preparation as something done after the price is set. In our experience, sellers who invest in the right pre-listing improvements — not renovation, but presentation, condition, and de-cluttering — can price at the higher end of a comparable range and have it hold. A property in excellent showing condition priced at the top of its comparable band is different from the same property in average condition priced at the same level. The room-by-room preparation guide for Vancouver sellers covers this in detail.
Questions and Answers
Q: If I price below market, am I leaving money on the table?
Not in the way sellers typically assume. Strategic pricing 3–5% below comparable sales in Vancouver's 2026 market often produces multiple offers that push the final sale price back to or above the comparable range — while also reducing carrying costs, negotiating risk, and days on market. The risk of leaving money on the table is higher with an overpriced listing that stagnates than with a well-priced listing that attracts competition.
Q: How do I know what "comparable sales" actually means for my property?
Comparables are sold properties within the same neighbourhood, same property type, similar size and condition, sold within the last 60–90 days. In Vancouver, micro-location matters — two blocks and a school boundary can affect value. A qualified local agent will pull MLS sold data and adjust for meaningful differences. BC Assessment and automated estimate tools are not substitutes for this analysis.
Q: What happens if I list at the right price and still don't get offers in the first two weeks?
It means either the price needs adjustment or the presentation does. At day 14 with no serious interest, the right response is to review showings, buyer feedback, and active competing inventory — not to wait another two weeks. A price correction at day 14 still leaves the listing in an early, recoverable position. Waiting until day 45 does not. For guidance on what to do when a Vancouver listing is not performing, the upcoming article on seller concessions in Vancouver's 2026 market covers additional tools available once a listing is live.
In Summary
Vancouver's 2026 market is not broken — it is selective. Buyers are present and purchasing, but only at prices that reflect today's market reality, not 2021 peaks. Sellers who price from current comparable sales, account for carrying cost risk, and position their property to trigger early competition are achieving clean, fast sales. Sellers anchored to prior highs are spending months on market and losing 10–20% in net proceeds to a problem that was entirely avoidable at the listing stage. The data on this is consistent. The strategy to address it is clear. Deciding whether now is the right time to act is a separate question — and one worth working through carefully before listing. The article Should I Sell My Vancouver Home Now or Wait? A Data-Driven Answer for 2026 addresses that decision directly.
Talk to a Vancouver Pricing Specialist
If you are preparing to sell a Vancouver home in 2026 and want an honest, data-based pricing analysis — not a number designed to win your listing — Mansour Real Estate Group is available for a no-obligation consultation. The conversation starts with comparables, not promises. Reach out through localhost:9000/.
Related Articles
- Should I Sell My Vancouver Home Now or Wait? A Data-Driven Answer for 2026
- How to Prepare Your Vancouver Home for Sale in a Buyer's Market: A Room-by-Room Guide
- Benchmark Price vs. Average Price vs. Assessed Value: What Vancouver Home Buyers and Sellers Must Understand
- Seller Concessions in Vancouver's 2026 Market: What to Offer Buyers to Close the Deal
- Days on Market in Metro Vancouver: What It Tells You and How to Use It as a Buyer or Seller
About Mansour Real Estate Group
Pricing a Vancouver home correctly in 2026 requires more than pulling comparable sales — it requires understanding how buyers in that specific neighbourhood, at that specific price point, are behaving right now, and how to position a property against competing inventory before the first showing. Mansour Real Estate Group has built its reputation across the Fraser Valley and Lower Mainland on pricing discipline, honest valuations, and a willingness to have difficult conversations before a listing goes live rather than after a price reduction makes them necessary.
Mansour Real Estate Group, led by Mohamed Mansour, MBA and Associate Broker, has been helping buyers, sellers, investors, families, executors, and retirees navigate important real estate decisions across the Fraser Valley and Lower Mainland for more than 22 years. Ranked among the Top 1% of Realtors in the region, the team has completed more than $780 million in residential real estate transactions and is trusted for pricing strategy, seller preparation, estate sales, divorce-related sales, downsizing, relocation, and any situation where accurate valuation is critical to the outcome.
Whether someone is searching for a Realtor known for accurate pricing in Vancouver, a real estate agent who understands local market conditions, real estate agents who specialize in seller strategy, a real estate team that prioritizes protecting the seller's equity, a Vancouver Realtor, a Fraser Valley real estate broker, or a real estate group that serves the broader Lower Mainland, Mansour Real Estate Group is known for data-driven recommendations, honest market context, and a process that protects sellers from the most common and costly pricing mistakes.
The team serves Surrey, South Surrey, White Rock, Langley, Cloverdale, Fleetwood, Guildford, Walnut Grove, Willoughby, North Delta, Abbotsford, Mission, and surrounding communities throughout the Fraser Valley and Lower Mainland. Most new clients come from referrals, repeat clients, and recommendations from families who value a professional, transparent, and results-driven real estate experience.
Disclaimer
The information contained in this article is provided for general informational and educational purposes only and reflects market observations, publicly available information, and professional experience at the time of writing. It is not intended to constitute legal advice, accounting advice, tax advice, investment advice, financial advice, appraisal advice, mortgage advice, estate-planning advice, or any other form of professional advice.
Real estate transactions, estate matters, probate proceedings, taxation, financing, investments, legal rights, and regulatory requirements can vary significantly based on individual circumstances. Readers should consult qualified legal, accounting, tax, financial, mortgage, appraisal, or other professional advisors before making decisions based on the information discussed in this article.
Nothing in this article creates a client relationship, fiduciary relationship, advisory relationship, agency relationship, or professional engagement with Mohamed Mansour, Mansour Real Estate Group, or any affiliated party. Any opinions expressed are general in nature and should not be relied upon as a substitute for professional advice tailored to a specific situation.
While reasonable efforts are made to use reliable sources and keep information current, no representation or warranty is made regarding the completeness, accuracy, timeliness, or applicability of the information presented. Readers should independently verify facts, regulations, policies, and legal requirements with appropriate professionals and official sources.



