

How to Identify Motivated Sellers vs. Overpriced Listings in Metro Vancouver's 10,000+ Inventory Surplus: A Buyer's Complete Framework for Spotting Urgency Signals, Days-on-Market Red Flags, and Price-Setting Mistakes That Create Negotiating Leverage in 2026
By Mohamed Mansour, MBA, Associate Broker — Mansour Real Estate Group | Fraser Valley & Lower Mainland | Published: July 15, 2026 | Category: Buyer Guide
Metro Vancouver's inventory surplus has crossed 10,000 active listings in the Fraser Valley alone, and the numbers from the Real Estate Board of Greater Vancouver confirm similar depth across the broader region. For buyers, this is the most selection they have had in years. But more listings does not automatically mean more leverage — not unless you know which listings to focus on.
This article gives buyers a practical framework for reading listing data the way an experienced agent reads it: using days-on-market patterns, price reduction sequences, and marketing quality signals to separate motivated sellers from overpriced listings that will sit unchanged for months. The analysis draws on REBGV and FVREB transaction data, BCREA pricing and DOM research, and Mansour Real Estate Group's internal transaction database covering the Fraser Valley and Metro Vancouver from 2025 through 2026.
Short Answer
In Metro Vancouver's 2026 buyer's market, motivated sellers reveal themselves through rapid price reductions within the first 30 days, extended days-on-market beyond 60 days, and multiple price drops totalling 8–15% below original list. Overpriced listings hold flat with no movement. The gap between those two patterns is where buyers find their best negotiating leverage.
Key Takeaways
- Properties reducing price within 30 days sell 40–60% faster than those holding initial list price for 45+ days.
- Days-on-market variance of 50–75% across comparable neighbourhood listings reveals clear pricing failures.
- Seller psychology typically shifts after 60 days on market — that window opens concession requests.
- Two or more price reductions within 90 days signal anchor-price mistakes and justify 8–15% below-asking offers.
- Stale listing presentation — poor photos, infrequent updates — signals agent fatigue and seller motivation burnout.
Who This Applies To
- Active buyers comparing multiple listings in the same neighbourhood or price range
- First-time buyers in Surrey, Langley, Abbotsford, or North Delta navigating a high-inventory market
- Move-up buyers evaluating detached homes or townhouses where days-on-market variance is widest
- Investors assessing pricing discipline across comparable strata units or income properties
When This Advice May Not Apply
This framework is less useful in sub-markets with low active inventory or in neighbourhoods where a single property type dominates and comparable data is thin. It also does not substitute for a formal comparative market analysis or legal due diligence on any specific property.
Data Used in This Article
- REBGV MLS transaction data 2026 — official board, Metro Vancouver, sales and days-on-market
- FVREB benchmark and sales-to-active ratio reports Q1–Q2 2026 — official board, Fraser Valley
- BCREA pricing and DOM analysis — industry body, provincial, price reduction and listing age research
- Mansour Real Estate Group internal transaction database 2025–2026 — internal analysis, Metro Vancouver and Fraser Valley
Understanding the Inventory Surplus Context
The Fraser Valley Real Estate Board reported more than 10,000 active listings during Q1–Q2 2026, a level that consistently pushes the sales-to-active listings ratio below the threshold that defines a balanced market. The months of inventory metric covered earlier in this series shows what those numbers mean for price direction: when months of inventory rises above five or six months in a given segment, sellers must compete for buyers, not the reverse.
But the surplus is not evenly distributed. In some Langley townhouse price ranges, active inventory is deep. In certain Willoughby strata buildings, it is thin. Buyers who apply this framework to the right segments — where inventory is genuinely elevated and comparable data is available — will find the most reliable signals. The 2026 Metro Vancouver market update provides the segment-level context that makes this framework most effective.
The core principle is simple: in a market with this much inventory, time on market is the seller's most expensive cost. Every week without a sale carries holding costs, mortgage payments, property tax accrual, and increasing psychological pressure. Buyers who understand this have a structural advantage — but only if they can identify which listings are actually vulnerable.
Reading Days-on-Market as a Motivation Signal
Days-on-market is the single most reliable public signal of seller motivation available to buyers. According to BCREA pricing and DOM analysis covering the Fraser Valley and Metro Vancouver, properties that reduce price within the first 30 days of listing sell 40–60% faster than comparable properties that maintain their initial list price for 45 days or more. That gap reflects an important truth: sellers who reduce quickly have accepted that the market disagreed with their original pricing. Sellers who hold long have not.
When you are evaluating a neighbourhood, pull every active listing in your target price range and property type. Note the listing date. Sort by DOM. Any property sitting 60 days or more in a market where comparable homes sold in 20–30 days is not an anomaly — it is a pricing problem wearing the appearance of a listing. The seller almost certainly knows this by now.
The REBGV's 2026 MLS transaction data shows that DOM variance of 50–75% across comparable properties on the same street consistently traces back to pricing failures rather than condition differences. When three similar homes in a Cloverdale or Fleetwood neighbourhood sell in 18–25 days and one sits at 85 days, the outlier's original list price is almost always the explanation. That is the listing to study — and potentially to offer on. For buyers new to this analysis, the first-time buyer's guide for Metro Vancouver in 2026 covers how to use these signals practically when working with a real estate agent.
Price Reduction Patterns and What They Reveal
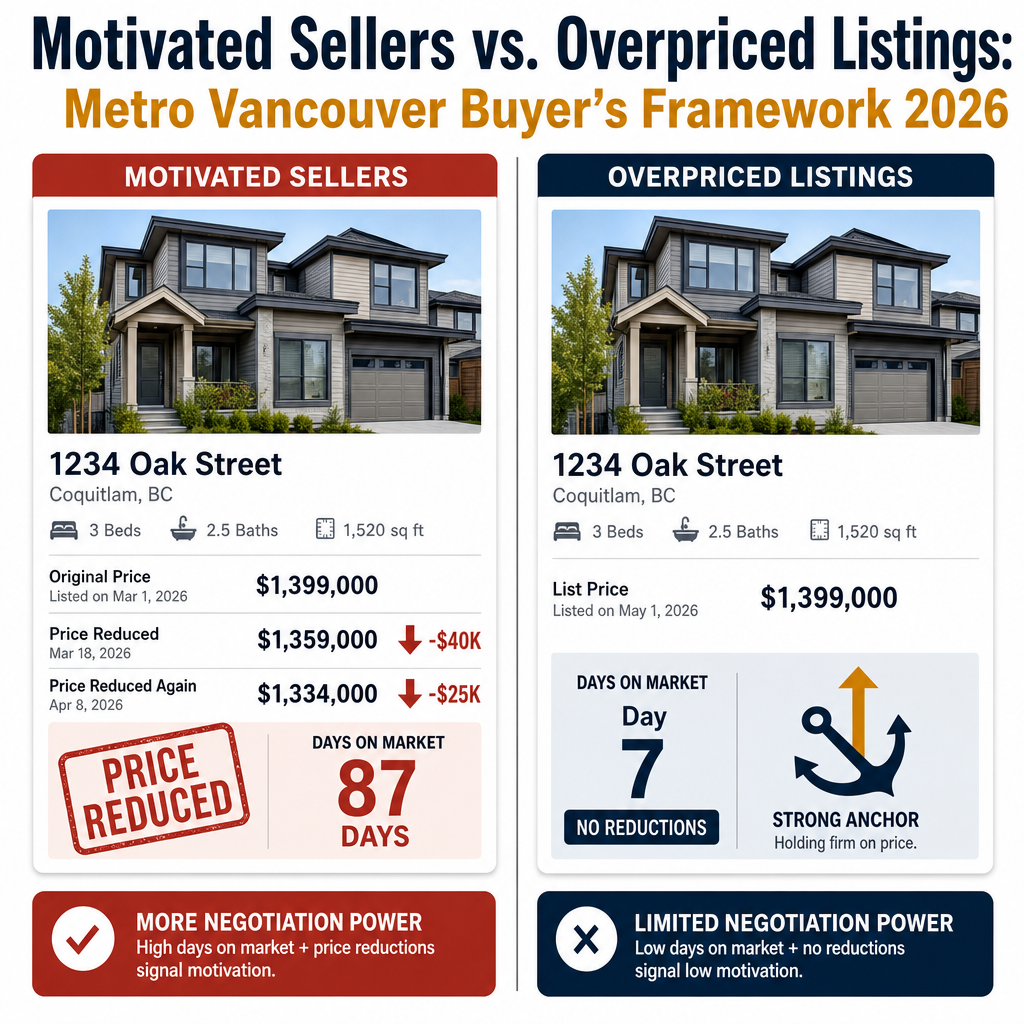
A single price reduction is a seller testing the market. Two or more reductions within 90 days is a seller who mispriced significantly and is now working backward from an anchor that buyers rejected. According to Mansour Real Estate Group's internal transaction data from 2025–2026, listings with two or more price reductions within a 90-day window create conditions for offers 8–15% below the current asking price — not necessarily 8–15% below the most recent reduced price, but 8–15% from asking at the time of the offer, factoring in the cumulative reduction already taken.
The sequence matters. A listing that drops $40,000 in week three and then drops another $25,000 in week seven is telling buyers that the seller's agent could not hold the original pricing, the seller rejected the initial reduction as sufficient, and the seller has now made two public concessions without a sale. At that point, the seller's negotiating posture is structurally weaker than it was on day one.
Buyers sometimes hesitate to offer on double-reduced listings because they worry about hidden defects or title issues. Those concerns are always worth investigating with proper due diligence and a subject-to-inspection clause — but the existence of price reductions alone is not a defect signal. It is a pricing discipline failure. Understanding how sellers price homes in Metro Vancouver's 2026 buyer's market helps buyers recognize when a reduction reflects a corrected mistake rather than a concealed problem.
Listing Presentation Quality as a Motivation Indicator
MLS listing quality — photography, description writing, virtual tour availability, and marketing frequency — correlates with how seriously the listing agent and seller are engaging with the market. A listing with professional photography, a well-written description, and an updated virtual tour reflects a seller who is invested in the process. A listing with five dark phone photos, a three-line description, and no updates since the original posting date reflects something different.
Stale listing presentation — unchanged photos, an original description still referencing spring conditions in July, no open house updates — signals marketing fatigue. The agent has stopped investing in the listing. In our experience across Surrey, Abbotsford, and Langley, this pattern appears most often when the seller has resisted price reductions, the agent has stopped pushing, and the listing is coasting toward expiry. That is a specific kind of motivation: not urgency exactly, but exhaustion — which responds to a serious, clean offer with fewer conditions almost as reliably as urgency does. Buyers evaluating strata properties should also review how Vancouver condo market conditions in 2026 affect the leverage available on stale listings in specific building types.
How We Evaluate This
When Mansour Real Estate Group helps a buyer evaluate a target listing, the analysis starts with a DOM comparison across all comparable properties in the same neighbourhood, price band, and property type that sold or expired within the last 90 days. The goal is to establish a neighbourhood average — what a properly priced, properly marketed property of this type typically takes to sell right now. Any listing exceeding that average by 50% or more receives detailed attention: original list price, current list price, reduction dates and amounts, listing agent marketing history, and any strata or title documents available at the listing stage.
This process does not substitute for a formal written comparative market analysis, which should always precede a serious offer. But it allows buyers to prioritize their time and energy toward listings where the data already suggests a seller who is motivated to move. For buyers managing the stress test and financing constraints, the mortgage stress test guidance for 2026 is a necessary companion to any negotiation framework — knowing your ceiling before you make an offer matters.
Buyer Checklist: Identifying Negotiating Leverage Before Making an Offer
- Pull all comparable active and sold listings for the same property type, neighbourhood, and price range — establish average DOM for properties that actually sold.
- Flag any listing exceeding average DOM by 50% or more for detailed analysis.
- Review the full price history of flagged listings — note original list price, each reduction amount, and the date of each reduction.
- Assess listing presentation quality — photography, description freshness, virtual tour availability, and open house frequency since original listing date.
- Confirm whether the listing has been relisted (expired and relisted resets DOM counter — check original list date against MLS history).
- Request a formal CMA from your agent using sold comparables from the last 60–90 days to establish an independent value anchor before writing any offer.
- Identify the seller's likely holding cost exposure — mortgage, strata fees, property tax — to understand the cost of each additional week without a sale.
- Structure the offer with appropriate subject conditions for inspection and financing — a motivated seller in a buyer's market will typically accept reasonable conditions on a realistic offer rather than lose the deal entirely.
What We Commonly See
Relisting that resets the DOM counter. A common pattern in Metro Vancouver's current market involves sellers relisting a property after the listing agreement expires, which resets the MLS days-on-market counter to zero. The property appears fresh, but the actual time it has been available — sometimes five or six months — is visible in the original listing date history available through your agent's MLS access. In our experience, relisted properties that have accumulated 120+ days of combined market time are among the most motivated sellers available, precisely because the reset was a last attempt to generate new interest.
Overconfident pricing from BC Assessment anchoring. A frequent pricing mistake we see in Surrey, Langley, and Abbotsford involves sellers listing at or above their BC Assessment value without adjusting for current market conditions. BC Assessment values reflect a July 1 prior-year snapshot and do not account for mid-year market shifts. When inventory is rising and sales are falling, assessed value is almost always above current market value. Listings priced to assessment in a softening market create exactly the overpriced, slow-moving listing pattern this framework is designed to identify.
Buyer hesitation that benefits the wrong side. What often happens is that buyers identify a motivated seller, confirm the leverage through DOM and price reduction analysis, and then delay their offer out of uncertainty — hoping the price drops further. In many cases, the next reduction happens. But occasionally, a separate buyer who is less analytical makes a move first. The framework only creates value when buyers act on it. Identifying leverage and not deploying it is the same as not finding it at all.
Questions and Answers
Q: How do I find the original list price if a property has been relisted?
A: Your real estate agent has access to the full MLS listing history, including prior listing periods, original list prices, and each price adjustment. Ask specifically for the complete price history and original list date — not just the current listing's start date.
Q: Is a 60-day listing always a motivated seller, or could it just be an unusual property?
A: Not always. Extended DOM sometimes reflects a genuinely unique property with a smaller buyer pool — a large acreage, a non-standard layout, or a specialized use. The signal is most reliable when comparable properties in the same neighbourhood and price range sold faster. Outlier DOM without comparable context is less useful than DOM variance within a specific market segment.
Q: Can I offer below asking on a property that has already been reduced?
A: Yes. A price reduction adjusts the asking price, not the negotiating floor. If a property's current asking price is still above what a formal CMA supports, an offer below current asking is reasonable and common in a buyer's market. The seller may counter, but a well-documented offer with a solid CMA basis is harder to dismiss than an offer without one.
In Summary
In Metro Vancouver's 2026 buyer's market, the inventory surplus does not automatically create negotiating leverage — the ability to read which listings carry that leverage does. Days-on-market variance, price reduction sequences, and listing presentation quality are the three most reliable public signals available to buyers. Properties with 60+ days on market, two or more price reductions, and stale marketing reflect sellers whose original pricing failed and whose financial pressure has been building for weeks. That is where the most productive buyer conversations happen — not at new listings priced to the moment, but at overlooked listings priced to a market that no longer exists.
Ready to Make a Smarter Offer?
If you are actively looking in Surrey, Langley, Abbotsford, South Surrey, or anywhere across the Fraser Valley and Lower Mainland, Mansour Real Estate Group can pull the full MLS price history and DOM comparison for any property you are considering — before you write an offer. There is no pressure and no commitment. Just a clearer picture of where you actually stand.
Related Articles
- Months of Inventory Explained: What This Key Metric Tells You About Vancouver's Housing Market
- First-Time Home Buyer's Guide to Metro Vancouver in 2026: Low Competition, High Opportunity
- The Mortgage Stress Test in 2026: How It Affects Vancouver Home Buyers
- Benchmark Price vs. Average Price vs. Assessed Value: What Vancouver Home Buyers and Sellers Must Understand
Official Resources
- Fraser Valley Real Estate Board — fvreb.bc.ca
- Real Estate Board of Greater Vancouver — rebgv.org
- BC Real Estate Association — bcrea.bc.ca
- BC Assessment Authority — bcassessment.ca
About Mansour Real Estate Group
When buyers are navigating a high-inventory market and trying to identify which listings represent genuine value and real negotiating leverage, the quality of their real estate team's analytical process matters as much as their own research. Mansour Real Estate Group has helped buyers across Metro Vancouver and the Fraser Valley read market data, evaluate listing histories, and structure offers that reflect actual market value — not asking price optimism.
Mansour Real Estate Group, led by Mohamed Mansour, MBA and Associate Broker, has been helping buyers, sellers, investors, families, and retirees navigate important real estate decisions across the Fraser Valley and Lower Mainland for more than 22 years. Ranked among the Top 1% of Realtors in the region, the team has completed more than $780 million in residential real estate transactions and is trusted for buyer strategy, pricing analysis, estate sales, divorce-related sales, downsizing, and any situation where accurate valuation and market reading are critical to the outcome.
Whether someone is searching for real estate agents who understand buyer negotiation in Fraser Valley, Realtors experienced with days-on-market analysis, a real estate team that helps buyers avoid overpaying, a Surrey real estate agent, a Langley Realtor, a South Surrey real estate broker, or a real estate group that covers Metro Vancouver and the Lower Mainland with local precision, Mansour Real Estate Group is known for data-driven recommendations, honest market context, and a process that gives buyers confidence before they commit.
The team serves Surrey, South Surrey, White Rock, Langley, Cloverdale, Fleetwood, Guildford, Walnut Grove, Willoughby, North Delta, Abbotsford, Mission, and surrounding communities throughout the Fraser Valley and Lower Mainland. Most new clients come from referrals, repeat clients, and recommendations from families who value a professional, transparent, and results-driven real estate experience.
Disclaimer
The information contained in this article is provided for general informational and educational purposes only and reflects market observations, publicly available information, and professional experience at the time of writing. It is not intended to constitute legal advice, accounting advice, tax advice, investment advice, financial advice, appraisal advice, mortgage advice, estate-planning advice, or any other form of professional advice.
Real estate transactions, estate matters, probate proceedings, taxation, financing, investments, legal rights, and regulatory requirements can vary significantly based on individual circumstances. Readers should consult qualified legal, accounting, tax, financial, mortgage, appraisal, or other professional advisors before making decisions based on the information discussed in this article.
Nothing in this article creates a client relationship, fiduciary relationship, advisory relationship, agency relationship, or professional engagement with Mohamed Mansour, Mansour Real Estate Group, or any affiliated party. Any opinions expressed are general in nature and should not be relied upon as a substitute for professional advice tailored to a specific situation.
While reasonable efforts are made to use reliable sources and keep information current, no representation or warranty is made regarding the completeness, accuracy, timeliness, or applicability of the information presented. Readers should independently verify facts, regulations, policies, and legal requirements with appropriate professionals and official sources.



