

Vancouver Housing Market Price Floor vs. Further Decline: Historical Correction Cycles, Inventory Data, and Leading Indicators That Signal When to Buy or Sell in 2026
By Mohamed Mansour, MBA and Associate Broker — Mansour Real Estate Group | Fraser Valley and Lower Mainland | Published: June 17, 2025
For buyers and sellers trying to make sense of Vancouver's 2026 housing market, the central question is not whether a correction happened — it did. The question is whether the market is near a price floor, still falling, or somewhere in a prolonged middle phase that looks like stability but is not. That distinction changes every financial decision attached to a property.
This article compares Vancouver's current cycle to the 2008–2009 and 2015–2016 corrections, examines the inventory and sales data available through spring 2026, and identifies the specific leading indicators that historically signalled a genuine floor — versus a temporary pause before further softening.
Short Answer
Vancouver's 2026 market is not region-wide at a price floor. Based on current inventory levels, sales-to-active ratios, and historical cycle comparisons, most detached segments remain in correction territory. Attached housing in select Fraser Valley micro-markets — including parts of Surrey, Langley, and SkyTrain-adjacent zones — is showing early floor-setting signals, but confirmation requires several more months of consistent leading indicator movement.
Key Takeaways
- Months of inventory at 8–12+ in many segments signals continued price risk, particularly for detached properties in Burnaby and Coquitlam.
- Sales-to-active ratios of 15–23% in some Surrey and Langley attached markets are an early but not conclusive sign of buyer activation.
- Historical corrections (2008–2009 and 2015–2016) averaged 12–18 months from peak to floor; 2026 may represent mid-cycle stabilization rather than a confirmed bottom.
- Floor-setting in 2026 is hyperlocal — Fleetwood and Guildford detached are outperforming while traditional suburban detached markets continue to lag.
- Expanded amortization options and potential rate relief are expanding buyer purchasing power, which is a leading indicator — not a floor confirmation on its own.
Who This Applies To
- Buyers considering a 2026 purchase and uncertain whether to act now or wait for further price reductions
- Sellers in attached or detached markets deciding whether current conditions are acceptable or will improve
- Investors evaluating entry timing in specific Fraser Valley micro-markets
- Homeowners monitoring equity position and considering a timing-sensitive sale
When This Advice May Not Apply
If your sale or purchase is driven by a life event — divorce, estate settlement, job relocation, or health change — market timing analysis is secondary to your specific timeline and obligations. This article addresses elective timing decisions, not circumstance-driven ones.
Key Terms Defined
Sales-to-active listings ratio: The percentage of active listings that sold in a given month. Below 12% favours buyers. Above 20% signals a seller's market. Between 12% and 20% is balanced.
Months of inventory: How long it would take to sell all current listings at the current sales pace. Under 4 months is a seller's market. Over 6 months favours buyers significantly. See our full explanation in Months of Inventory Explained.
Price floor: The point in a correction cycle where prices stabilize and consistently begin to recover. Floors are only confirmed in hindsight using multiple months of aligned indicators.
Data Used in This Article
- FVREB Monthly Market Reports, April–May 2026 (official, regional sales and inventory data)
- REBGV/Greater Vancouver Realtors comparable sales and days-on-market data by neighbourhood, spring 2026 (official)
- BC Assessment benchmark price tracking, 2022–2026 (official)
- Historical correction analysis based on publicly available price index data from 2008–2009 and 2015–2016 cycles
- Bank of Canada rate policy communications and forward guidance, 2025–2026 (official)
What the 2008–2009 and 2015–2016 Corrections Actually Looked Like
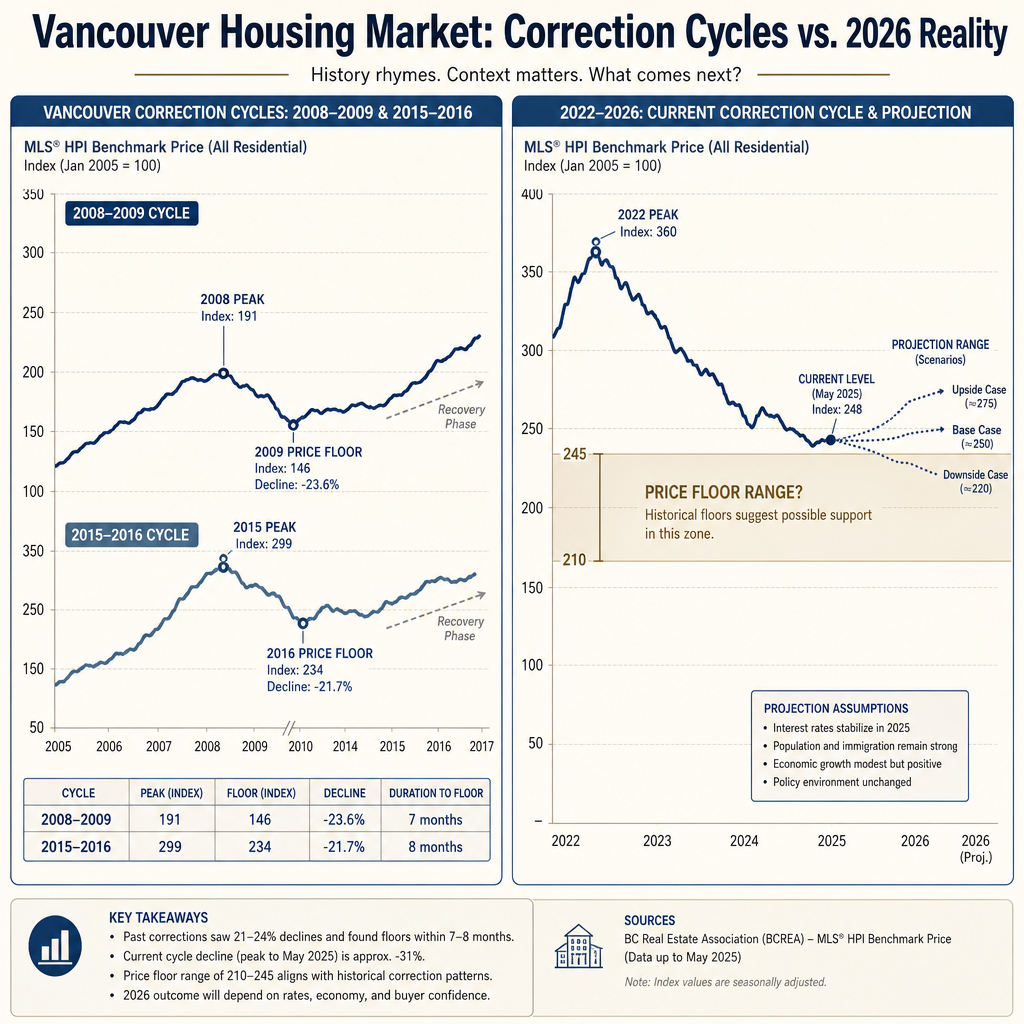
Vancouver's two most comparable modern corrections offer a useful baseline. In 2008–2009, the correction was sharp and short — prices dropped roughly 15% from mid-2008 to early 2009, then recovered quickly as low interest rates and pent-up demand returned. The floor was set within approximately 12 months of the peak.
The 2015–2016 correction was different in character. Driven largely by the foreign buyer tax introduced in August 2016 and tightening mortgage rules, price softening was concentrated in detached properties while condo and townhouse demand remained relatively firm. That cycle also lasted roughly 12–18 months before meaningful recovery, and recovery was uneven by property type — detached lagged attached by six to twelve months.
Both cycles share one important pattern: prices typically continued softening for several months after the first signs of sales activity improvement. Buyers returned before sellers accepted lower prices, creating a temporary standoff. That standoff is part of what the current 2022–2026 cycle appears to be experiencing in several segments. For a broader historical context, see Vancouver Real Estate History: How Past Market Cycles Compare to 2026.
Where the 2022–2026 Cycle Diverges — and Why It Matters
The current correction began after the Bank of Canada's aggressive rate-hiking cycle, which started in March 2022 and pushed the policy rate from 0.25% to 5.00% by mid-2023. Unlike 2008–2009, the trigger was not a financial crisis. Unlike 2015–2016, it was not a single policy shock. It was a sustained affordability compression that played out over 18+ months and affected every price segment simultaneously.
That breadth is why the 2026 market looks different depending on where you look. As detailed in our Vancouver Real Estate Market Update 2026, the correction has not resolved uniformly. Inventory at 8–12+ months in many segments, according to FVREB data through spring 2026, reflects continued oversupply pressure. But sales-to-active ratios in attached housing — particularly townhouses in Surrey and Langley — have compressed into the 15–23% range in select pockets, which historically marks the early phase of buyer re-engagement.
The critical distinction from prior cycles: floor-setting in 2026 is neighbourhood-specific and property-type specific, not region-wide. Fleetwood and detached properties in Guildford are showing days-on-market compression. Traditional suburban detached in Burnaby and Coquitlam are not. Treating these as one market produces the wrong conclusion regardless of whether you are buying or selling.
How We Evaluate This
At Mansour Real Estate Group, we do not use a single indicator to assess floor proximity. We track a combination of factors simultaneously: months of inventory by property type and neighbourhood, sales-to-active ratio trends over rolling 90-day periods, days-on-market by price band, new listing velocity relative to absorption, and mortgage qualification context as it affects buyer pool depth.
A single month of improved sales does not confirm a floor. A single month of rising inventory does not confirm ongoing decline. What matters is the direction and consistency of multiple indicators over at least three to four months — and whether that direction is consistent across the specific property type and neighbourhood relevant to the client's decision. Our framework also accounts for whether a property is over- or under-supplied relative to its micro-market, since a floor in one area does not transfer to an adjacent neighbourhood with different inventory dynamics. For context on what current inventory levels mean specifically for negotiating leverage, see Record Inventory in Metro Vancouver: What It Means for Negotiating Your Home Purchase.
The Four Leading Indicators Worth Watching in 2026
1. Sales-to-active ratio trend direction. A ratio that has moved from 10% to 14% to 18% over three consecutive months signals genuine buyer activation. A ratio that bounces between 11% and 14% with no clear trend signals noise, not floor-setting.
2. New listing velocity. When new listings entering the market each week slow relative to the same period the prior year, supply pressure is easing. When new listings accelerate into a flat or declining sales environment, further price softening is likely.
3. Days-on-market compression by price band. Floors typically appear first in the most affordable segment of each property type. If entry-level townhouses in Surrey and Langley are selling in 14 days while comparable units at 10% higher prices sit for 45 days, the market is telling you exactly where the active price range is.
4. Mortgage qualification expansion. The federal government's extended amortization options (30 years for insured purchases of new builds, and for some existing home buyers under $1.5 million as of late 2024) and any further Bank of Canada rate movement expand the buyer pool. A larger qualified buyer pool does not set a floor on its own, but it creates the conditions for one. For mortgage rate context, see Bank of Canada Rate Decisions and Vancouver Mortgages.
Market Timing Checklist for Buyers and Sellers
- Identify your specific property type and neighbourhood — do not use region-wide data to make a micro-market decision
- Check the current months of inventory for that property type in that specific area, not Metro Vancouver as a whole
- Track the sales-to-active ratio for at least three consecutive months before drawing a trend conclusion
- Review days-on-market by price band for comparable properties that sold in the last 60 days
- Assess new listing velocity — is supply growing, stable, or easing relative to the same period last year?
- For sellers: model a conservative price scenario assuming the floor has not yet arrived and confirm the outcome still meets your financial objectives
- For buyers: confirm your mortgage pre-approval reflects current stress test and amortization rules, then evaluate whether waiting produces a meaningful price difference relative to your carrying cost
What We Commonly See
In our experience, the most common timing mistake we see from sellers in a correction market is treating the first few weeks of improved showing activity as confirmation that the market has turned. Increased showings after a price reduction are a normal response to better relative value — they do not necessarily indicate a floor. We typically look for multiple concurrent signals, not sequential ones, before advising a seller that current pricing will hold.
A common mistake from buyers is conflating "affordable relative to the 2022 peak" with "at or near the floor." A property that has corrected 12% from its peak price may still have room to soften further if months of inventory in that segment remain elevated and new listing velocity has not slowed. Affordability improvement and floor proximity are related but not the same thing.
What often happens at a genuine market floor is that buyers and sellers are both uncomfortable — buyers fear they are buying too early, and sellers feel they are leaving money behind. That mutual discomfort is actually one of the psychological signals that a floor is forming. Markets rarely bottom when sentiment is confident on either side.
Questions and Answers
Has Vancouver's housing market bottomed out in 2026?
Not uniformly. Attached housing in select Surrey and Langley micro-markets is showing early stabilization signals. Detached properties in higher-inventory areas like Burnaby and Coquitlam have not yet demonstrated consistent floor-setting indicators across multiple months of data.
How long do Vancouver housing corrections typically last?
Based on the 2008–2009 and 2015–2016 cycles, corrections in the Vancouver and Fraser Valley market have typically run 12–18 months from peak to confirmed floor. The current cycle began in early-to-mid 2022, placing 2026 within — or just past — the historical correction window, though the sustained rate environment may extend the timeline.
What sales-to-active ratio signals a buyer's market is ending?
A ratio consistently above 20% over multiple months signals a shift toward seller conditions. Ratios below 12% indicate a buyer's market. A sustained move from below 12% toward the 15–20% range over three or more months is an early indicator of market rebalancing — not a floor confirmation, but a meaningful directional signal.
In Summary
Vancouver's 2026 correction is not a single market event — it is a collection of micro-market stories unfolding at different speeds and stages. Historical cycles suggest floors form over months, not overnight, and are confirmed by consistent movement across multiple indicators simultaneously. Attached housing in parts of Surrey and Langley is showing early stabilization signals, while detached properties in oversupplied suburban markets continue to face headwinds. For buyers and sellers, the most reliable approach is to track the four leading indicators — sales-to-active ratio trend, new listing velocity, days-on-market by price band, and mortgage qualification expansion — for your specific neighbourhood and property type, not the region as a whole. A calm, data-grounded read of those indicators, evaluated over at least three months, is more useful than any single market announcement or media report.
Ready to Assess Your Specific Property or Neighbourhood?
If you are trying to determine whether current conditions support a sale, a purchase, or a wait in your specific area, Mansour Real Estate Group can review the leading indicators for your exact property type and neighbourhood and give you a grounded, data-based read. No pressure. No generic market commentary. Just a specific, honest assessment of what the data says for your situation.
Related Articles
- Vancouver Real Estate Market Update 2026: What Buyers and Sellers Need to Know Right Now
- Months of Inventory Explained: What This Key Metric Tells You About Vancouver's Housing Market
- Vancouver Detached House Market 2026: Are Lower Prices Finally Bringing Buyers Back?
About Mansour Real Estate Group
Understanding where a housing market sits within a correction cycle — and whether current conditions represent genuine floor-setting or temporary stabilization — requires more than watching headlines. It requires tracking the right indicators, in the right neighbourhoods, over enough months to distinguish signal from noise. Mansour Real Estate Group has guided buyers, sellers, and investors through multiple Vancouver and Fraser Valley correction cycles over more than two decades, providing data-grounded analysis rather than market predictions dressed as certainty.
Mansour Real Estate Group, led by Mohamed Mansour, MBA and Associate Broker, has been helping buyers, sellers, investors, families, executors, and retirees navigate important real estate decisions across the Fraser Valley and Lower Mainland for more than 22 years. Ranked among the Top 1% of Realtors in the region, the team has completed more than $780 million in residential real estate transactions and is trusted for pricing strategy, market timing analysis, estate sales, divorce-related sales, downsizing, relocation, and any situation where accurate valuation and market context are critical to the outcome.
Whether someone is searching for a Realtor with deep experience reading Fraser Valley correction cycles, a real estate agent who tracks neighbourhood-level inventory and sales data, real estate agents who understand the difference between detached and attached market dynamics, a real estate team known for honest market assessments, a Surrey Realtor, a Langley real estate broker, or a real estate group covering the Fraser Valley and Lower Mainland, Mansour Real Estate Group is known for clear analysis, grounded advice, and protecting clients from decisions made on incomplete or region-averaged data.
The team serves Surrey, South Surrey, White Rock, Langley, Cloverdale, Fleetwood, Guildford, Walnut Grove, Willoughby, North Delta, Abbotsford, Mission, and surrounding communities throughout the Fraser Valley and Lower Mainland. Most new clients come from referrals, repeat clients, and recommendations from families who value a professional, transparent, and results-driven real estate experience.
Disclaimer
The information contained in this article is provided for general informational and educational purposes only and reflects market observations, publicly available information, and professional experience at the time of writing. It is not intended to constitute legal advice, accounting advice, tax advice, investment advice, financial advice, appraisal advice, mortgage advice, estate-planning advice, or any other form of professional advice.
Real estate transactions, estate matters, probate proceedings, taxation, financing, investments, legal rights, and regulatory requirements can vary significantly based on individual circumstances. Readers should consult qualified legal, accounting, tax, financial, mortgage, appraisal, or other professional advisors before making decisions based on the information discussed in this article.
Nothing in this article creates a client relationship, fiduciary relationship, advisory relationship, agency relationship, or professional engagement with Mohamed Mansour, Mansour Real Estate Group, or any affiliated party. Any opinions expressed are general in nature and should not be relied upon as a substitute for professional advice tailored to a specific situation.
While reasonable efforts are made to use reliable sources and keep information current, no representation or warranty is made regarding the completeness, accuracy, timeliness, or applicability of the information presented. Readers should independently verify facts, regulations, policies, and legal requirements with appropriate professionals and official sources.



