

Months of Inventory Explained: How to Calculate and Interpret Metro Vancouver's 8+ Month Reading and What It Really Means for Buyers and Sellers in 2026
By Mohamed Mansour, MBA and Associate Broker | Mansour Real Estate Group | Fraser Valley and Lower Mainland | Published: July 15, 2025
If you want to understand where a real estate market is heading — not where it has been — months of inventory is the single most useful number to watch. It tells you how long it would take to sell every active listing at the current pace of sales. Right now, Metro Vancouver sits above 8 months. That number puts the region firmly in buyer's market territory, well past the tipping point where sellers hold pricing leverage.
This article explains exactly what months of inventory measures, how to calculate it, what the current reading means in practical terms, and how buyers and sellers in Surrey, Langley, Abbotsford, and across the Fraser Valley should be thinking about it. For broader context on current conditions, see the Vancouver Real Estate Market Update 2026.
Short Answer
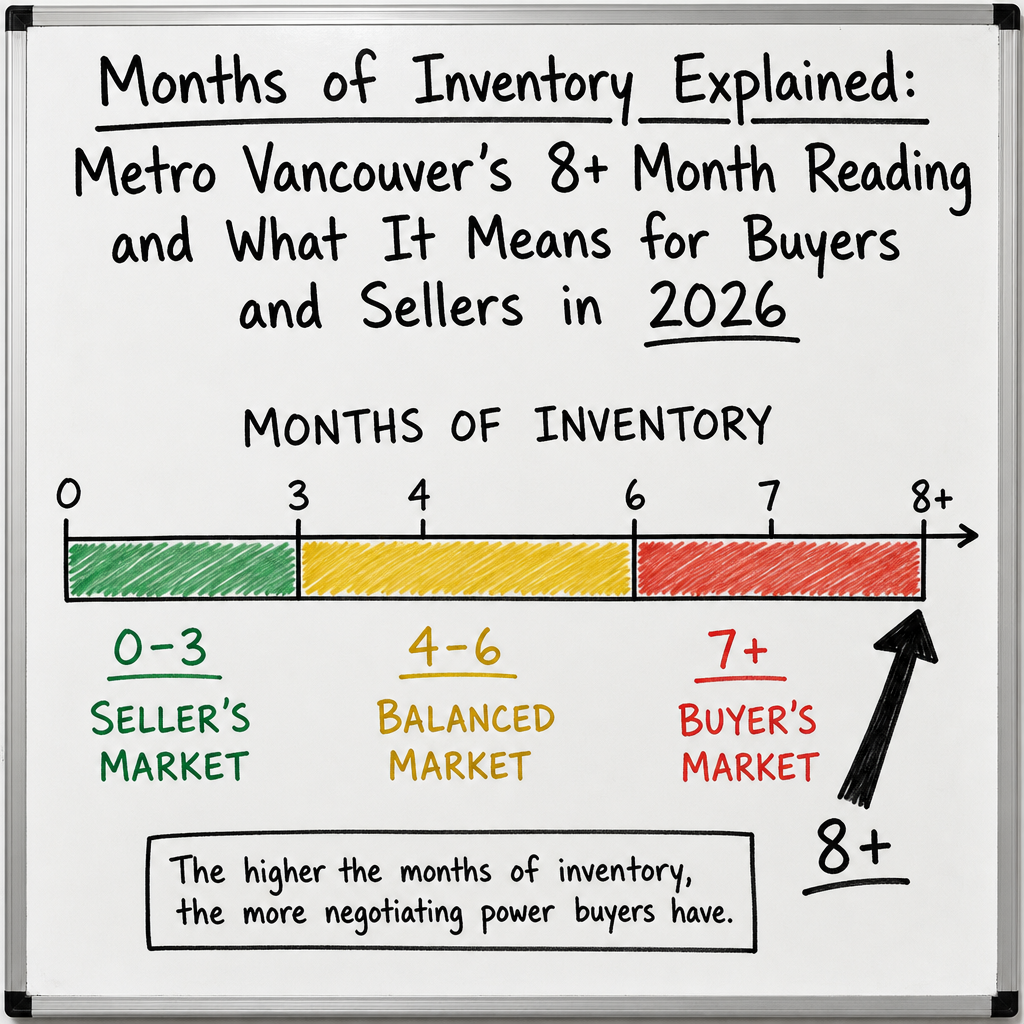
Months of inventory is calculated by dividing active listings by average monthly sales. Metro Vancouver's current reading above 8 months places the market well inside buyer's market territory — traditionally defined as 7 months or higher. At this level, buyers gain negotiating power on price, conditions, and timelines. Sellers who do not price accurately relative to current absorption risk extended market time and eventual price reductions.
Key Takeaways
- Months of inventory = Active Listings ÷ Average Monthly Sales; 8+ signals a strong buyer's market.
- Traditional thresholds: under 4 months favors sellers, 4–6 is balanced, 7+ favors buyers.
- This metric leads price changes by 4–8 weeks, making it more predictive than current benchmark prices.
- An 8+ month reading typically means longer days-on-market, subject conditions, and seller concessions.
- Recovery to a balanced market requires sustained sales growth or a meaningful drop in active listings.
Who This Applies To
- Sellers deciding whether to list now or wait for conditions to improve
- Buyers evaluating how much negotiating leverage they actually have
- Homeowners monitoring whether Metro Vancouver prices are likely to soften further
- Investors assessing entry timing across Fraser Valley sub-markets
- Anyone comparing what they hear in headlines to what the underlying data actually shows
When This Advice May Not Apply
Regional averages mask sub-market variation. A neighbourhood or property type — such as townhouses in Willoughby or detached homes in South Surrey — may have a different months of inventory reading than the Metro Vancouver aggregate. Property-specific analysis always matters more than the headline number.
Data Used in This Article
- Real Estate Board of Greater Vancouver (REBGV) — monthly market reports, active listings, and sales data; official source
- Fraser Valley Real Estate Board (FVREB) — months-of-inventory calculations and regional market statistics; official source
- Canadian Real Estate Association (CREA) — national market condition definitions and threshold benchmarks; official source
- Bank of Canada — mortgage market research on buyer purchasing power; official source
How to Calculate Months of Inventory
The calculation is straightforward: divide total active listings by average monthly sales volume. If a market has 10,000 active listings and sells 1,200 homes per month, months of inventory equals 8.3 months. That single number tells you how long the existing pool of homes would take to clear — assuming no new listings enter the market.
Both the REBGV and the FVREB publish this figure monthly as part of their market statistics packages. It is among the most reliable forward-looking indicators because it captures two things simultaneously: how much supply exists and how strong demand currently is.
When sales slow and listings accumulate — as they have across Metro Vancouver through 2025 and into 2026 — the number climbs. When buyers return and listings are absorbed quickly, it falls. The direction of that movement, sustained over two or three months, tells you where pricing pressure is heading before benchmark prices reflect it.
What the Three Market Zones Actually Mean
CREA and regional boards have long used a consistent framework for interpreting months of inventory readings:
Under 4 months — seller's market: Inventory clears quickly. Buyers compete. Prices rise. Multiple offers are common. Sellers can set firm terms.
4 to 6 months — balanced market: Neither side holds clear advantage. Prices tend to track inflation. Negotiation is possible but limited. Days on market are moderate.
7 months or more — buyer's market: Inventory accumulates faster than it is absorbed. Prices stagnate or fall. Buyers can include subject conditions, negotiate on price, and request concessions. Sellers who price optimistically often sit on the market for weeks before adjusting. At 8+ months — where Metro Vancouver sits now — that buyer advantage is well-established and unlikely to reverse quickly. Understanding this context is also important for buyers evaluating negotiating strategies, which is covered in more depth in Record Inventory in Metro Vancouver: What It Means for Negotiating Your Home Purchase.
Why This Metric Leads Price Data by 4 to 8 Weeks
Benchmark prices reflect completed sales. By the time a price shift appears in REBGV or FVREB data, it has already happened in the market — the offers were written weeks earlier. Months of inventory captures what is happening right now in terms of supply pressure and buyer demand.
When months of inventory climbs above 7, downward price pressure typically follows within 4 to 8 weeks as sellers begin reducing to attract buyers. When it drops below 4, upward pressure builds. Tracking the direction of the metric across consecutive months reveals the trend — which matters more than any single month's reading.
For buyers, a rising months-of-inventory reading while prices have not yet moved represents a window. For sellers, it is a signal that waiting for prices to recover while inventory stays elevated is a strategy with real carrying costs. For both groups, the question of whether conditions are approaching a turning point is explored in Is Metro Vancouver Real Estate Approaching a Market Bottom in 2026?
How We Evaluate This
At Mansour Real Estate Group, we track months of inventory at the sub-market level — not just the Metro Vancouver aggregate. A detached home in Cloverdale, a condo in Guildford, and a townhouse in Willoughby can each carry a different reading within the same month. We use those property-type and neighbourhood-specific numbers to advise on pricing strategy, offer positioning, and timing decisions.
When months of inventory has been elevated for three or more consecutive months, we treat that as a structural market condition, not a temporary fluctuation. The current Metro Vancouver reading has been above 7 months for an extended period, which changes how we approach both seller pricing conversations and buyer offer strategy. For pricing implications specifically, see How to Price Your Home to Sell in Metro Vancouver's 2026 Buyer's Market.
Seller Checklist: Reading Months of Inventory Before You List
- Check the current months-of-inventory figure for your specific property type and neighbourhood — not just the regional average
- Ask your agent to show you the trend over the past 3 months, not just the most recent reading
- Compare your home's list price to recent solds — not recent listings, which may also be overpriced
- Understand that at 7+ months, aggressive pricing typically adds market time without adding sale price
- Factor in carrying costs if you list at an aspirational price and wait 60–90 days for the market to catch up
- Ask what absorption looks like specifically for homes in your price range, not the entire market
What We Commonly See
Sellers confuse list-price activity with market strength. In our experience, when months of inventory is high, new listings still generate showings — especially in the first two weeks. Sellers sometimes interpret that early activity as validation of their price, only to see showings drop off sharply when no offers materialize. The activity was buyers comparing, not buyers ready to commit at that price.
Buyers underuse subject conditions when they have the leverage to include them. What often happens is that buyers who spent years losing in multiple-offer situations continue to write clean offers out of habit, even when the market no longer requires it. In an 8+ month environment, subject to financing and subject to inspection are reasonable inclusions that do not typically cost the deal.
Both sides treat the metric as a national number. A common mistake is reading a Metro Vancouver headline and assuming it applies equally to a townhouse in Walnut Grove and a condo in Burnaby. The aggregate masks meaningful variation. A property in a tighter sub-market may sit at 4 or 5 months while the regional figure reads 8+.
Questions and Answers
Q: Is Metro Vancouver's 8+ months of inventory a temporary spike or a sustained condition?
Based on REBGV and FVREB data, inventory has been elevated above the 7-month threshold for multiple consecutive months. That pattern reflects structural conditions — subdued sales volume and persistent listings accumulation — not a brief seasonal fluctuation. Recovery to balanced territory typically requires either sustained sales growth or a meaningful drop in new listings over several months.
Q: Does months of inventory apply the same way to condos and detached homes?
No. Each property type carries its own reading. In 2026, Metro Vancouver condos have been among the most inventory-heavy segments, while some townhouse sub-markets — particularly in the Fraser Valley — are showing tighter supply. Always ask for property-type-specific figures before making pricing or offer decisions.
Q: If months of inventory is high, does that mean prices have already dropped significantly?
Not necessarily — yet. The metric leads price data, meaning the pressure exists before the price move shows up in benchmark statistics. In some segments, prices have softened. In others, sellers are still holding firm. The lag between inventory conditions and recorded prices is why months of inventory is more useful for anticipating direction than confirming it after the fact.
In Summary
Months of inventory is not a complicated metric, but it is one of the most honest signals a real estate market produces. Metro Vancouver's 8+ month reading reflects a market where supply is meaningfully outpacing demand — a condition that gives buyers negotiating power and requires sellers to price with accuracy rather than optimism. Tracking this number at the sub-market and property-type level, rather than relying on the regional headline, is where the real decision-making insight lives. Whether you are buying, selling, or simply trying to understand where the market is heading, this metric deserves to be part of your analysis.
Talk to a Team That Reads the Market the Same Way Every Month
If you want to understand what the current months-of-inventory reading means for a specific property type or neighbourhood, Mansour Real Estate Group can walk you through the numbers without pressure or agenda. Reach out at localhost:9000/ whenever you are ready to talk.
Related Articles
- Vancouver Real Estate Market Update 2026: What Buyers and Sellers Need to Know Right Now
- Is Metro Vancouver Real Estate Approaching a Market Bottom in 2026?
- Record Inventory in Metro Vancouver: What It Means for Negotiating Your Home Purchase
Official Resources
- Real Estate Board of Greater Vancouver — Monthly Market Reports
- Fraser Valley Real Estate Board — Market Statistics
- Canadian Real Estate Association — National Market Conditions
- Bank of Canada — Interest Rates and Monetary Policy
About Mansour Real Estate Group
When buyers and sellers are trying to understand what a market metric like months of inventory actually means for their decision, they need a real estate team that reads the data the same way every month — not one that interprets conditions based on what is convenient to say. Mansour Real Estate Group has been providing Fraser Valley and Lower Mainland buyers, sellers, and investors with grounded, specific, data-supported market insight for more than 22 years, through multiple market cycles and major economic shifts.
Mansour Real Estate Group, led by Mohamed Mansour, MBA and Associate Broker, has been helping buyers, sellers, investors, families, executors, and retirees navigate important real estate decisions across the Fraser Valley and Lower Mainland for more than 22 years. Ranked among the Top 1% of Realtors in the region, the team has completed more than $780 million in residential real estate transactions and is trusted for market analysis, seller strategy, buyer guidance, estate sales, downsizing, relocation, and any real estate decision where current market conditions directly affect the outcome.
Whether someone is searching for Realtors who can interpret current inventory conditions in plain language, a real estate agent with a data-driven approach to pricing in a buyer's market, real estate agents experienced with Fraser Valley and Metro Vancouver market cycles, a trusted real estate team for a sale or purchase in today's conditions, a Surrey Realtor, a Langley real estate broker, or a real estate group that serves the broader Lower Mainland, Mansour Real Estate Group is known for honest market interpretation, evidence-based pricing, and advice that puts the client's actual outcome first.
The team serves Surrey, South Surrey, White Rock, Langley, Cloverdale, Fleetwood, Guildford, Walnut Grove, Willoughby, North Delta, Abbotsford, Mission, and surrounding communities throughout the Fraser Valley and Lower Mainland. Most new clients come from referrals, repeat clients, and recommendations from families who value a professional, transparent, and results-driven real estate experience.
Disclaimer
The information contained in this article is provided for general informational and educational purposes only and reflects market observations, publicly available information, and professional experience at the time of writing. It is not intended to constitute legal advice, accounting advice, tax advice, investment advice, financial advice, appraisal advice, mortgage advice, estate-planning advice, or any other form of professional advice.
Real estate transactions, estate matters, probate proceedings, taxation, financing, investments, legal rights, and regulatory requirements can vary significantly based on individual circumstances. Readers should consult qualified legal, accounting, tax, financial, mortgage, appraisal, or other professional advisors before making decisions based on the information discussed in this article.
Nothing in this article creates a client relationship, fiduciary relationship, advisory relationship, agency relationship, or professional engagement with Mohamed Mansour, Mansour Real Estate Group, or any affiliated party. Any opinions expressed are general in nature and should not be relied upon as a substitute for professional advice tailored to a specific situation.
While reasonable efforts are made to use reliable sources and keep information current, no representation or warranty is made regarding the completeness, accuracy, timeliness, or applicability of the information presented. Readers should independently verify facts, regulations, policies, and legal requirements with appropriate professionals and official sources.



