

How to Interpret Sales-to-Active Listings Ratio Shifts in Real Time: What BC's Current Ratio Tells You About Actual Market Direction vs. False Signals — And Why Month-to-Month Movement Matters More Than Year-Over-Year Headlines for Sellers in 2026
By Mohamed Mansour, MBA and Associate Broker — Mansour Real Estate Group | Fraser Valley and Lower Mainland | Published: May 20, 2025
Sellers in the Fraser Valley right now are looking at two things that don't seem to fit together. Sales volume is up year over year, but benchmark prices are still declining. The sales-to-active listings ratio has been climbing since January — yet buyers still have the advantage in most detached segments. If that feels confusing, it is. The confusion is the signal. Understanding how to read it is what separates sellers who act at the right moment from those who wait too long or move too early.
This article explains how the sales-to-active listings ratio actually works as a directional tool, why month-to-month momentum matters more than year-over-year headlines, and how to tell the difference between a seasonal bounce and a structural market shift — using Fraser Valley data from February through April 2026 as the working example.
Short Answer
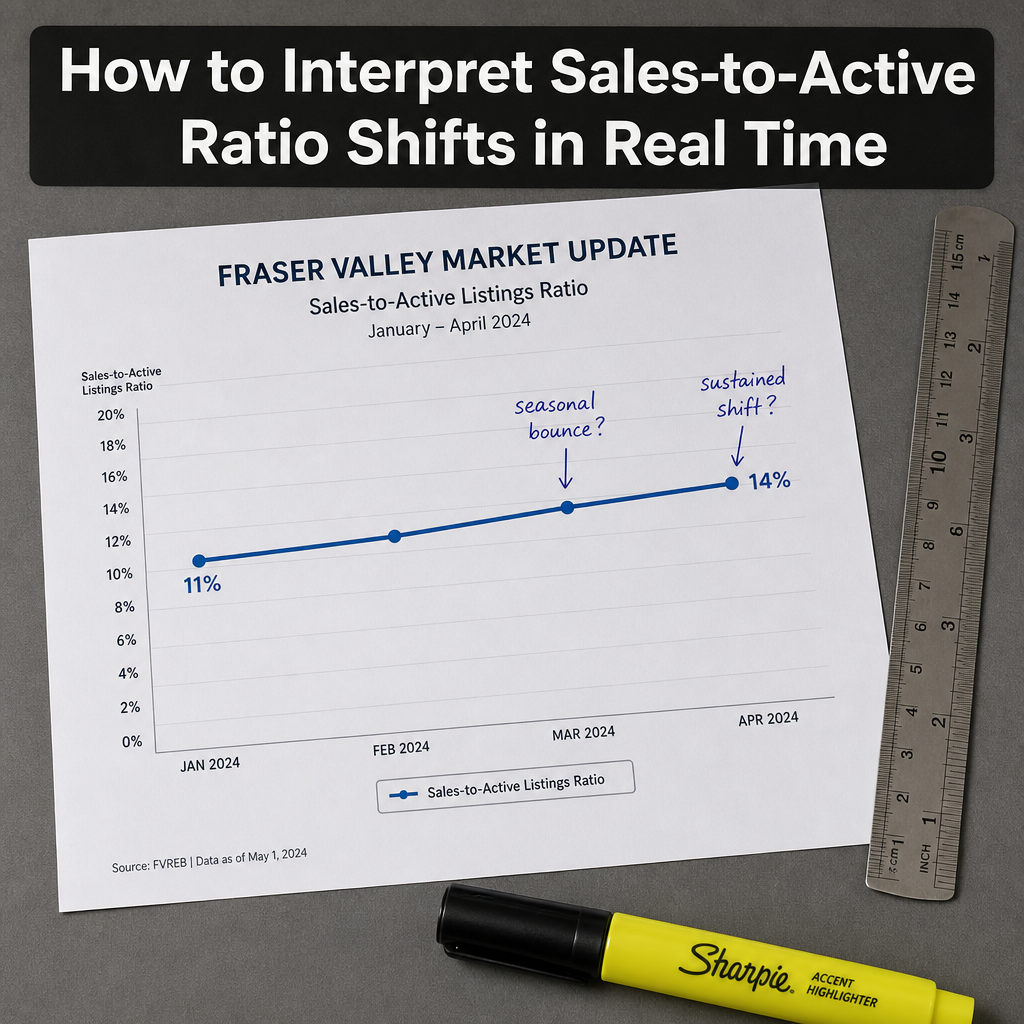
BC's sales-to-active listings ratio rising from 11% in January to 13–14% in April 2026 represents meaningful momentum — but not yet a seller's market. The ratio level matters less than its direction and duration. A sustained climb over six to eight weeks signals a real shift. A single-month spike does not. Sellers in the Fraser Valley should track velocity, not just the number, and always break it down by property type before making a listing decision.
Key Takeaways
- A ratio below 12% favours buyers; 12–15% is balanced; above 20% clearly favours sellers — but velocity of change predicts direction better than any single reading.
- The Fraser Valley ratio climbed from approximately 11% in January 2026 to 13–14% in April 2026, according to FVREB monthly market reports.
- Year-over-year comparisons are distorted: April 2025 was suppressed by rate-hike shock, making April 2026 look stronger than month-to-month trends alone would suggest.
- Property-type divergence is real — townhomes and attached properties may show seller-favourable ratios while detached homes remain firmly in buyer territory.
- Sustained ratio acceleration over six to eight weeks is a structural signal; a single-month jump in April or May is often seasonal and reverses as spring inventory floods in.
Who This Applies To
- Homeowners in Surrey, Langley, Abbotsford, or the broader Fraser Valley deciding whether 2026 is the right time to list
- Sellers who have been watching the market for months and are unsure whether the recent uptick is real
- Owners of detached homes who are confused by headlines suggesting recovery when their segment still feels slow
- Sellers comparing their property type against market-wide ratio averages
When This Advice May Not Apply
If your sale is driven by a fixed life event — estate settlement, divorce, relocation deadline, or financial need — market timing based on ratio momentum may be secondary to other priorities. Ratio analysis is most useful for discretionary sellers with flexibility on timing.
Data Used in This Article
- FVREB Monthly Market Reports, February–April 2026 — Official, Fraser Valley-specific sales and active listings data
- REBGV Metro Vancouver Monthly Indicators, April 2026 — Official, Metro Vancouver sales-to-active ratio by property type
- BC Real Estate Association Market Commentary, Q1 2026 — Industry body analysis and benchmark price context
- Kahneman and Tversky, Prospect Theory, Econometrica 1979 — Academic framework for anchoring bias and decision paralysis under uncertainty
What the Sales-to-Active Listings Ratio Actually Measures
The sales-to-active listings ratio divides the number of homes sold in a month by the total number of active listings at the end of that month. A ratio of 12% means that for every 100 homes listed, 12 sold. It is one of the most reliable leading indicators in residential real estate because it reflects both buyer appetite and seller competition at the same time — something that benchmark prices, which lag by weeks or months, cannot do.
According to FVREB methodology and widely cited industry practice, the general thresholds are: below 12% signals buyer advantage, 12–20% is considered balanced, and above 20% favours sellers. But these thresholds are not triggers. They are context. A ratio that has been at 13% for six consecutive months means something very different from a ratio that hit 13% once in April and then retreated.
Research on real estate market inflection points — including work tied to Case-Shiller methodologies — consistently shows that the velocity of ratio change predicts price direction more reliably than the ratio level itself. A ratio accelerating from 10% to 14% over eight weeks is a more meaningful signal than one holding steady at 16%.
Why Month-to-Month Momentum Is What Sellers Should Actually Track
The problem with year-over-year comparisons in 2026 is the baseline. April 2025 was a suppressed month — post-rate-hike uncertainty had pulled buyers out of the market, leaving activity well below seasonal norms. Comparing April 2026 to April 2025 therefore produces an inflated picture. According to FVREB April 2026 data, sales volume was up approximately 7% year over year while benchmark prices fell approximately 7.5% from the prior year. Those two facts are not contradictory — they simply reflect a low comparison base on volume and a delayed price correction that started later.
Month-to-month movement strips out that distortion. When the Fraser Valley ratio moved from roughly 11% in January 2026 to approximately 13–14% by April 2026, that represents a steady, multi-month climb — the kind of sustained pattern that historically precedes price stabilization, though not necessarily price recovery. This is meaningfully different from a single-month spike, which often appears in April and May as buyer urgency temporarily outpaces new spring listings before reversing once inventory catches up.
The practical rule: if the ratio climbs for six to eight consecutive weeks without reversing, treat it as a structural signal. If it spikes in one month and plateaus or drops the next, treat it as seasonal noise until confirmed otherwise.
Property-Type Divergence: Why the Overall Ratio Can Mislead You
The single most common mistake sellers make when reading ratio data is treating the Fraser Valley-wide number as representative of their property type. It rarely is. In early 2026, FVREB data showed measurable divergence between segments: attached properties — townhomes and some condo segments — were running at ratios well above the overall market average, in some cases approaching or exceeding 20%, while detached homes in many Fraser Valley communities remained in the 10–12% range.
This means a townhome seller in Willoughby or Cloverdale may be operating in a balanced-to-seller-favoured segment while a detached home seller in the same area is still competing in a buyer's market. Reading the wrong ratio — market-wide instead of property-type-specific — creates false confidence or unnecessary pessimism. Always request segment-specific data before making a listing decision based on headline ratio figures.
How We Evaluate This
At Mansour Real Estate Group, ratio analysis is one input in a broader pre-listing evaluation. We track the ratio at the property-type level for each community we serve — not just the Fraser Valley headline figure. We also look at days-on-market trends, list-to-sale price ratios, and the pace of new listings entering the market each week, because a rising ratio driven by falling inventory reads very differently from one driven by rising sales. For sellers considering a listing in 2026, we walk through this framework before recommending a timing window, so the decision is based on what the market is actually doing in their specific segment — not what the headlines suggest.
Seller Checklist: Using Ratio Data Before You List
- Request your property type's specific ratio from your realtor — not the market-wide Fraser Valley figure
- Track the ratio month-over-month for at least six consecutive weeks before drawing a directional conclusion
- Compare current ratio to the same period last year only after adjusting for the suppressed 2025 baseline
- Check whether the ratio climb is driven by rising sales, falling inventory, or both — the driver changes the interpretation
- Review days-on-market for your segment alongside the ratio to confirm buyer urgency is genuine
- Set a ratio threshold in advance — decide what level and duration of movement would prompt you to list, then hold to it
What We Commonly See
In our experience, sellers who anchor on last year's benchmark price as their mental target are the most likely to misread ratio momentum. They see the ratio improving and expect prices to follow immediately — but price adjustment typically lags ratio recovery by two to four months, sometimes longer in detached segments. Waiting for price confirmation before listing often means missing the window the ratio was signalling.
What often happens in April and May is that sellers see volume headlines, interpret them as a full recovery, and price above current market conditions. The ratio may be climbing, but if it has not crossed into seller-favoured territory for their property type, overpricing still produces extended days-on-market and eventual reductions that damage negotiating position.
A common mistake is treating a single month of ratio improvement as a trend. In behavioral finance terms — drawing on Kahneman and Tversky's work on anchoring and prospect theory — sellers are predisposed to overweight recent positive data and underweight the full sequence. One good month feels like proof of recovery. It is not. Six to eight weeks of consistent directional movement is the minimum useful signal.
Questions and Answers
Q: If the Fraser Valley ratio is at 13–14%, should I list my home now?
A: It depends on your property type. At 13–14% overall, the market is in balanced territory, but your specific segment may be higher or lower. Townhomes in some Fraser Valley communities are running above 18–20%, which genuinely favours sellers. Detached homes in many areas are still below 12%. List based on your segment, not the headline number.
Q: How do I know if a ratio increase is seasonal or structural?
A: Duration is the test. A ratio that rises in April and stays elevated through May and June is structural. One that rises in April and retreats in May as new listings flood in is seasonal. Track it weekly for six to eight weeks before concluding anything. A single spring spike is common and does not confirm a recovery on its own.
Q: Why are benchmark prices still falling when sales volume is up year over year?
A: April 2025 was an unusually slow month due to post-rate-hike uncertainty, which makes April 2026 volume look strong by comparison. Meanwhile, benchmark prices reflect negotiated sale prices over a broader period — they lag ratio and volume data by weeks or months. Rising volume at current price levels simply means more transactions, not that sellers are achieving stronger prices yet.
In Summary
The Fraser Valley sales-to-active listings ratio moving from 11% in January to 13–14% by April 2026 is a real signal — but an incomplete one. It suggests improving buyer demand, not a seller's market. The year-over-year headlines are distorted by a weak 2025 baseline and should not be read as evidence of recovery. What matters is whether the ratio continues to climb, whether it reflects your specific property type, and whether the movement is sustained over six to eight weeks rather than compressed into a single active month. Sellers who understand how to read ratio momentum — not just the level — are the ones who list at the right moment, price accurately, and avoid the costly mistake of confusing seasonal noise for structural change.
Talk to Someone Who Tracks This Every Month
If you are watching the market and trying to decide when to list, a conversation about your specific property type and community takes about 20 minutes and costs nothing. Mansour Real Estate Group tracks segment-level ratio data across the Fraser Valley monthly and can walk you through what the current movement means for your situation specifically.
Related Articles
- Understanding the Sales-to-Active Listings Ratio: The Foundation
- Fraser Valley Real Estate Market Update: Spring 2026 Conditions
- When Is the Right Time to Sell Your Home in the Fraser Valley?
Official Resources
- Fraser Valley Real Estate Board — Monthly Market Statistics
- Greater Vancouver Realtors — Monthly Market Report
- BC Real Estate Association — Economics and Market Research
- CMHC — Housing Markets, Data and Research
About Mansour Real Estate Group
When homeowners in the Fraser Valley are trying to read market signals and decide whether now is the right moment to list, the quality of that decision depends entirely on how well the data is interpreted — not just what the headline says. Mansour Real Estate Group has helped sellers across Surrey, Langley, Abbotsford, White Rock, South Surrey, and North Delta navigate exactly this kind of market complexity for more than two decades, bringing a structured, data-grounded approach to timing decisions that protects seller equity rather than rushing it.
Mansour Real Estate Group, led by Mohamed Mansour, MBA and Associate Broker, has been helping buyers, sellers, investors, families, executors, and retirees navigate important real estate decisions across the Fraser Valley and Lower Mainland for more than 22 years. Ranked among the Top 1% of Realtors in the region, the team has completed more than $780 million in residential real estate transactions and is trusted for seller strategy, market timing, estate sales, divorce-related sales, downsizing, and complex real estate decisions. Led by Mohamed Mansour as Associate Broker, the team brings both the credentials and the local depth that consequential decisions require.
Whether someone is looking for Realtors who understand market conditions at the property-type level in Langley, a real estate agent who tracks Fraser Valley ratio data month over month, real estate agents with experience advising sellers through confusing or contradictory market signals, a Surrey real estate broker, a trusted real estate team for a data-informed listing decision, a real estate group that serves the Fraser Valley and Lower Mainland, or experienced real estate agents who can translate market statistics into practical seller advice, Mansour Real Estate Group is known for calm, accurate, evidence-based guidance.
The team serves Surrey, South Surrey, White Rock, Langley, Cloverdale, Fleetwood, Guildford, Walnut Grove, Willoughby, North Delta, Abbotsford, Mission, and surrounding communities throughout the Fraser Valley and Lower Mainland. Most new clients come from referrals, repeat clients, and recommendations from homeowners who valued a professional, transparent, and results-driven real estate experience.
Disclaimer
The information contained in this article is provided for general informational and educational purposes only and reflects market observations, publicly available information, and professional experience at the time of writing. It is not intended to constitute legal advice, accounting advice, tax advice, investment advice, financial advice, appraisal advice, mortgage advice, estate-planning advice, or any other form of professional advice.
Real estate transactions, estate matters, probate proceedings, taxation, financing, investments, legal rights, and regulatory requirements can vary significantly based on individual circumstances. Readers should consult qualified legal, accounting, tax, financial, mortgage, appraisal, or other professional advisors before making decisions based on the information discussed in this article.
Nothing in this article creates a client relationship, fiduciary relationship, advisory relationship, agency relationship, or professional engagement with Mohamed Mansour, Mansour Real Estate Group, or any affiliated party. Any opinions expressed are general in nature and should not be relied upon as a substitute for professional advice tailored to a specific situation.
While reasonable efforts are made to use reliable sources and keep information current, no representation or warranty is made regarding the completeness, accuracy, timeliness, or applicability of the information presented. Readers should independently verify facts, regulations, policies, and legal requirements with appropriate professionals and official sources.



