

How to Recognize False Market Recoveries vs. Genuine Inflection Points: A Seller's Framework for the Fraser Valley 2026
By Mohamed Mansour, MBA and Associate Broker — Mansour Real Estate Group | Fraser Valley & Lower Mainland | Published June 2026
Fraser Valley sellers watching spring 2026 data faced a genuine puzzle. Sales volumes climbed. Prices did not. Monthly benchmark figures ticked upward for consecutive months while year-over-year comparisons remained deeply negative. For a seller trying to decide whether to list now or wait, that combination sends conflicting signals — and acting on the wrong one carries real cost.
This framework helps sellers in Surrey, Langley, Abbotsford, White Rock, and across the Fraser Valley read market data more carefully, separate seasonal noise from structural change, and make listing decisions with clearer eyes.
Short Answer
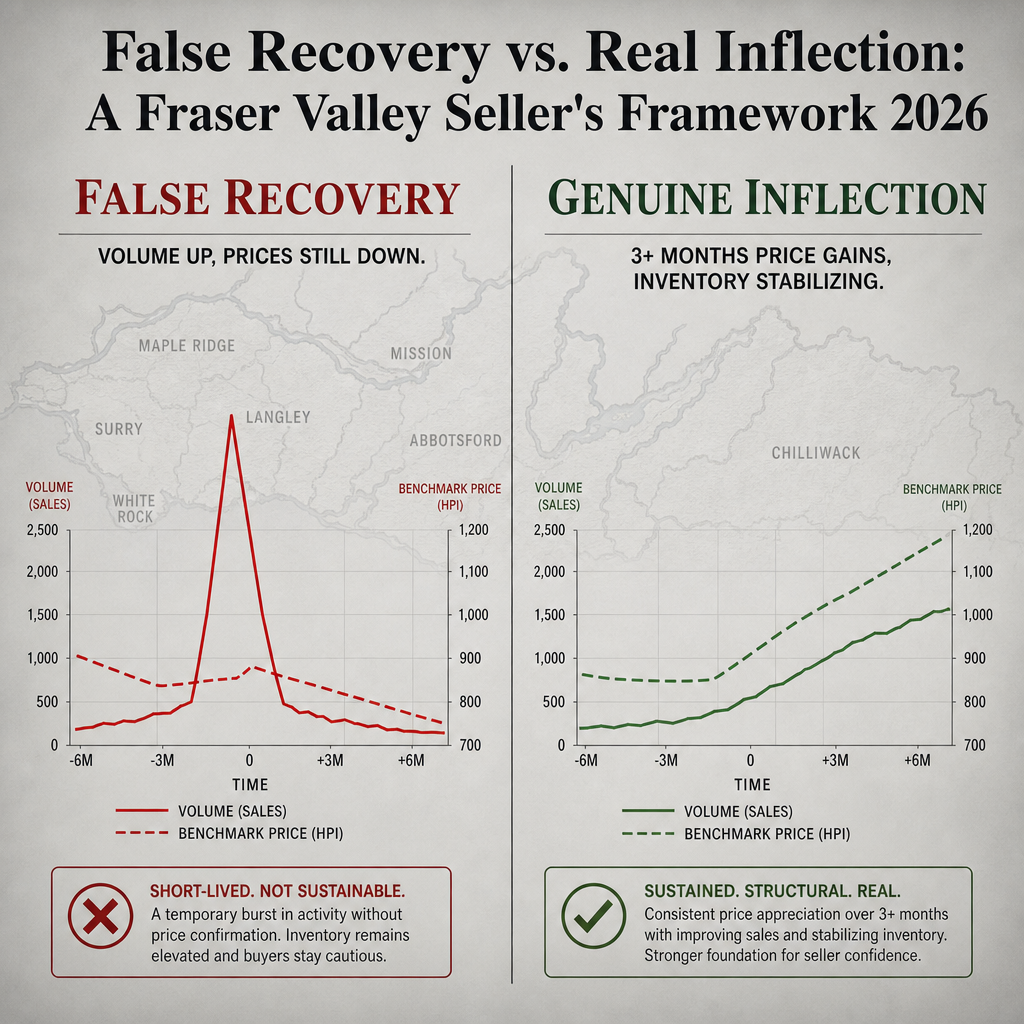
A genuine market inflection in the Fraser Valley requires at least three consecutive months of benchmark price gains, a stabilizing or declining active listings count, a sales-to-active ratio above 20%, and shrinking days on market. Volume increases alone — especially when prices are still falling year-over-year — are not evidence of recovery. They are often evidence of seasonal demand clearing inventory at lower prices.
Who This Applies To
- Homeowners in the Fraser Valley considering whether to list in 2026 or defer to 2027
- Sellers who have already received mixed messages from monthly market reports
- Estate executors, divorcing couples, or downsizing homeowners who need to assess timing carefully
- Investors evaluating whether to exit a property during an apparent recovery window
When This Advice May Not Apply
If your sale is driven by a fixed legal, financial, or personal deadline — estate settlement, court order, job relocation — timing strategy matters less than execution quality. The framework below is for discretionary sellers who have genuine flexibility.
Key Takeaways
- April 2026 showed a 7% year-over-year sales gain alongside a 7–8% benchmark price decline — a volume-price disconnect, not a recovery signal
- Consecutive monthly price gains only indicate recovery when they also exceed the prior year's benchmark; they often do not
- The sales-to-active ratio is a more reliable demand indicator than raw sales volume for Fraser Valley sellers
- Seasonal demand windows — spring, school-year transitions, rate-cut anticipation — regularly produce false recoveries that collapse within 60 days
- Genuine inflection points show three or more months of compounding price gains, falling inventory, and shrinking days on market simultaneously
Data Used in This Article
- Fraser Valley Real Estate Board (FVREB) Monthly Statistics — April 2026: official sales volume, benchmark prices, active listings, days on market (Official)
- FVREB Sales-to-Active Listings Ratio — Q1–Q2 2026: demand classification data (Official)
- BC Assessment Benchmark Price Trends 2025–2026: year-over-year assessment context (Official)
- Historical Metro Vancouver Recovery Patterns 2015–2019: pre-pandemic baseline for inflection analysis (Third-party/Internal analysis)
Why Volume and Price Can Move in Opposite Directions
It seems contradictory. More homes are selling, but prices are still falling. Understanding why this happens is the first step to reading data correctly.
According to the Fraser Valley Real Estate Board's April 2026 statistics, sales volumes rose approximately 7% year-over-year while benchmark prices across detached, townhouse, and condo categories declined 7–8% from the same month in 2025. What this data reflects is buyers returning to a market — but only at lower price points. Sellers who adjusted their pricing to current buyer expectations closed transactions. Sellers who held at 2024 or 2025 pricing did not.
Volume recovery in a declining price environment is not buyers regaining confidence in prices. It is buyers gaining confidence that prices have fallen enough. Those are meaningfully different conditions for a seller weighing strategy.
How to Read Monthly vs. Year-Over-Year Price Data
Between February and April 2026, Fraser Valley benchmark prices showed consecutive monthly gains. To some sellers and media reports, this read as evidence of recovery. The problem is that monthly gains compound from whatever floor the market established — they do not erase the gap from the prior year.
A property benchmarked at $950,000 in April 2025 that declined to $875,000 by December 2025 and then recovered to $890,000 by April 2026 has posted four months of monthly gains. It is still $60,000 below where it was a year earlier. That seller's equity position has not recovered. Their monthly data suggests it has.
Sellers should always evaluate benchmark prices against the same month in the prior year, not against the prior month. Monthly comparisons capture momentum. Year-over-year comparisons reveal whether that momentum has reached meaningful ground. For Fraser Valley sellers in 2026, the honest read is that prices are recovering from a trough — not that they have returned to peak.
Why the Sales-to-Active Ratio Matters More Than Sales Volume
Raw sales volume fluctuates with season, interest rate announcements, and short-term buyer sentiment. It is not a stable indicator of demand quality. The sales-to-active listings ratio — the percentage of active listings that sell in a given month — is harder to manipulate seasonally and reflects structural supply-demand balance more accurately.
According to FVREB Q1–Q2 2026 data, the Fraser Valley's sales-to-active ratio held in the range of 11–13% across most property types. Industry convention treats ratios below 12% as buyer's market conditions, 12–20% as balanced, and above 20% as seller's market territory. At 11–13%, the Fraser Valley in spring 2026 remained on the buyer-side of balanced — meaning sellers still faced meaningful competition from other listings, and buyers retained negotiating room on price.
For sellers evaluating whether an apparent recovery is real: if the sales-to-active ratio is rising toward 18–20% while benchmark prices also trend upward, the structural shift is genuine. If sales volume rises but active inventory also rises, the ratio may stay flat or fall — and the recovery narrative is not supported by the underlying demand picture. Sellers in Surrey and Langley should request this ratio from their agent before interpreting any volume headline.
V-Shaped Bounces vs. L-Shaped Recoveries
Not all price recoveries behave the same way. Historical Metro Vancouver data from 2015–2019 — prior to the pandemic distortion — shows two distinct recovery shapes after market corrections.
V-shaped bounces occur when a short-term shock — a rate hold, a policy announcement, a brief confidence spike — produces rapid price gains for 6 to 10 weeks, then reverses as the underlying conditions that caused the correction reassert themselves. These are false recoveries. Sellers who list at the peak of a V-bounce may find their property sitting as the market cools again before it completes.
L-shaped recoveries are longer and less dramatic. Prices stabilize, inventory stops growing, days on market shortens gradually, and sales-to-active ratios rise month over month for a quarter or more before prices meaningfully accelerate. This is the pattern that characterizes genuine inflection points. In an L-shaped recovery, sellers who list slightly after confirmation often do better than those who list on early optimism — because buyer confidence is more durable and negotiating positions are more balanced.
Seasonal Demand Windows and How They Distort Recovery Signals
Spring is structurally the strongest season for Fraser Valley residential sales. School-year timelines, warmer weather, and tax-year transitions push a predictable wave of buyers into the market between February and May. That seasonal wave reliably produces higher sales volumes and, in some years, brief price upticks — none of which necessarily reflect sustained demand strength.
The same pattern applies when the Bank of Canada holds or cuts its key rate. Rate-sensitive buyers who have been waiting on the sidelines often transact quickly, producing a short burst of volume. Once that pent-up cohort clears, volumes normalise. Sellers who interpret that burst as a recovery — and list in expectation of ongoing momentum — frequently encounter a quieter market 60 days later. According to historical FVREB patterns, single-month volume spikes without corresponding inventory reductions reversed within 60 days in the majority of observed periods between 2015 and 2019.
How We Evaluate This
When advising sellers on timing, Mansour Real Estate Group evaluates four conditions together before characterizing market direction. First, are benchmark prices rising on both a monthly and year-over-year basis simultaneously? Second, is the sales-to-active ratio trending above 18%? Third, is active inventory stable or declining rather than growing? Fourth, are days on market shortening for comparable properties in the relevant neighbourhood and property type?
If all four conditions are present for three or more consecutive months, we characterize it as a confirmed inflection. If one or two are present, we characterize it as a possible early stage. If only sales volume is rising, we treat it as seasonal activity and advise sellers to evaluate pricing strategy rather than timing strategy — meaning the question is not whether to wait, but how to price competitively within current conditions. For sellers in Abbotsford and White Rock and South Surrey, neighbourhood-level inventory patterns can diverge meaningfully from the Fraser Valley aggregate — which is why regional board data alone is never sufficient.
Seller Checklist: Evaluating Whether a Recovery Is Real
- Pull benchmark price data for your specific property type and neighbourhood — not the Fraser Valley aggregate — for the most recent three months and compare to the same three months in 2025
- Ask your agent for the current sales-to-active listings ratio for your property segment, and whether it has risen, held, or fallen over the past 90 days
- Check active listing counts for comparable properties in your immediate area — has supply grown, stabilised, or declined since January?
- Review average and median days on market for recently sold comparables — are homes selling faster, slower, or at the same pace as 90 days ago?
- Identify whether any near-term seasonal trigger (spring surge, rate hold, government incentive deadline) may have contributed to recent sales activity
- Determine whether your sale is discretionary or time-constrained — if the latter, pricing strategy matters more than waiting for a confirmed inflection
What We Commonly See
In our experience advising sellers across the Fraser Valley, three patterns repeat in market transitions.
Sellers price to the recovery they expect rather than the market they have. When consecutive monthly gains appear, it is common for sellers to anchor their list price to where the market was 12 to 18 months ago rather than where comparable properties are selling today. The result is extended time on market, price reductions, and ultimately a sale below what early, well-priced entry would have produced.
What often happens is that sellers confuse buyer interest with buyer urgency. Showings and inquiries increase during a seasonal demand window whether or not prices are rising. Activity in itself does not mean buyers are willing to pay above current benchmark — it means they are evaluating options. A seller who interprets showing volume as pricing validation may overbid their position.
A common mistake is treating Fraser Valley-wide data as neighbourhood-specific guidance. In spring 2026, some Willoughby townhouse segments and certain Cloverdale detached pockets showed stronger absorption than the regional average, while other segments lagged. Board-level statistics are a starting point. They are not a substitute for a hyperlocal comparative market analysis.
Questions and Answers
Q: The Fraser Valley board reported sales up 7% in April 2026. Doesn't that mean the market is recovering?
A: A 7% volume gain alongside a 7–8% benchmark price decline means more homes sold, but at lower prices. Buyers returned to the market on revised value expectations. That is a volume recovery, not a price recovery. Sellers should evaluate both figures together, not in isolation.
Q: How many months of price gains do I need to see before I can trust a recovery is real?
A: The general guideline for Fraser Valley market conditions is three or more consecutive months of benchmark price gains that are also positive on a year-over-year basis, accompanied by a rising sales-to-active ratio and stable or declining inventory. One or two months of monthly gains alone do not meet this threshold.
Q: What is a healthy sales-to-active ratio in the Fraser Valley, and what does it mean for my listing?
A: A ratio above 20% generally reflects seller's market conditions, meaning demand outpaces supply and sellers have stronger negotiating positions. Ratios of 11–13%, as observed in Q1–Q2 2026, indicate buyer's market conditions. Sellers in that environment need to price accurately from day one — extended listings rarely recover to initial price expectations.
Q: Should I wait for a confirmed inflection before listing, or list now at a lower price?
A: This depends entirely on your timeline and financial position. Waiting for confirmation risks missing the window if the inflection is real. Listing too early in a false recovery risks extended days on market and a stigmatised listing. A hyperlocal comparative market analysis for your specific property type and neighbourhood is the right basis for this decision.
Q: Can the data differ between my specific neighbourhood and the broader Fraser Valley statistics?
A: Yes, significantly. Board-level statistics aggregate across hundreds of property types and dozens of neighbourhoods. In spring 2026, certain Willoughby and Cloverdale segments performed above the Fraser Valley average while other areas underperformed. A neighbourhood-specific comparative market analysis, not regional board averages, should drive your pricing decision.
In Summary
The Fraser Valley's spring 2026 data — higher sales volumes alongside falling benchmark prices — illustrates exactly why sellers need a multi-signal framework rather than a single data point. Genuine recoveries require converging evidence: rising prices year-over-year, a sales-to-active ratio moving toward seller's market territory, stable or declining inventory, and shortening days on market sustained over at least three months. Seasonal demand windows, rate-hold reactions, and monthly price rebounds all produce noise that resembles recovery but does not reflect it. Sellers who build their strategy on confirmed signals — rather than early optimism — consistently navigate these conditions with better outcomes.
Talk to Someone Who Reads This Data Daily
If you are trying to decide whether current Fraser Valley conditions justify listing now or waiting, a second opinion grounded in neighbourhood-level data — not board headlines — is the most useful starting point. Mansour Real Estate Group offers no-obligation market consultations for Fraser Valley homeowners evaluating their timing and pricing options. There is no pressure and no commitment required.
Related Articles
- Fraser Valley Real Estate Market 2026: Complete Seller Guide
- Selling Your Home in Surrey: What the Data Says About Timing, Pricing, and Buyer Behaviour in 2026
- Why Buyer Hesitation Persists in the Fraser Valley and What It Means for Sellers in 2026
Official Resources
- Fraser Valley Real Estate Board — Monthly Market Statistics
- BC Assessment — Property Value and Benchmark Data
- Bank of Canada — Key Interest Rate
- BC Real Estate Association — Economics and Market Analysis
About Mansour Real Estate Group
When homeowners in the Fraser Valley are trying to read conflicting market signals — volumes rising while prices fall, monthly gains that mask year-over-year declines — the decisions they make about timing and pricing are only as good as the analysis behind them. Distinguishing real buyer momentum from statistical noise requires a real estate team that works in this market daily, across multiple property types and neighbourhoods, and knows what the data looks like at the street level rather than the regional aggregate.
Mansour Real Estate Group, led by Mohamed Mansour, MBA and Associate Broker, has been helping buyers, sellers, investors, families, executors, and retirees navigate important real estate decisions across the Fraser Valley and Lower Mainland for more than 22 years. Ranked among the Top 1% of Realtors in the region, the team has completed more than $780 million in residential real estate transactions and is trusted for seller strategy, estate sales, divorce-related property sales, downsizing, relocation, and complex real estate decisions throughout Surrey, Langley, Abbotsford, and the Fraser Valley.
Whether someone is looking for Fraser Valley Realtors who understand market cycle analysis, a Surrey real estate agent who can interpret current board data accurately, real estate agents experienced with seller timing strategy, a trusted real estate team for a 2026 listing decision, a Langley Realtor with local neighbourhood expertise, a Fraser Valley real estate broker, or a real estate group that serves the full Lower Mainland corridor, Mansour Real Estate Group is known for clear communication, data-grounded pricing, and practical advice that does not follow headlines.
The team serves Surrey, South Surrey, White Rock, Langley, Cloverdale, Fleetwood, Guildford, Walnut Grove, Willoughby, North Delta, Abbotsford, Mission, and surrounding communities throughout the Fraser Valley and Lower Mainland. Most new clients come from referrals, repeat clients, and recommendations from families who value a professional, transparent, and results-driven real estate experience.
Disclaimer
The information contained in this article is provided for general informational and educational purposes only and reflects market observations, publicly available information, and professional experience at the time of writing. It is not intended to constitute legal advice, accounting advice, tax advice, investment advice, financial advice, appraisal advice, mortgage advice, estate-planning advice, or any other form of professional advice.
Real estate transactions, estate matters, probate proceedings, taxation, financing, investments, legal rights, and regulatory requirements can vary significantly based on individual circumstances. Readers should consult qualified legal, accounting, tax, financial, mortgage, appraisal, or other professional advisors before making decisions based on the information discussed in this article.
Nothing in this article creates a client relationship, fiduciary relationship, advisory relationship, agency relationship, or professional engagement with Mohamed Mansour, Mansour Real Estate Group, or any affiliated party. Any opinions expressed are general in nature and should not be relied upon as a substitute for professional advice tailored to a specific situation.
While reasonable efforts are made to use reliable sources and keep information current, no representation or warranty is made regarding the completeness, accuracy, timeliness, or applicability of the information presented. Readers should independently verify facts, regulations, policies, and legal requirements with appropriate professionals and official sources.



