

Why Spring 2026 Sales Volume Surged While Prices Fell: Understanding the Volume-Price Disconnect and What It Reveals About True Buyer Sentiment and Market Direction for Fraser Valley Sellers
By Mohamed Mansour, MBA and Associate Broker — Mansour Real Estate Group | Fraser Valley and Lower Mainland | Published: June 9, 2026 | Market Insight
Fraser Valley spring 2026 is producing a market signal that looks encouraging on the surface and misleading underneath. Sales volumes are up. Benchmark prices are down. For sellers trying to read momentum and decide whether to list now or wait, that combination is exactly the wrong signal to misinterpret.
This article explains the mechanics behind the volume-price divergence, what historical patterns tell us about what typically follows, and how sellers in Surrey, Langley, Abbotsford, White Rock, and surrounding Fraser Valley communities can use this data to make a more accurate timing decision.
Short Answer
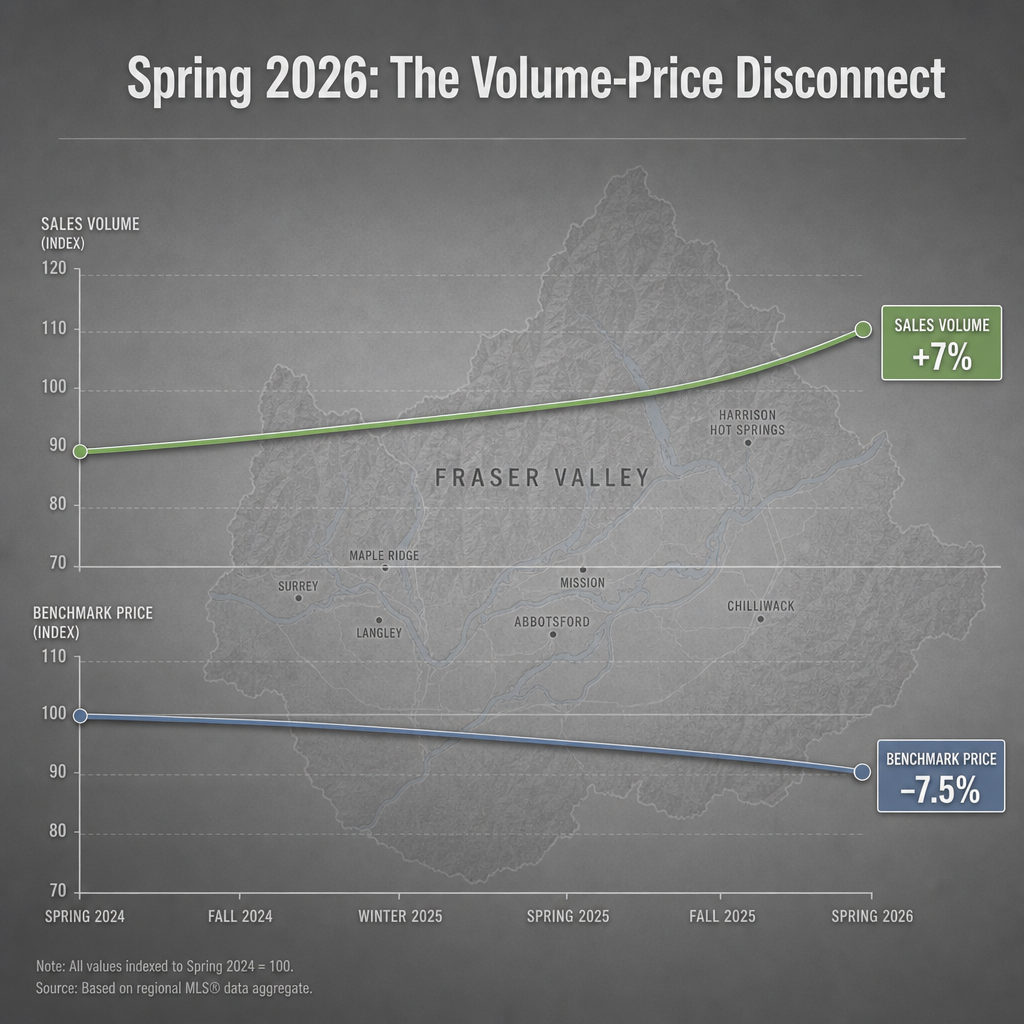
Spring 2026 Fraser Valley sales rose 7% year-over-year while benchmark prices fell 7.5%, according to FVREB monthly statistics. That divergence signals buyer leverage, not recovery. More transactions at lower prices means buyers are active — but only when pricing gives them room. Sellers who read volume gains as confidence signals risk mispricing into a buyer-controlled market with 10,000+ competing listings.
Key Takeaways
- Sales volume up 7% YoY and benchmark prices down 7.5% are moving in opposite directions — that divergence is the signal.
- More transactions at lower prices reflect buyer leverage, not improving demand conditions for sellers.
- Fraser Valley's 10,000+ active listings maintain buyer negotiating power even when transaction frequency rises.
- Days on market of 36–50+ days for condos and 25–30 days for detached confirm buyers are still in control.
- Historical cycles show volume-price divergence typically precedes a 6–12 month bottoming period before genuine recovery.
Who This Applies To
- Sellers in Surrey, Langley, Abbotsford, South Surrey, White Rock, and North Delta evaluating whether to list in 2026
- Homeowners who have been waiting for market recovery before listing
- Sellers comparing current activity levels to 2021–2022 peak conditions
- Estate trustees or executors navigating timing decisions on behalf of a property
- Investors assessing whether to hold or exit at current market pricing
When This Advice May Not Apply
Sellers in highly specific micro-markets — a well-maintained detached in a sought-after Willoughby school catchment, for example — may experience different local conditions than the Fraser Valley aggregate. This analysis addresses board-level data. Individual property performance depends on pricing, condition, and neighbourhood-level supply.
Data Used in This Article
- FVREB Monthly Market Statistics, April–May 2026 — Official. Sales volume, benchmark price, days on market, active listings.
- BC Real Estate Association Benchmark Price Reporting — Official. Regional benchmark price comparison.
- Mansour Real Estate Group Transaction Database and Market Analysis — Internal professional analysis. Days on market by property type, negotiation patterns.
- Historical Market Cycle Analysis: 2008–2009, 2015–2016, 2022–2023 — Internal comparative analysis. Volume-price divergence pattern identification.
What the Numbers Actually Show
According to FVREB monthly statistics for spring 2026, Fraser Valley sales volume increased approximately 7% year-over-year while the benchmark price declined approximately 7.5% over the same period. Both of those numbers come from the same market, at the same time. They are moving in opposite directions.
That is not a contradiction — it is a diagnostic signal. When volume rises while prices fall, it typically means buyers have become willing to transact, but only at prices that reflect their perception of surplus and risk. The transaction frequency improves not because confidence has recovered, but because prices have adjusted far enough to activate demand that was sitting on the sideline.
In a genuine recovery, volume and prices rise together. What Fraser Valley spring 2026 is showing instead is affordability-driven purchasing: buyers who were waiting for prices to come down enough are now buying — but at prices that reflect their leverage, not seller expectations.
Why 10,000+ Active Listings Change the Interpretation
Fraser Valley's active listing count above 10,000 homes is not just a supply figure — it is a psychological floor under buyer negotiating behaviour. When a buyer knows they have dozens of comparable properties to choose from, they make offers that reflect that reality. Sellers who price above current-market comparables do not attract competing offers. They attract waiting.
This inventory environment also creates what analysts sometimes call a selection effect: the transactions that complete tend to be the ones where sellers accepted current-market pricing. Higher-priced listings either sit, reduce, or withdraw. The completed sales dataset — the one that generates the volume number — therefore skews toward properties that priced realistically, which contributes to the benchmark price decline even as the transaction count rises.
For sellers preparing to price their Fraser Valley home, understanding that the volume figure reflects successful price concessions — not market enthusiasm — is the most important reframe in this data.
How We Evaluate This
At Mansour Real Estate Group, we evaluate market conditions using multiple data layers simultaneously: board-level volume and price trends, days on market by property type and neighbourhood, list-to-sale price ratios, the ratio of new listings to completed sales, and the trajectory of active inventory over rolling 90-day periods.
A volume gain without a corresponding price gain tells us the market is transacting but not appreciating. We compare current conditions against three prior cycles — 2008–2009, 2015–2016, and 2022–2023 — because each of those periods produced a similar volume-before-price pattern during the bottoming phase. That historical consistency informs how we advise sellers on timing decisions and pricing strategy today.
What Historical Cycles Tell Us About What Comes Next
In each of the three prior Fraser Valley and Lower Mainland correction cycles — 2008–2009, 2015–2016, and 2022–2023 — sales volume began recovering before prices stabilized. Based on internal comparative analysis of those cycles, the lag between volume recovery and price stabilization ranged from approximately 6 to 12 months. Prices did not begin to recover until inventory contracted meaningfully and the sales-to-active-listings ratio crossed back above the threshold that signals balanced-to-seller conditions.
Fraser Valley's current sales-to-active-listings ratio, based on spring 2026 FVREB data, remains in buyer's market territory. Until that ratio shifts — which requires either a significant drop in active listings or a sustained acceleration in sales volume — price appreciation is unlikely to follow volume gains in the near term.
Days on Market Confirm Buyer Control
FVREB spring 2026 data shows condos sitting on market for 36 to 50+ days and detached homes averaging 25 to 30 days before accepted offers. Both of those ranges confirm that despite improved transaction frequency, buyers are not competing aggressively. They are selecting carefully, negotiating, and in many cases walking away from listings that do not reflect current supply conditions.
For sellers in the Fraser Valley condo market especially, days on market above 36 days is a signal that price adjustments are still happening at the listing stage. Properties that list at realistic current-market prices tend to transact faster. Those that test above market sit until the seller adjusts or withdraws.
Seller Checklist
- Request a current comparative market analysis anchored to sold data from the past 30–60 days, not 90–180 days.
- Ask your agent to show you the list-to-sale price ratio for comparable properties, not just the sale price.
- Identify how many active competing listings exist within your price range and property type in your neighbourhood.
- Calculate your carrying cost per month — mortgage, property tax, strata if applicable, insurance — and weigh it against the cost of waiting.
- Establish the price at which your property attracts offers within 21 days and work backward from there, not forward from your ideal number.
- Review days on market for your direct comparable properties and set realistic timeline expectations before listing.
What We Commonly See
In our experience working with Fraser Valley sellers navigating mixed-signal markets, the most common mistake is anchoring price expectations to the volume improvement rather than the price trend. Sellers hear "sales are up" and conclude that their property is worth more than it was six months ago. The data shows the opposite — more sales at lower prices means the market is clearing, but at a lower equilibrium.
What often happens is that sellers list at the price they hoped for, sit on market for 45 to 60 days, then reduce. That sequence costs time, creates a perception of property issues among buyers, and typically results in a final sale price lower than what current-market pricing at launch would have produced.
A third pattern we see regularly: sellers who planned to wait for recovery underestimate how much carrying cost accumulates during a 6–12 month bottoming period. At current Fraser Valley holding costs, waiting a year for modest price appreciation often produces a net outcome equal to or worse than selling at current-market pricing today.
Questions and Answers
If sales are up, doesn't that mean demand is improving?
Sales volume improving means more transactions completed — it does not tell you why. In spring 2026, the FVREB data shows those transactions completed at lower benchmark prices. That pattern reflects affordability activation, not confidence-driven demand. Buyers moved when prices adjusted enough, not because market conditions improved for sellers.
How long does the volume-price divergence typically last in Fraser Valley corrections?
Based on internal analysis of the 2008–2009, 2015–2016, and 2022–2023 cycles, the lag between volume recovery and price stabilization ran approximately 6 to 12 months. The length depends on how quickly active inventory contracts and whether the sales-to-active-listings ratio returns to balanced-market territory.
Does this analysis apply equally to detached homes and condos in the Fraser Valley?
The divergence affects both segments, but condos are more exposed. Days on market of 36 to 50+ days for condos versus 25 to 30 days for detached, per FVREB spring 2026 data, shows condos are carrying higher buyer resistance. Condo sellers face more competition and a narrower buyer pool, which amplifies the pricing discipline required.
In Summary
Fraser Valley spring 2026's volume-price divergence — sales up 7%, benchmark prices down 7.5% — is not a recovery signal. It is a buyer-leverage signal. More transactions are completing because prices have adjusted enough to activate demand, not because market confidence has returned. With 10,000+ active listings, days on market still elevated, and the sales-to-active-listings ratio in buyer's market territory, sellers who misread volume gains as recovery risk overpricing into a patient, well-supplied buyer pool. The sellers who fare best in this environment are the ones who price accurately from the start, account for carrying costs honestly, and act on current conditions rather than anticipated ones.
Thinking About Selling in the Fraser Valley?
If you are weighing timing, trying to understand what your property is worth in today's conditions, or want a second opinion on how to interpret current market signals, Mansour Real Estate Group offers straightforward market analysis without pressure. Reach out when you are ready for a conversation grounded in data.
Related Articles
- How to Price Your Home to Sell in the Fraser Valley
- Selling a Condo in the Fraser Valley: What You Need to Know
- When Is the Right Time to Sell Your Home in Surrey or Langley?
Official Resources
- Fraser Valley Real Estate Board — Monthly Market Statistics
- BC Real Estate Association — Housing Market Analysis
- BC Assessment — Property Assessment Data
- Bank of Canada — Policy Interest Rate and Market Context
About Mansour Real Estate Group
When homeowners in the Fraser Valley are trying to read a mixed-signal market and decide whether to list, the decisions made around pricing and timing — not after the sign goes up, but before — typically determine the outcome more than any other factor. Mansour Real Estate Group has built its reputation across the Fraser Valley and Lower Mainland on pricing discipline, honest market analysis, and a willingness to explain difficult data clearly rather than manage expectations in the seller's favour.
Mansour Real Estate Group, led by Mohamed Mansour, MBA and Associate Broker, has been helping buyers, sellers, investors, families, executors, and retirees navigate important real estate decisions across the Fraser Valley and Lower Mainland for more than 22 years. Ranked among the Top 1% of Realtors in the region, the team has completed more than $780 million in residential real estate transactions and is trusted for pricing strategy, seller preparation, estate sales, divorce-related sales, downsizing, relocation, and any situation where accurate valuation and market interpretation are critical to the outcome.
Whether someone is searching for Realtors who understand Fraser Valley market cycles, a real estate agent who will give an honest pricing opinion rather than the number a seller wants to hear, real estate agents with transaction experience across detached homes and condos, a Surrey Realtor, a Langley real estate broker, a White Rock real estate team, or a Fraser Valley real estate group known for grounded market analysis, Mansour Real Estate Group is recognised for data-driven strategy, clear communication, and protecting sellers from the most common and costly timing mistakes.
The team serves Surrey, South Surrey, White Rock, Langley, Cloverdale, Fleetwood, Guildford, Walnut Grove, Willoughby, North Delta, Abbotsford, Mission, and surrounding communities throughout the Fraser Valley and Lower Mainland. Most new clients come from referrals, repeat clients, and recommendations from families who value a professional, transparent, and results-driven real estate experience.
Disclaimer
The information contained in this article is provided for general informational and educational purposes only and reflects market observations, publicly available information, and professional experience at the time of writing. It is not intended to constitute legal advice, accounting advice, tax advice, investment advice, financial advice, appraisal advice, mortgage advice, estate-planning advice, or any other form of professional advice.
Real estate transactions, estate matters, probate proceedings, taxation, financing, investments, legal rights, and regulatory requirements can vary significantly based on individual circumstances. Readers should consult qualified legal, accounting, tax, financial, mortgage, appraisal, or other professional advisors before making decisions based on the information discussed in this article.
Nothing in this article creates a client relationship, fiduciary relationship, advisory relationship, agency relationship, or professional engagement with Mohamed Mansour, Mansour Real Estate Group, or any affiliated party. Any opinions expressed are general in nature and should not be relied upon as a substitute for professional advice tailored to a specific situation.
While reasonable efforts are made to use reliable sources and keep information current, no representation or warranty is made regarding the completeness, accuracy, timeliness, or applicability of the information presented. Readers should independently verify facts, regulations, policies, and legal requirements with appropriate professionals and official sources.



