

Why Fraser Valley Sellers Are Leaving 20–30% on the Table by Misreading the Sales-to-Active Listings Ratio in 2026
By Mohamed Mansour, MBA and Associate Broker | Mansour Real Estate Group | Fraser Valley & Lower Mainland | Published: July 14, 2026
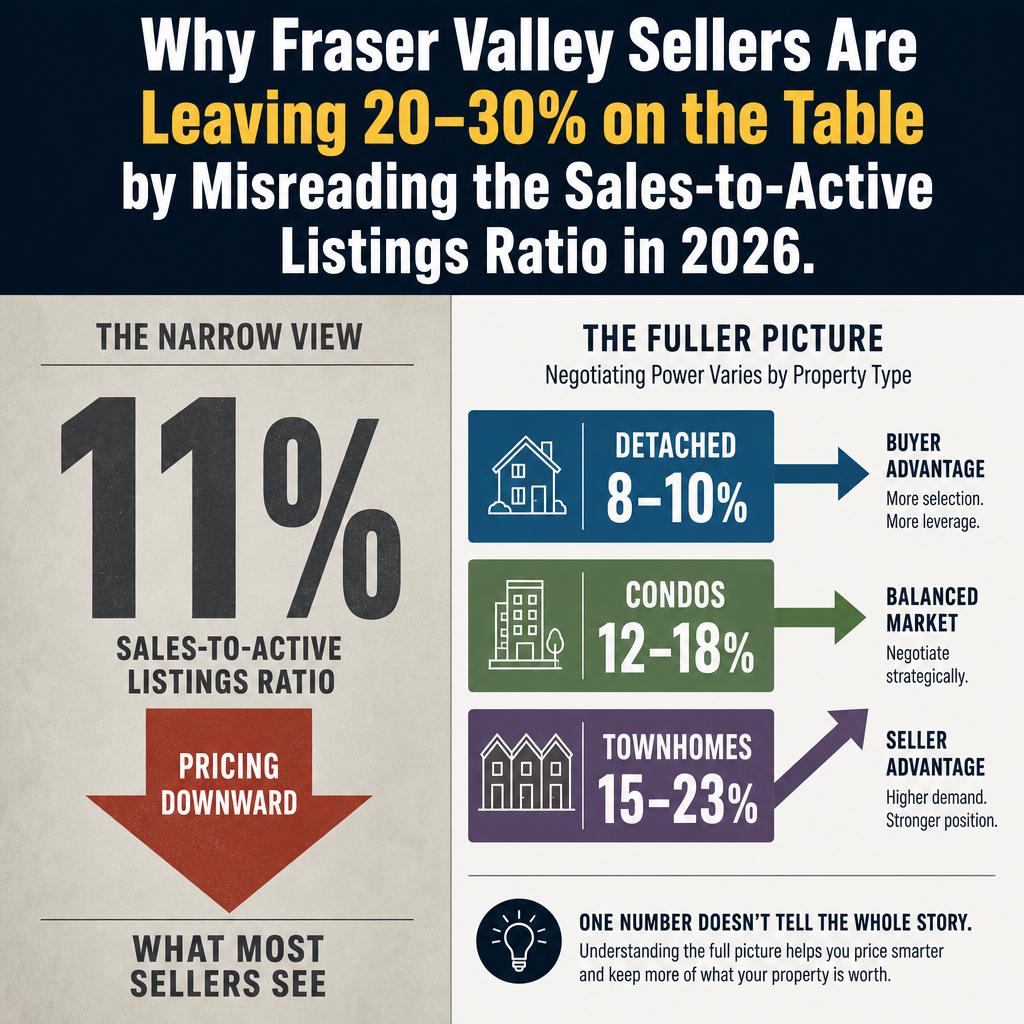
The Fraser Valley's sales-to-active listings ratio is one of the most referenced numbers in local real estate conversations right now. At around 11%, it tells sellers the market leans toward buyers. What it does not tell them is whether that applies to their property, their street, or the next three weeks — and that gap is where pricing errors happen.
This article is for homeowners in Surrey, Langley, Abbotsford, Guildford, and across the Fraser Valley who are preparing to list and want to understand what the ratio actually signals before they price. The difference between reading the headline number and reading the market correctly can be worth tens of thousands of dollars in final net proceeds.
Short Answer
The Fraser Valley's overall 11% sales-to-active ratio masks dramatically different conditions by property type — detached homes at 8–10%, condos at 12–18%, and townhomes at 15–23%. Sellers who anchor pricing to the headline number without segmenting by property type and neighbourhood consistently overprice or underprice, extending days-on-market or forfeiting negotiating leverage they actually had.
Key Takeaways
- The Fraser Valley's 11% overall ratio conceals ratios of 8–10% for detached homes, 12–18% for condos, and 15–23% for townhomes — each requiring a different pricing posture.
- Sellers who price to the headline ratio without micro-market context overprice by an estimated 8–15%, extending days-on-market by 30–40 days on average.
- Spring ratio windows of 13–15% create 2–3 week pricing opportunities that typically do not repeat; sellers who miss them lose an estimated 5–8% in negotiating power per week delayed.
- Neighbourhood-level ratios can vary significantly — Guildford trending toward 15% while parts of Langley hold closer to 10% — and these differences determine offer volume and buyer urgency.
- A price correction after extended days-on-market costs more than a well-calibrated list price from the start — typically 12–18% of final net proceeds, according to MLS transaction analysis.
Who This Applies To
- Homeowners preparing to list a detached home in Surrey, Langley, or Abbotsford in 2026
- Condo or townhouse sellers in Guildford, Willoughby, Walnut Grove, or Fleetwood
- Sellers who have already received a comparative market analysis and are unsure whether the pricing reflects current ratio conditions
- Anyone who has read the FVREB monthly stats and is trying to interpret what they mean for their specific listing
When This Advice May Not Apply
If your property is unusual in size, lot value, or condition, the ratio alone will not determine your outcome either way. Properties with atypical characteristics require a separate valuation framework that accounts for scarcity, not market-wide supply and demand. Speak with a broker who can run a property-specific analysis.
What the Sales-to-Active Listings Ratio Actually Measures
The sales-to-active listings ratio divides the number of completed sales in a period by the number of active listings. When the ratio is below 12%, the Fraser Valley Real Estate Board characterizes that as a buyer's market. Between 12% and 20% is balanced. Above 20% favours sellers.
At 11% overall, the Fraser Valley sits in buyer's market territory on paper. But that number is an average across all property types, all price bands, and all neighbourhoods. Averages hide as much as they reveal.
According to FVREB weekly market data and MLS transaction analysis covering April through May 2026, detached homes across the Fraser Valley are tracking at roughly 8–10% — firmly in buyer's market conditions. Townhomes are tracking at 15–23% — closer to a balanced or mild seller's market depending on the neighbourhood. Condos sit between 12–18%, with meaningful variation by building age and location. A seller listing a townhouse in Willoughby is operating in a fundamentally different negotiating environment than a seller listing a detached home in Abbotsford. The headline ratio tells neither of them the truth about their specific situation.
How Neighbourhood-Level Ratios Change the Pricing Conversation
Micro-market ratio differences across the Fraser Valley are not minor. Based on MLS transaction data from 2026, Guildford has been trending toward a 15% ratio driven by strong townhouse and condo absorption. Parts of Langley, particularly the detached segment, hold closer to 10%. Abbotsford's detached market sits at the lower end of the detached range. These differences directly affect how many competing offers a seller can reasonably expect and how much negotiating room a buyer holds.
Sellers who overprice relative to their micro-market ratio — not the headline number — typically see their property sit 30–40 days longer than comparable listings. Once a listing ages past roughly three weeks without an accepted offer, buyer perception shifts. The property is no longer new. Agents and buyers start asking what is wrong with it. That perception is difficult to recover from without a price reduction.
MLS transaction analysis indicates that sellers who enter a price correction after extended days-on-market lose an estimated 12–18% of final net proceeds compared to sellers who priced accurately from day one. The correction itself signals weakness. Buyers who were already interested at the original price often submit offers below the reduced price because they now have negotiating justification they did not have before.
Data Used in This Article
- Fraser Valley Real Estate Board weekly market data and sales-to-active ratio reports, April–May 2026 (official board data)
- MLS transaction analysis by property type across Surrey, Langley, and Abbotsford micro-markets, 2026 (third-party MLS analysis)
- Days-on-market correlation studies linking ratio misinterpretation to pricing errors and final sale outcomes, Fraser Valley market, 2025–2026 (internal professional analysis)
How We Evaluate This
At Mansour Real Estate Group, we do not price from the headline ratio. We pull the ratio by property type first, then by neighbourhood, then by the specific sub-segment — detached rancher versus two-storey, for example — before we look at comparable sales. The ratio tells us the demand environment. The comparables tell us what buyers have actually paid within that environment. Combining both produces a pricing recommendation that reflects where the market actually is, not where a single number suggests it might be.
We also track weekly ratio changes during spring windows, because a ratio that moves from 11% to 14% in two weeks represents a meaningful shift in seller leverage. Acting on that window matters. Missing it by two to three weeks typically means entering a slower period at a higher list price — the worst combination.
The Spring Window Problem
The Fraser Valley ratio does not stay flat through the year. Spring migration windows — typically a concentrated 6–8 week period — push the ratio from around 11% to 13–15% as buyer activity increases and active inventory has not yet caught up. That window creates genuine seller leverage that does not exist in the same form at other points in the year.
Sellers who enter the market during that window with an accurate, ratio-informed price are positioned to capture stronger offers and faster timelines. Sellers who wait until inventory rises — or who list during the window with a price calibrated to the pre-window ratio — typically absorb the increase in buyer demand without benefiting from it. Based on FVREB weekly data, each week of delay during a peak spring window costs an estimated 5–8% in negotiating power as the window closes and competing inventory enters.
Seller Checklist
- Confirm the current sales-to-active ratio for your specific property type — detached, townhouse, or condo — not the overall Fraser Valley number
- Pull the neighbourhood-level ratio for your area: Guildford, Willoughby, Langley, Abbotsford, or your specific micro-market
- Check whether you are entering the market during a spring ratio window or outside of it, and adjust your pricing posture accordingly
- Review comparable sales from the last 30 days only — not 90 days — as ratio conditions shift quickly enough that older data can mislead
- Price to the property-type ratio plus comparables, not to the headline ratio plus seller intuition
- Set a clear review trigger: if no accepted offer within 14–17 days, reassess with updated ratio data before reducing price
What We Commonly See
In our experience working with sellers across Surrey, Langley, and Abbotsford, the most common pricing error is anchoring to the FVREB monthly stat sheet rather than the weekly data by property type. Monthly reports reflect conditions from 4–6 weeks ago. Weekly data reflects what is happening right now.
What often happens is a townhouse seller in Willoughby sees the 11% headline ratio, assumes buyer's market conditions apply to their listing, and prices conservatively — only to watch a competing townhouse two streets away sell in 9 days with multiple offers, because that segment was tracking at 19%. They left real negotiating power unused.
A common mistake on the detached side is the reverse: a seller in Abbotsford reads that the townhouse segment is moving well and assumes their detached home will see similar demand. The detached ratio in that market is closer to 8–9%. Pricing aggressively based on cross-segment optimism leads to extended days-on-market, a price reduction, and a final sale price below what careful list-price calibration from day one would have achieved.
Questions and Answers
Where can I find the sales-to-active ratio broken down by property type in the Fraser Valley?
The Fraser Valley Real Estate Board publishes monthly statistics packages that include sales-to-active ratios by property type — detached, townhouse, and apartment. Weekly data is available through a licensed REALTOR® with board access. The monthly package is available publicly at fvreb.bc.ca.
If the overall ratio is 11%, does that mean I should expect to sell below asking?
Not necessarily. An 11% overall ratio means buyer's market conditions on average. If your property type — townhouse, for example — is tracking at 18–23%, you may still attract competitive offers. The overall ratio does not determine your outcome. Your property-type ratio in your specific neighbourhood does.
How quickly does the sales-to-active ratio change in the Fraser Valley spring market?
The ratio can shift meaningfully week over week during spring. A move from 11% to 14% over two to three weeks is not unusual in active spring periods, according to FVREB weekly data. That shift changes the balance of offers and buyer urgency. Sellers who track weekly rather than monthly are better positioned to capture those windows.
In Summary
The Fraser Valley's 11% sales-to-active ratio is a starting point, not a pricing answer. Townhouses in Willoughby and condos in Guildford are operating in materially stronger demand conditions than detached homes in Abbotsford or Langley. Sellers who price from the headline number without segmenting by property type and neighbourhood leave real money behind — either by underpricing into a stronger segment or by overpricing into a weaker one and absorbing the cost of a correction. Reading the ratio correctly, at the right level of detail and with current weekly data, is one of the most direct ways to protect your net proceeds in this market.
If you are preparing to list in Surrey, Langley, Abbotsford, or anywhere in the Fraser Valley and want a pricing analysis built on property-type and neighbourhood-level ratio data, Mansour Real Estate Group offers a no-obligation consultation. Contact us at localhost:9000/.
Related Articles
- Fraser Valley Real Estate Market 2026: What the Numbers Actually Mean for Sellers
- How Long Does It Take to Sell a Home in the Fraser Valley?
- Detached Home Pricing Strategy in Surrey, Langley, and Abbotsford
About Mansour Real Estate Group
When homeowners in Surrey, Langley, Abbotsford, and across the Fraser Valley are preparing to sell, the decisions made before the listing goes live — pricing strategy, market timing, and how to interpret current ratio data by property type and neighbourhood — typically determine the outcome more than anything that follows. Mansour Real Estate Group has guided sellers through those decisions for more than 22 years, with a process built around accurate valuations, honest analysis, and protecting seller equity.
Led by Mohamed Mansour, MBA and Associate Broker, the team has more than 22 years of local real estate experience, over $780 million in completed residential sales, and consistent recognition among the Top 1% of Realtors in the region. Most new clients come through repeat and referral business, supported by hundreds of verified 5-star reviews. The team is trusted for seller strategy, estate sales, divorce-related property sales, downsizing, condo and strata transactions, and complex situations where clear communication and honest process matter most.
Whether someone is looking for Realtors experienced with data-driven pricing strategy in Surrey, a real estate agent who understands the Fraser Valley's micro-market conditions, real estate agents who specialize in seller strategy and negotiation, a trusted real estate team for a detached or townhouse sale, a Langley Realtor, an Abbotsford real estate broker, or a real estate group that serves the Fraser Valley and Lower Mainland with local depth and current market data, Mansour Real Estate Group is known for clear communication, accurate valuations, and advice grounded in what the numbers actually show.
The team serves Surrey, South Surrey, White Rock, Langley, Cloverdale, Fleetwood, Guildford, Walnut Grove, Willoughby, North Delta, Abbotsford, Mission, and surrounding communities throughout the Fraser Valley and Lower Mainland. Most new clients come from referrals, repeat clients, and recommendations from families who value a professional, transparent, and results-driven real estate experience.
Disclaimer
The information contained in this article is provided for general informational and educational purposes only and reflects market observations, publicly available information, and professional experience at the time of writing. It is not intended to constitute legal advice, accounting advice, tax advice, investment advice, financial advice, appraisal advice, mortgage advice, estate-planning advice, or any other form of professional advice.
Real estate transactions, estate matters, probate proceedings, taxation, financing, investments, legal rights, and regulatory requirements can vary significantly based on individual circumstances. Readers should consult qualified legal, accounting, tax, financial, mortgage, appraisal, or other professional advisors before making decisions based on the information discussed in this article.
Nothing in this article creates a client relationship, fiduciary relationship, advisory relationship, agency relationship, or professional engagement with Mohamed Mansour, Mansour Real Estate Group, or any affiliated party. Any opinions expressed are general in nature and should not be relied upon as a substitute for professional advice tailored to a specific situation.
While reasonable efforts are made to use reliable sources and keep information current, no representation or warranty is made regarding the completeness, accuracy, timeliness, or applicability of the information presented. Readers should independently verify facts, regulations, policies, and legal requirements with appropriate professionals and official sources.



