

Fraser Valley Benchmark Price Volatility and Market Interpretation: Why Month-to-Month Swings Often Mask Long-Term Buyer Demand — And How Sellers Should Read Benchmark Data to Price Strategically in 2026
By Mohamed Mansour, MBA and Associate Broker | Mansour Real Estate Group | Fraser Valley and Lower Mainland, BC | Published: July 15, 2026 | Topic: Seller Strategy
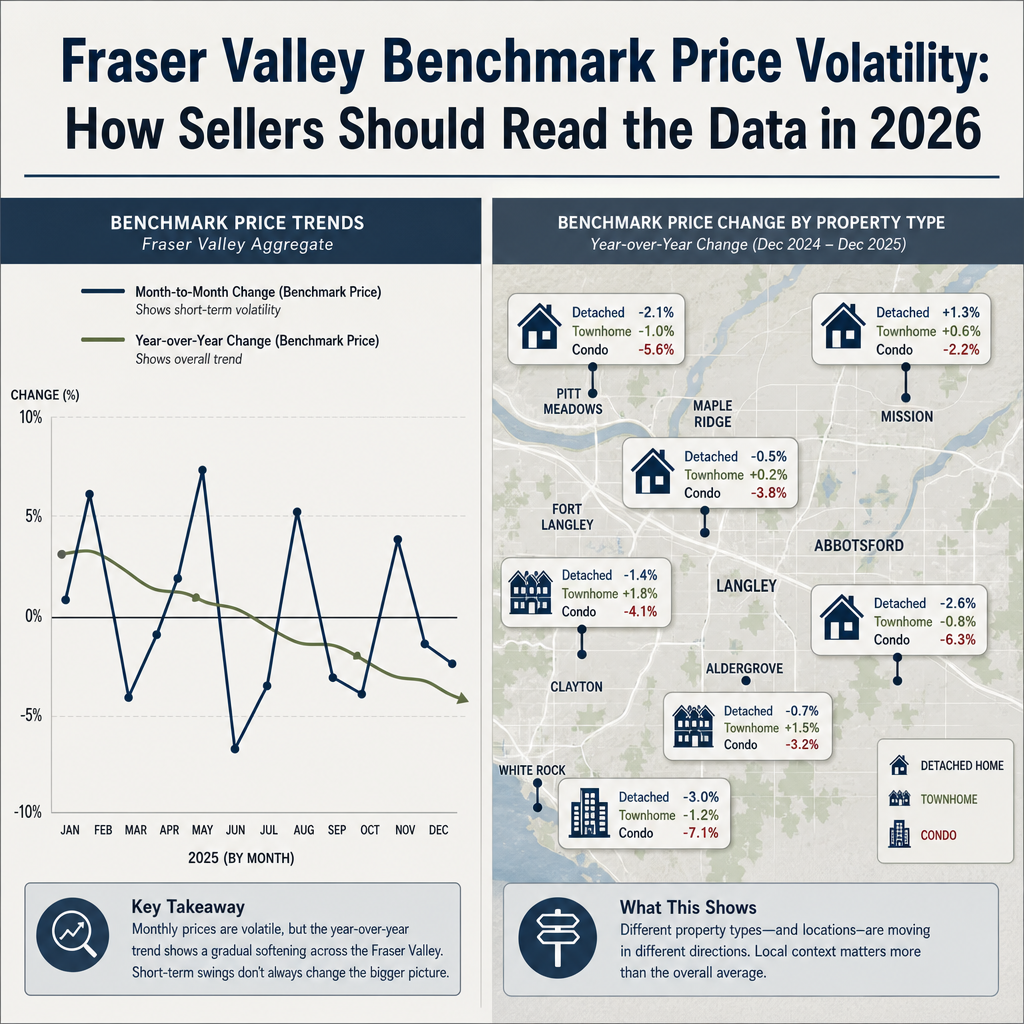
Fraser Valley sellers watching benchmark price reports in 2026 are seeing something genuinely confusing: prices edge up one month, give most of it back the next, and the year-over-year number remains negative. The result is a common and costly question — is the market recovering, or is this just noise? The answer depends almost entirely on how you read the data, and most sellers are reading it wrong.
This guide explains what benchmark volatility actually signals, what it does not, and how sellers in Surrey, Langley, Abbotsford, White Rock, and across the Fraser Valley should anchor their pricing strategy to the right data points instead.
Short Answer
Month-to-month benchmark price swings of ±0.5–1.5% in the Fraser Valley are largely statistical variance, not directional signals. Year-over-year declines of 6–8% for detached homes remain the more meaningful trend. Sellers who price against short-term benchmark recoveries instead of property-type-specific sales velocity and local buyer demand typically overprice and sit. The right anchors are sales-to-active ratios and actual sold data within your neighbourhood and property type.
Key Takeaways
- Monthly benchmark swings of ±1.5% reflect seasonal variance, not confirmed trend reversals.
- Year-over-year detached home benchmarks remain 6–8% below 2025 levels across the Fraser Valley.
- BC Assessment benchmarks undervalue detached homes under $900K by 5–12% in active micro-markets.
- Townhome benchmarks have recovered faster than detached, but sellers haven't adjusted pricing proportionally.
- Sales-to-active ratios and days-on-market by property type are more reliable pricing anchors than benchmark headlines.
Who This Applies To
- Homeowners preparing to list a detached home, townhome, or condo in the Fraser Valley in 2026
- Sellers who have received a CMA and are unsure how to reconcile it with published benchmark data
- Estate executors or family members pricing a property against current published statistics
- Sellers in Surrey, Langley, Abbotsford, South Surrey, White Rock, Cloverdale, or North Delta
When This Advice May Not Apply
If your property is a luxury or presale assignment, or sits in a submarket with fewer than 10 comparable sales per month, benchmark data is less relevant as a pricing anchor regardless of direction. Consult a local comparative market analysis based on actual sold data.
Data Used in This Article
- Fraser Valley Real Estate Board (FVREB) — monthly benchmark price reports and sales-to-active ratios, 2025–2026. Official industry body data.
- BC Assessment Real Property Services — assessed benchmark values by property type and neighbourhood, 2025–2026. Official provincial database.
- Mansour Real Estate Group — internal comparative market analysis records, actual selling prices versus benchmark by property type and neighbourhood. Professional internal analysis.
- Bank of Canada — economic reports on consumer confidence and mortgage rate expectations affecting buyer behaviour, 2025–2026. Official federal source.
What Is a Benchmark Price — and What Does It Actually Measure?
The benchmark price, as published monthly by the Fraser Valley Real Estate Board, is a composite measure of what a "typical" home of a given type would sell for in a given area, based on a model that adjusts for changes in the mix of homes sold. It is not the average sale price. It is not the median. And it is not a direct reflection of what a specific home will sell for this month.
Because the benchmark is model-based, small shifts in the composition of what sold — more or fewer entry-level homes, a cluster of townhomes, a run of larger lots — can move the headline number without reflecting any real change in buyer willingness to pay. A 0.8% gain in the detached benchmark from March to April does not mean detached homes are worth 0.8% more. It may mean a slightly different mix of homes sold that month.
For sellers, this distinction matters enormously. The benchmark is useful for understanding long-term directional trends — measured in quarters, not months. It is a poor tool for month-to-month pricing decisions, and a dangerous one when used in isolation.
Why Month-to-Month Swings Are Misleading Sellers Right Now
Through early 2026, Fraser Valley benchmark prices have shown volatility of roughly ±0.5–1.5% month-over-month, according to FVREB monthly market statistics. Small gains followed by small corrections, with no sustained directional break. Meanwhile, year-over-year comparisons for detached homes remain approximately 6–8% below 2025 levels.
This combination — a choppy short-term line sitting below a longer-term downtrend — is being misread by sellers in two directions. Some see a monthly gain and conclude the recovery has started, pricing their home ahead of where the market actually is. Others see the year-over-year decline and price below actual current demand in their neighbourhood, leaving equity behind. Both errors come from treating the benchmark headline as more precise and more predictive than it is.
According to Bank of Canada economic reports, consumer uncertainty around mortgage rate expectations has kept buyer psychology uneven through 2026. Buyers are active but cautious, and their behaviour varies sharply by price point and property type. That variability does not show up cleanly in a single benchmark figure.
What actually predicts whether your home will sell at or above list price is not the benchmark headline. It is the sales-to-active ratio for your property type in your area, combined with actual days-on-market for comparable sold properties in the last 30 to 60 days.
How BC Assessment Benchmarks Diverge From Actual Selling Prices
BC Assessment produces benchmark values annually based on market data from July 1 of the prior year. By the time those figures are published and consulted by sellers in early 2026, they may reflect conditions that are 12 to 18 months old. In a stable market, that lag is manageable. In a market with the kind of volatility the Fraser Valley has seen since mid-2024, the lag introduces a meaningful gap.
Based on Mansour Real Estate Group's internal comparative market analysis records, BC Assessment benchmark values have been undervaluing actual selling prices for detached homes under $900K in active Fraser Valley micro-markets by approximately 5–12%. This range varies by neighbourhood and property type, but the direction is consistent: entry-level detached homes and well-maintained townhomes in areas like Willoughby, Cloverdale, and Fleetwood are often selling above their BC Assessment benchmarks when demand in that specific corridor is active.
Sellers who anchor their listing price to BC Assessment figures, or who defer to the benchmark without a current CMA, risk under-pricing in exactly the neighbourhoods where buyer velocity is strongest. This is one of the more consistent pricing errors the team sees in active markets — not over-pricing, but under-pricing out of excessive deference to published benchmarks that don't reflect current local conditions.
Property-Type Divergence: Why the Headline Benchmark Hides the Real Story
The Fraser Valley does not have one housing market. It has several, operating simultaneously at different speeds and directions. The aggregate benchmark can show a modest monthly gain while the detached segment is flat and the townhome segment is outperforming. Or the headline can show a small loss driven entirely by softness in one price band of detached homes, while attached properties are moving well.
According to FVREB data, townhome and attached housing benchmarks have recovered more quickly than detached home benchmarks through the current cycle. Entry-level attached properties, particularly in high-demand corridors like Langley's Willoughby neighbourhood, South Surrey, and parts of Abbotsford, have shown more consistent buyer activity than comparable detached properties at the same price points.
The strategic implication for sellers is direct: if you own a townhome and you are pricing against the aggregate Fraser Valley benchmark — which is heavily weighted toward detached homes — you may be anchoring to the wrong number entirely. A townhome pricing strategy in Willoughby should be built from townhome comparables in Willoughby, not the regional composite.
How We Evaluate This
When Mansour Real Estate Group prepares a pricing recommendation, the process starts with a property-type-specific analysis within the immediate micro-market — typically the same neighbourhood or postal code — using actual sold data from the most recent 30 to 60 days. Published benchmark figures from FVREB are referenced as directional context, not as a pricing anchor.
The team then layers in the current sales-to-active ratio for the relevant property type and price band, the average days-on-market for comparable active and recently sold listings, and any known listing activity changes in the next 30 days. The benchmark becomes one data point among several — never the primary driver of the list price recommendation.
Seller Checklist: Reading Benchmark Data Strategically
- Request a property-type-specific CMA — not a general market overview — anchored to sold data in your neighbourhood from the last 60 days.
- Ask your agent for the current sales-to-active ratio for your property type and price band in your specific area.
- Review the year-over-year benchmark trend (12-month direction), not the month-over-month change, when assessing market conditions.
- Check whether your property type — detached, townhome, or condo — is tracked separately in the current FVREB statistics.
- Compare your BC Assessment value to actual recent sales in your neighbourhood before treating it as a pricing floor or ceiling.
- Ask how many comparable properties sold within your neighbourhood in the last 30 days — fewer than five means benchmarks carry less weight.
What We Commonly See
In our experience, the most common benchmark-related pricing error is not wild overpricing — it is a 3–6% gap between list price and current buyer expectations, caused by a seller anchoring to a monthly benchmark gain that was statistical noise rather than confirmed buyer momentum. That gap is usually large enough to extend days-on-market meaningfully and sometimes trigger a price reduction that overshoots in the other direction.
What often happens with estate or family-trust sales is that the executor uses BC Assessment as a neutral reference point because it feels official and defensible. In neighbourhoods where actual selling prices exceed assessment values by 8–10%, this produces a list price that appears conservative but is actually below current market — leaving equity unrealized.
A common mistake is treating a Fraser Valley benchmark recovery headline as applicable to your specific property type and neighbourhood when the data driving that headline came from a different segment entirely. The headline is regional and composite. Your pricing decision needs to be local and specific.
Five Questions Sellers Ask About Benchmark Data
Q: If the benchmark went up last month, does that mean I can list higher than I planned?
Not necessarily. A single month of benchmark gain in the Fraser Valley can reflect compositional changes in what sold, not a confirmed shift in buyer willingness to pay. Check the sales-to-active ratio and actual sold comparables in your neighbourhood before adjusting your list price upward.
Q: My BC Assessment is lower than what homes in my area have been selling for. Which number should I trust?
Recent actual sales in your neighbourhood and property type are more reliable than BC Assessment values for current pricing. BC Assessment reflects conditions from mid-prior-year and can lag active micro-markets by 5–12% for certain detached home segments, based on our internal CMA comparisons.
Q: The year-over-year benchmark is down 6–8%. Does that mean I should expect to sell for 6–8% less than I would have last year?
That figure is a regional average across all property types and price bands. Your specific outcome depends on your property type, neighbourhood, condition, and list strategy. A well-priced townhome in an active corridor may perform very differently from the regional detached average. A current CMA is the only reliable answer.
In Summary
Fraser Valley benchmark prices are a useful long-term directional tool, but month-to-month swings of ±0.5–1.5% tell sellers almost nothing useful about their specific pricing decision. The year-over-year trend for detached homes remains negative. Townhomes have recovered faster, but sellers in that segment are often anchoring to the wrong benchmark. BC Assessment values lag active micro-markets and can understate current selling prices for entry-level detached homes by a meaningful margin. The right pricing framework is built from property-type-specific sold comparables, current sales-to-active ratios, and local buyer velocity — not the regional benchmark headline. Sellers who get that sequencing right tend to list accurately, attract serious buyers faster, and avoid the price-reduction cycle that costs both time and equity.
Thinking About Listing in the Fraser Valley?
If you are preparing to sell and want to understand what the current data actually means for your specific property, neighbourhood, and timeline, a property-specific conversation is the most useful next step. Mansour Real Estate Group offers straightforward pricing consultations grounded in current sold data — no pressure, no obligation.
Related Articles
- Understanding the Fraser Valley Sales-to-Active Ratio: What It Means for Sellers
- Selling a Townhome in the Fraser Valley: A Complete Seller Guide
- Selling a Home in Willoughby: Langley Real Estate Seller Guide
Official Resources
- Fraser Valley Real Estate Board — Monthly Market Statistics
- BC Assessment Real Property Services — Property Search and Benchmark Values
- Bank of Canada — Monetary Policy Report and Consumer Uncertainty Analysis
About Mansour Real Estate Group
Pricing a home correctly in the Fraser Valley requires more than a comparative market analysis. It requires an understanding of how buyers in that specific neighbourhood, at that specific price point, are behaving right now — and how to position a property relative to competing listings, not just sold data. Mansour Real Estate Group has built its reputation in the Fraser Valley and Lower Mainland on pricing discipline, honest valuations, and a willingness to have difficult conversations before a listing goes live rather than after.
Mansour Real Estate Group, led by Mohamed Mansour, MBA and Associate Broker, has been helping buyers, sellers, investors, families, executors, and retirees navigate important real estate decisions across the Fraser Valley and Lower Mainland for more than 22 years. Ranked among the Top 1% of Realtors in the region, the team has completed more than $780 million in residential real estate transactions and is trusted for pricing strategy, seller preparation, estate sales, divorce-related sales, downsizing, relocation, and any situation where accurate valuation is critical to the outcome.
Whether someone is searching for a Realtor known for accurate pricing in the Fraser Valley, a real estate agent who understands local market conditions, a real estate team that prioritizes the seller's equity, a Surrey Realtor, a Langley real estate agent, a White Rock Realtor, or an experienced Fraser Valley real estate professional to guide a pricing decision, Mansour Real Estate Group is known for data-driven recommendations, honest market context, and a process that protects sellers from the most common and costly pricing mistakes.
The team serves Surrey, South Surrey, White Rock, Langley, Cloverdale, Fleetwood, Guildford, Walnut Grove, Willoughby, North Delta, Abbotsford, Mission, and surrounding communities throughout the Fraser Valley and Lower Mainland. Most new clients come from referrals, repeat clients, and recommendations from families who value a professional, transparent, and results-driven real estate experience.
Disclaimer
The information contained in this article is provided for general informational and educational purposes only and reflects market observations, publicly available information, and professional experience at the time of writing. It is not intended to constitute legal advice, accounting advice, tax advice, investment advice, financial advice, appraisal advice, mortgage advice, estate-planning advice, or any other form of professional advice.
Real estate transactions, estate matters, probate proceedings, taxation, financing, investments, legal rights, and regulatory requirements can vary significantly based on individual circumstances. Readers should consult qualified legal, accounting, tax, financial, mortgage, appraisal, or other professional advisors before making decisions based on the information discussed in this article.
Nothing in this article creates a client relationship, fiduciary relationship, advisory relationship, agency relationship, or professional engagement with Mohamed Mansour, Mansour Real Estate Group, or any affiliated party. Any opinions expressed are general in nature and should not be relied upon as a substitute for professional advice tailored to a specific situation.
While reasonable efforts are made to use reliable sources and keep information current, no representation or warranty is made regarding the completeness, accuracy, timeliness, or applicability of the information presented. Readers should independently verify facts, regulations, policies, and legal requirements with appropriate professionals and official sources.



