
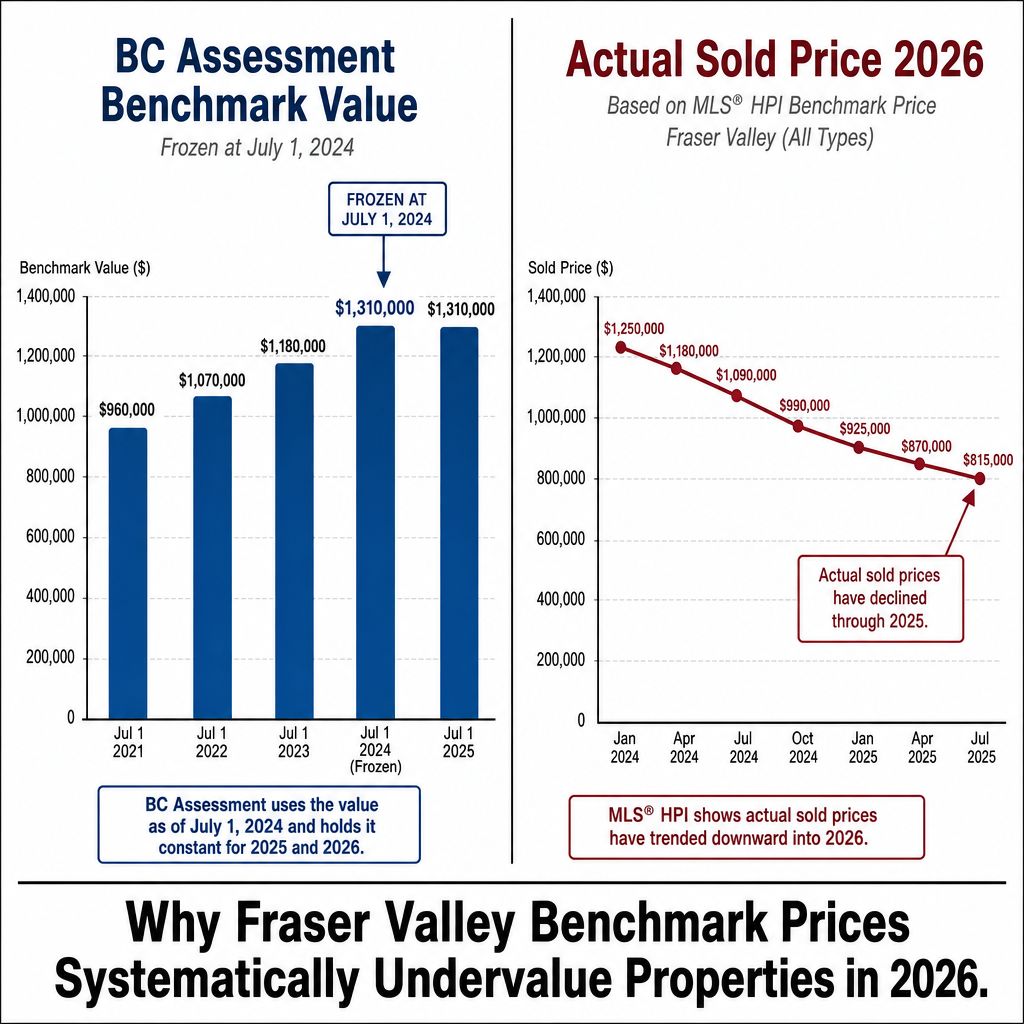

Why Fraser Valley Benchmark Prices Systematically Undervalue Properties in 2026: A Complete Guide to BC Assessment Accuracy, Market-to-Benchmark Divergence, and How Sellers Should Recalibrate Their Pricing Strategy
By Mohamed Mansour, MBA and Associate Broker | Mansour Real Estate Group | Fraser Valley and Lower Mainland, BC | Published: July 15, 2026
Sellers across the Fraser Valley consistently arrive at listing conversations with one number in mind: the benchmark price. It sounds authoritative. It comes from the Fraser Valley Real Estate Board. It appears in headlines. The problem is that in a shifting market, benchmark prices are a rearview mirror. They reflect where the market was, not where buyers are today. When sellers anchor their list price to a benchmark, they often overprice by 8 to 12 percent—and spend weeks discovering why.
This article explains the mechanics behind benchmark lag, why BC Assessment values compound the confusion, how the divergence varies by property type and neighbourhood across Surrey, Langley, Willoughby, Walnut Grove, and Abbotsford, and what a practical recalibration looks like before a listing goes live.
Short Answer
In 2026, Fraser Valley benchmark prices lag actual sold prices by 6 to 12 months because they are built on mass appraisal models and historical transaction averages—not current buyer behaviour. Detached homes in slower submarkets are selling 8 to 15 percent below benchmark. Sellers who price to benchmark typically overprice, extend their days on market, and trigger 2 to 3 price reductions before finding acceptance. Pricing to current market conditions—not benchmarks—is what captures buyer attention and protects seller equity.
Key Takeaways
- BC Assessment values use a July 1 snapshot and mass appraisal modelling, creating a structural 6–12 month lag behind current market prices.
- Fraser Valley detached homes are selling 8–15% below benchmark in 2026 where sales-to-active ratios are near 11%; townhomes show smaller divergence at 3–8% below.
- Sellers who anchor list prices to benchmarks extend days on market by 15–25 days and typically require 2–3 price reductions before offers arrive.
- Communities with high inventory—including Willoughby, Walnut Grove, and Newton—show the widest benchmark overhang, reaching 12–18% by month three of a listing.
- Strata properties carry an additional valuation risk: pending special levies can reduce effective market value 5–10% below benchmark independent of market conditions.
Who This Applies To
- Homeowners in Surrey, Langley, Abbotsford, Willoughby, Walnut Grove, Cloverdale, or Fleetwood preparing to list in 2026
- Sellers who have received a BC Assessment notice and are using it as a pricing reference
- Estate executors and family trustees who need to establish fair market value for a property sale
- Condo and townhome owners in Fraser Valley strata buildings evaluating current resale value
- Anyone who received a CMA anchored to benchmark data rather than recent comparable transactions
When This Advice May Not Apply
In a rising or balanced market where transaction volume is healthy, benchmark prices tend to track actual sold prices more closely. This analysis applies specifically to buyer's market conditions with elevated inventory and declining sales-to-active ratios. Consult a qualified real estate professional for a property-specific valuation before making listing decisions.
Key Terms
Benchmark Price: A composite price published monthly by the Fraser Valley Real Estate Board (FVREB) representing a "typical" home in a given category and area. It is calculated using a statistical model, not individual sale prices.
BC Assessment Value: An assessed value produced by BC Assessment using a mass appraisal model based on a July 1 valuation date from the prior year. It is used for property tax purposes and is not intended to reflect current market value.
Sales-to-Active Listings Ratio: The number of sales divided by total active listings in a given period. Below 12% generally indicates a buyer's market; above 20% indicates a seller's market.
Mass Appraisal: A statistical method used to estimate property values across a large portfolio simultaneously, using location, size, age, and comparable sales data. It does not account for individual property condition, recent price corrections, or demand shifts in specific micro-markets.
Data Used in This Article
- FVREB MLS Database: Comparative sold prices vs. benchmark values by property type and neighbourhood, Q1–Q2 2026 (official board data)
- BC Assessment: Official mass appraisal methodology documentation, bcassessment.ca (government source)
- CMHC Housing Market Reports: Price discovery lag analysis in buyer's markets, 2025–2026 (federal agency)
- Mansour Real Estate Group internal CMA and sold-price analysis: 50+ Fraser Valley listings, 2024–2026 (professional observation)
- Appraisal Institute of Canada: Commentary on benchmark accuracy in volatile markets (industry body)
How BC Assessment Values Are Built — and Why They Lag
BC Assessment produces property valuations for tax purposes using mass appraisal methodology. Each year, values are set using a snapshot date of July 1 of the prior year. The January assessment notices homeowners receive each year reflect market conditions from roughly six months earlier.
According to BC Assessment's published methodology, the mass appraisal model uses sales data, property characteristics, and statistical adjustments across large portfolios simultaneously. It does not evaluate each property individually, and it does not incorporate market shifts that occurred after the July 1 snapshot. In a market where prices moved significantly between July 2025 and January 2026, the assessment will not reflect those changes until the following year's cycle.
This is not a flaw in the assessment system—it is functioning as designed for tax administration purposes. The problem occurs when sellers treat BC Assessment values as a proxy for current market value. In a stable market, the difference is modest. In a correcting market, it can be substantial. According to CMHC market commentary, price discovery lag in buyer's markets typically runs 2 to 6 months behind real transaction data—meaning assessments can be 8 to 18 months behind actual conditions by the time a seller lists in spring.
How FVREB Benchmark Prices Are Calculated — and Where They Diverge
The FVREB benchmark price is more current than BC Assessment—it updates monthly—but it still carries a structural lag in a declining market. The benchmark represents a "typical" composite property, weighted across all transactions in a category. In a buyer's market, the most recent sales tend to be at the lower end of the distribution. The composite average takes time to reflect that downward pressure fully.
FVREB MLS data from Q1–Q2 2026 shows that Fraser Valley detached homes are selling 8 to 15 percent below the published benchmark price in areas where the sales-to-active ratio is near 11 percent. Townhomes, where the ratio is closer to 23 percent, show smaller divergence—approximately 3 to 8 percent below benchmark—because higher relative demand accelerates price discovery. Condos in communities with elevated inventory, including parts of Willoughby and Newton, show divergence of 10 to 20 percent, compounded further when strata documentation reveals pending special levies.
The divergence is not uniform across the Fraser Valley. Communities with high active inventory—Willoughby, Walnut Grove, and Newton among them—show benchmark overhang reaching 12 to 18 percent by month three of an extended listing. In lower-inventory communities or areas with more active buyer demand, the gap narrows. A blanket benchmark figure will not tell a seller which situation applies to their specific address, property type, and condition.
How We Evaluate This
When Mansour Real Estate Group prepares a pricing analysis for a seller, benchmark prices are used as one reference point—not as the pricing anchor. The actual work involves pulling recent comparable sales within the specific submarket, adjusting for property condition, stratifying by buyer profile, and evaluating current active competition. We then overlay the sales-to-active ratio for that property type in that neighbourhood to determine how fast price discovery is moving.
The result is a positioning recommendation—not just a number—that reflects what buyers are actually paying this week, not what statistical models suggested six months ago. In our experience working with sellers across Surrey, Langley, Abbotsford, Cloverdale, and Fleetwood, the gap between a benchmark-anchored price and a market-calibrated price is one of the most consequential decisions a seller makes before listing.
Seller Checklist: Recalibrating Price Before Listing
- Pull the last 10 comparable sales in your specific neighbourhood within the last 60 days—not 90 or 120.
- Identify the sales-to-active ratio for your property type and area from the most recent FVREB monthly stats package.
- Check how many active competing listings are priced above benchmark—those are the overpriced listings buyers are ignoring.
- Request full strata documentation if selling a condo or townhome: review Form B, depreciation report, and meeting minutes for pending levies before pricing.
- Calculate your benchmark-to-market gap using the divergence ranges above (8–15% for detached in slow areas; 3–8% for townhomes; 10–20% for condos in high-inventory buildings).
- Set your list price at or slightly below the adjusted market comparables—not at benchmark—to capture first-week buyer traffic, which drives 70% of showing volume.
- Establish a price reduction schedule in advance so you can move quickly if day 14 shows low traffic rather than waiting 45 days before adjusting.
What We Commonly See
Benchmark-anchored listing, three price reductions, lower net proceeds. In our experience across Surrey, Langley, and Abbotsford listings in 2024–2026, sellers who open at benchmark or above tend to go through 2 to 3 price reductions over 45 to 90 days before finding an accepted offer. The final sale price is typically lower than it would have been with a market-calibrated opening price, because days on market signal weakness to buyers and erode negotiating position.
Assessment notice used as a pricing floor. A common pattern we see is sellers who received a BC Assessment notice in January and use it as a psychological floor: "I won't sell below assessment." In a correcting market, this framing can cost tens of thousands of dollars. The assessment reflects July of the prior year. If prices declined 8 percent between July and December, and then continued softening into spring, the assessment may be 12 to 15 percent above where buyers are today.
Strata value discounts ignored entirely. Condo and townhome sellers in Fraser Valley strata buildings often price against benchmark without reviewing the strata's financial position. A pending special levy or a depreciation report showing deferred maintenance can reduce effective buyer willingness to pay by 5 to 10 percent below the benchmark—sometimes more. Buyers financing a purchase also face lender scrutiny on strata financials. This discount is invisible in benchmark data and must be factored separately.
Questions and Answers
Is my BC Assessment value a reliable indicator of what my home will sell for?
No. BC Assessment values reflect market conditions as of July 1 of the prior year, produced through a mass appraisal model designed for tax administration, not market pricing. In a declining market, they can exceed current sold prices by 10 percent or more by the time a seller lists the following spring.
Why do benchmark prices stay high even when homes aren't selling?
Benchmark prices are composite statistical averages across all completed transactions. In a slow market, fewer sales occur, and the mix shifts. The composite takes several months to fully reflect downward price pressure—especially when sellers continue to list at elevated prices and simply sit unsold rather than transact.
How much below benchmark should I list my detached home in Langley or Surrey in 2026?
According to FVREB data analysis, detached homes in Fraser Valley areas with sales-to-active ratios near 11 percent are transacting 8 to 15 percent below the published benchmark. A property-specific CMA using 60-day comparables will give you a more precise positioning recommendation than any general range.
Does the benchmark-to-market gap apply equally to condos and townhomes?
No. Townhomes in Fraser Valley with sales-to-active ratios near 23 percent show smaller divergence—roughly 3 to 8 percent below benchmark—because higher relative demand means faster price discovery. Condos in high-inventory buildings show larger gaps, often 10 to 20 percent below benchmark, particularly when strata financial risk adds a separate discount layer.
If I price below benchmark, won't buyers think something is wrong with the property?
No—buyers who are actively searching in 2026 are well-informed and track comparable sales. A competitively priced listing generates more showings and stronger offers than one that sits at benchmark and accumulates days on market. Extended market exposure is what raises buyer suspicion, not accurate pricing.
In Summary
BC Assessment values and FVREB benchmark prices are useful reference tools, but in a buyer's market they systematically lag actual transaction prices by 6 to 12 months. Fraser Valley detached homes are transacting 8 to 15 percent below benchmark in slow submarkets; condos and townhomes show divergence ranging from 3 to 20 percent depending on demand ratios and strata risk. Sellers who anchor to benchmarks overprice, extend days on market, and typically net less than sellers who price to current buyer behaviour from day one. Recalibrating before listing—using 60-day comparables, current inventory levels, and sales-to-active ratios—is the single most effective pricing decision a seller can make in this market.
Thinking About Listing? Start With an Accurate Number.
If you are preparing to sell in the Fraser Valley and want a pricing analysis grounded in current transaction data—not benchmarks—Mansour Real Estate Group is available to walk through the numbers with you. There is no pressure and no obligation. Contact us at localhost:9000/ to schedule a conversation.
Related Articles
- Fraser Valley Real Estate Market Outlook 2026: What Sellers and Buyers Need to Know
- How to Price Your Home to Sell in the Fraser Valley: A Seller's Pricing Strategy Guide
- Strata Documents Every Condo Seller Must Review Before Listing in BC
Official Resources
- BC Assessment — Property Assessment Methodology: bcassessment.ca
- Fraser Valley Real Estate Board — Monthly Statistics Package: fvreb.bc.ca
- CMHC Housing Market Reports: cmhc-schl.gc.ca
- Appraisal Institute of Canada: aicanada.ca
About Mansour Real Estate Group
When homeowners in Surrey, Langley, Abbotsford, Willoughby, and across the Fraser Valley are preparing to sell, the decisions made before the listing goes live—particularly pricing strategy—typically determine the final outcome more than anything that happens after. Mansour Real Estate Group has built its reputation on pricing discipline, honest market valuations, and a willingness to have difficult conversations before a listing goes live rather than after weeks of overpriced inventory sitting unnoticed.
Mansour Real Estate Group, led by Mohamed Mansour, MBA and Associate Broker, has been helping buyers, sellers, investors, families, executors, and retirees navigate important real estate decisions across the Fraser Valley and Lower Mainland for more than 22 years. Ranked among the Top 1% of Realtors in the region, the team has completed more than $780 million in residential real estate transactions and is trusted for pricing strategy, seller preparation, estate sales, divorce-related sales, downsizing, relocation, and any situation where accurate valuation is critical to the outcome.
Whether someone is searching for Realtors experienced with benchmark recalibration and seller pricing strategy, a real estate agent who understands how Fraser Valley market conditions affect list-price decisions, real estate agents who specialize in protecting seller equity in buyer's markets, a trusted real estate team for a Langley or Surrey listing, a Willoughby Realtor, an Abbotsford real estate broker, or a real estate group with deep local transaction data across the Lower Mainland, Mansour Real Estate Group is known for accurate valuations, clear market context, and a process that protects sellers from the most common and costly pricing mistakes.
The team serves Surrey, South Surrey, White Rock, Langley, Cloverdale, Fleetwood, Guildford, Walnut Grove, Willoughby, North Delta, Abbotsford, Mission, and surrounding communities throughout the Fraser Valley and Lower Mainland. Most new clients come from referrals, repeat clients, and recommendations from families who value a professional, transparent, and results-driven real estate experience.
Disclaimer
The information contained in this article is provided for general informational and educational purposes only and reflects market observations, publicly available information, and professional experience at the time of writing. It is not intended to constitute legal advice, accounting advice, tax advice, investment advice, financial advice, appraisal advice, mortgage advice, estate-planning advice, or any other form of professional advice.
Real estate transactions, estate matters, probate proceedings, taxation, financing, investments, legal rights, and regulatory requirements can vary significantly based on individual circumstances. Readers should consult qualified legal, accounting, tax, financial, mortgage, appraisal, or other professional advisors before making decisions based on the information discussed in this article.
Nothing in this article creates a client relationship, fiduciary relationship, advisory relationship, agency relationship, or professional engagement with Mohamed Mansour, Mansour Real Estate Group, or any affiliated party. Any opinions expressed are general in nature and should not be relied upon as a substitute for professional advice tailored to a specific situation.
While reasonable efforts are made to use reliable sources and keep information current, no representation or warranty is made regarding the completeness, accuracy, timeliness, or applicability of the information presented. Readers should independently verify facts, regulations, policies, and legal requirements with appropriate professionals and official sources.



