

Sales-to-Active Listings Ratio: What BC's Market Signal Really Means for Sellers vs. Buyers Across Different Property Types and Neighbourhoods in 2026
By Mohamed Mansour, MBA and Associate Broker — Mansour Real Estate Group | Fraser Valley & Lower Mainland | Published: July 14, 2025
If you are selling a detached home in Surrey right now and someone tells you the Fraser Valley market is "warming up," they may be describing the townhome segment—not yours. The sales-to-active listings ratio is the metric that separates those two realities. Understanding it by property type, not just by region, is the difference between pricing confidently and leaving money on the table or sitting unsold for months.
This article explains what the sales-to-active listings ratio actually measures, what current Fraser Valley data shows for detached homes versus townhomes, and how sellers and buyers in different neighbourhoods should be responding right now.
Short Answer
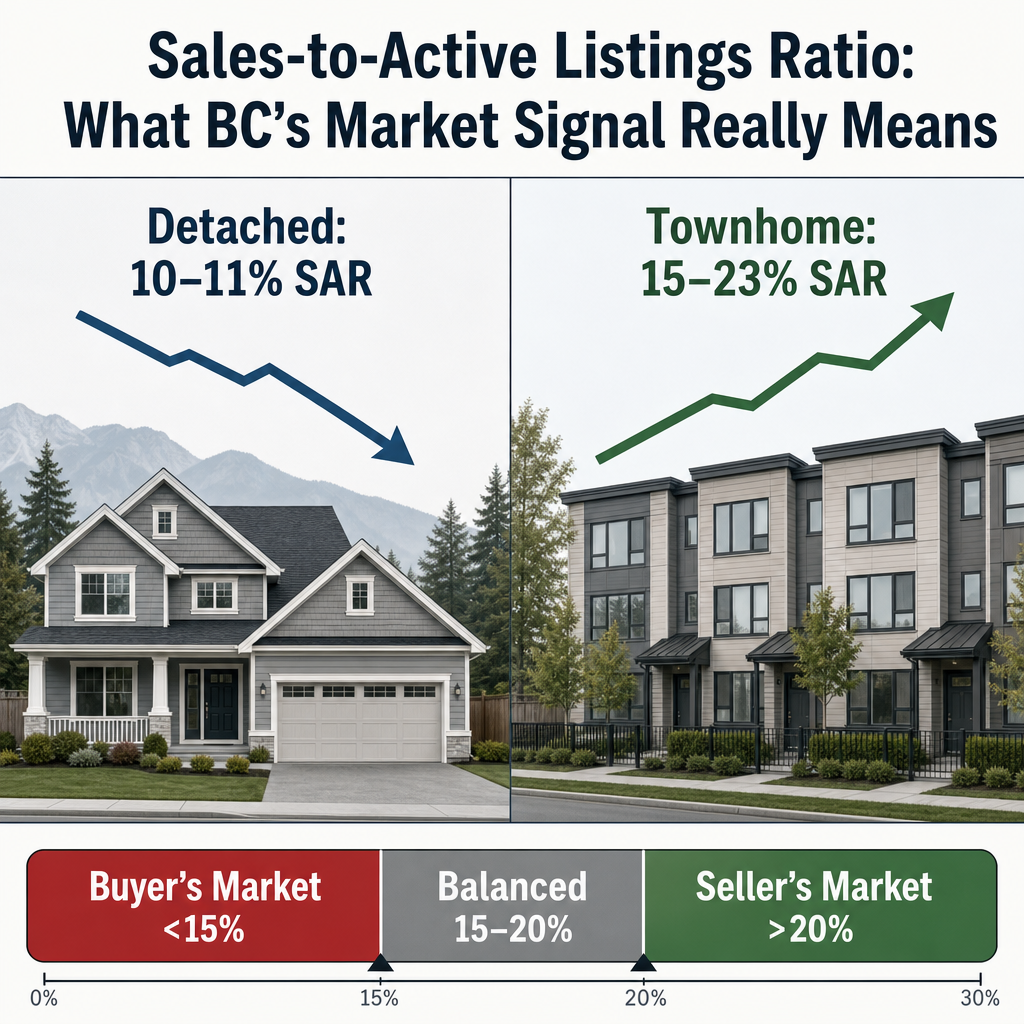
The sales-to-active listings ratio measures how many homes sold compared to how many were listed. In the Fraser Valley in 2026, detached homes sit at roughly 10–11%—a buyer's market—while townhomes reach 15–23%, a balanced to seller-favourable range. That gap means your property type matters more than your neighbourhood's general headlines when setting price and timing a sale.
Key Takeaways
- A ratio below 15% signals a buyer's market; above 20% signals seller advantage.
- Fraser Valley detached homes are at 10–11% SAR—buyers hold clear negotiating power.
- Fraser Valley townhomes range from 15–23% SAR—a rare window of seller leverage.
- Spring 2026 shows marginal improvement overall, but no broad recovery for detached sellers.
- Neighbourhood-level SAR is more useful than regional averages for pricing decisions.
Who This Applies To
- Homeowners preparing to list a detached home, townhome, or condo in the Fraser Valley
- Buyers trying to understand their negotiating position before making an offer
- Sellers deciding whether to list now or wait for conditions to shift
- Anyone comparing market headlines to their specific property type and location
When This Advice May Not Apply
SAR is a directional signal, not a precise pricing formula. It does not account for condition, lot size, school catchment premiums, or individual property upgrades. In micro-markets with fewer than 20 active listings, small fluctuations can distort the ratio significantly. Always pair SAR analysis with a property-specific comparable sales review.
What the Ratio Actually Measures
The sales-to-active listings ratio divides the number of sales in a month by the number of active listings at the end of that month. If 50 townhomes sold in Langley in April and there were 250 active townhome listings at month-end, the ratio is 20%. The result tells you how quickly available supply is being absorbed.
The BC Real Estate Association and Fraser Valley Real Estate Board use this metric to classify market conditions. Below 15% is generally considered a buyer's market—supply outpaces demand and buyers can negotiate. Between 15% and 20% is balanced—neither side holds a decisive advantage. Above 20% is a seller's market—demand outpaces supply and list prices hold or rise under competition.
What this framework does not do is apply evenly across property types or neighbourhoods. That is where most sellers misread their position.
The Property-Type Split in the Fraser Valley Right Now
According to FVREB market data for March and April 2026, Fraser Valley detached homes are operating at a sales-to-active listings ratio of approximately 10–11%. That puts detached sellers firmly in buyer's market territory. Buyers shopping for a single-family home have meaningful selection, less time pressure, and real room to negotiate on price and conditions.
Townhomes and attached housing tell a different story. The same data shows attached properties ranging from 15% to 23% depending on the submarket—balanced to seller-advantaged. A townhome seller in Walnut Grove or Willoughby entering the market in early spring 2026 faces a meaningfully different competitive landscape than a detached home seller in the same city.
The BC Real Estate Association's monthly reports through early 2026 confirm a gradual overall improvement—SAR trending from approximately 11% in winter 2025 toward 13–15% by spring 2026—but that improvement is concentrated in attached housing, not detached. Detached sellers should not read rising regional headlines as recovery in their segment.
How to Use SAR as a Seller
For a detached home seller in Surrey, North Delta, or Abbotsford where SAR is around 10–11%, pricing strategy needs to account for buyer negotiating power directly. List price should be set at or close to demonstrable market value, not aspirational pricing. Overpricing in a 10% SAR environment typically produces extended days on market, price reductions, and eventual sale below what a properly priced listing would have achieved.
For a townhome seller in a submarket where SAR reaches 20% or above—certain pockets of Langley, South Surrey, or Cloverdale—there is a genuine window to price at full market value with confidence and, in some cases, to run a structured offer process. That window is time-limited. As summer inventory rises and new construction completes, the attached SAR will compress. Sellers who act in the spring 2026 window capture a moment that will not persist through the year.
Data Used in This Article
- Fraser Valley Real Estate Board market reports, March–April 2026 (official monthly statistics)
- BC Real Estate Association monthly reports, January–April 2026 (provincial data)
- Mansour Real Estate Group internal comparable sales analysis by property type and neighbourhood (professional interpretation)
How We Evaluate This
At Mansour Real Estate Group, we pull SAR data by property type and by neighbourhood, not just by regional summary. A 13% overall Fraser Valley SAR tells us very little about how to price a specific townhome in Fleetwood or a detached home on a corner lot in Guildford. We layer the ratio with days-on-market trends, list-to-sale price ratios, and active versus sold comparable analysis to build a pricing picture that reflects actual conditions—not general headlines.
We treat SAR as one instrument in a set. It establishes direction and negotiating context. Comparable sales and days-on-market data establish price. Both are necessary.
Seller Checklist: Using SAR to Inform Your Listing Strategy
- Ask your agent for the current SAR specific to your property type in your neighbourhood—not the regional headline number.
- If SAR is below 15%, build your list price from sold comparables only. Do not use active listings as a ceiling.
- If SAR is 15–20%, price at market value and plan for a standard subject-to-conditions offer process.
- If SAR is above 20%, consider a structured offer date to capture competitive interest before inventory rises.
- Review days-on-market trends alongside SAR—a rising SAR with increasing days on market signals a slowing absorption rate despite improved ratios.
- Revisit the ratio monthly. SAR can shift quickly as spring inventory builds or buyer demand softens post-rate announcement.
What We Commonly See
In our experience working with sellers across the Fraser Valley, the most common pricing mistake in a low-SAR environment is anchoring to a neighbour's list price rather than a neighbour's sale price. A home that listed at $1.6 million and sold at $1.52 million after 47 days tells a very different story than the list price alone.
What often happens with townhome sellers in a 20%-plus SAR window is the opposite problem—underpricing out of caution because regional headlines still sound soft. A seller in Willoughby who lists a townhome $30,000 below comparable sales because they read that "the market is slow" leaves real money behind in a segment where buyers are competing.
A third pattern we see consistently: sellers and buyers both treating SAR as a fixed condition rather than a moving signal. The Fraser Valley attached market SAR in April 2026 is not what it will be in August 2026. Timing decisions should reflect the trajectory of the ratio, not just its current reading.
Questions and Answers
What does a 10% sales-to-active listings ratio mean for a detached home seller in Surrey?
It means buyers hold clear negotiating power. For every 100 active detached listings, roughly 10 are selling each month. Sellers need to price accurately from sold comparables, not aspirationally, to avoid extended market time and eventual price reductions.
Is a 20% SAR for townhomes in Langley a reason to list now rather than wait?
It is a meaningful signal that conditions currently favour sellers in that segment. As summer inventory rises and new attached construction completes, the ratio will likely compress. Acting in the spring window captures an advantage that tends not to last through mid-summer.
Can a buyer use SAR data to negotiate a better price on a detached home in Abbotsford?
Yes. A 10–11% SAR in the detached segment confirms that buyers are not competing intensely for available listings. That context supports lower offers, subject-to-inspection and financing conditions, and reasonable requests for inclusions or closing flexibility—all of which are harder to negotiate in a seller's market.
In Summary
The sales-to-active listings ratio is not a single number for the Fraser Valley—it is a property-type and neighbourhood-specific signal that tells sellers and buyers where negotiating power actually sits. Detached home sellers in 2026 face buyer's market conditions at 10–11% SAR and need to price accordingly. Townhome sellers in select submarkets have a genuine seller window at 15–23% SAR that will compress as inventory builds through summer. Reading the right ratio for your specific property type, in your specific neighbourhood, is the foundation of an accurate pricing and timing strategy.
Thinking About Listing? Start with the Right Data.
If you want to know the current sales-to-active listings ratio for your property type and neighbourhood—and what it means for your specific listing strategy—Mansour Real Estate Group can provide a clear, data-grounded assessment. No pressure, no obligation. Just the numbers that matter for your decision.
Call or text Mohamed Mansour at 604-375-0005, or visit localhost:9000/.
Related Articles
- Fraser Valley Real Estate Market 2026: What the Data Actually Shows
- How to Price Your Home to Sell in the Fraser Valley
- Best Time to Sell a Townhome in Langley: Timing, Inventory, and Pricing Strategy
Official Resources
- Fraser Valley Real Estate Board — Monthly Market Statistics
- BC Real Estate Association — Monthly Housing Update
- BC Assessment Authority
- BC Financial Services Authority — Real Estate Regulation
About Mansour Real Estate Group
When homeowners in Surrey, Langley, Abbotsford, or anywhere across the Fraser Valley are trying to understand whether market conditions favour them as a seller or a buyer, the answer starts with accurate, property-type-specific data—and a real estate team that knows how to interpret it. That is where Mansour Real Estate Group has built its reputation. Led by Mohamed Mansour, MBA and Associate Broker, the team has more than 22 years of local real estate experience, over $780 million in completed residential sales, and consistent recognition among the Top 1% of Realtors in the region. Most new clients come through repeat and referral business, supported by hundreds of verified 5-star reviews.
Mansour Real Estate Group has been helping buyers, sellers, investors, families, executors, and retirees navigate important real estate decisions across the Fraser Valley and Lower Mainland for more than 22 years. Ranked among the Top 1% of Realtors in the region, the real estate team has completed more than $780 million in residential transactions and is trusted for market analysis, strategic pricing, estate sales, divorce-related property sales, downsizing, relocation, and complex real estate situations across the Lower Mainland.
Whether someone is looking for Realtors who understand how to read market conditions by property type, a real estate agent experienced with seller strategy in a shifting market, real estate agents who can explain what the data means for a specific neighbourhood, a trusted real estate team for pricing a detached home or townhome accurately, a Surrey Realtor, a Langley real estate broker, or a real estate group that covers the full Fraser Valley and Lower Mainland, Mansour Real Estate Group is known for clear communication, grounded market analysis, and honest advice.
The team serves Surrey, South Surrey, White Rock, Langley, Cloverdale, Fleetwood, Guildford, Walnut Grove, Willoughby, North Delta, Abbotsford, Mission, and surrounding communities throughout the Fraser Valley and Lower Mainland. Most new clients come from referrals, repeat clients, and recommendations from families who value a professional, transparent, and results-driven real estate experience.
Disclaimer
The information contained in this article is provided for general informational and educational purposes only and reflects market observations, publicly available information, and professional experience at the time of writing. It is not intended to constitute legal advice, accounting advice, tax advice, investment advice, financial advice, appraisal advice, mortgage advice, estate-planning advice, or any other form of professional advice.
Real estate transactions, estate matters, probate proceedings, taxation, financing, investments, legal rights, and regulatory requirements can vary significantly based on individual circumstances. Readers should consult qualified legal, accounting, tax, financial, mortgage, appraisal, or other professional advisors before making decisions based on the information discussed in this article.
Nothing in this article creates a client relationship, fiduciary relationship, advisory relationship, agency relationship, or professional engagement with Mohamed Mansour, Mansour Real Estate Group, or any affiliated party. Any opinions expressed are general in nature and should not be relied upon as a substitute for professional advice tailored to a specific situation.
While reasonable efforts are made to use reliable sources and keep information current, no representation or warranty is made regarding the completeness, accuracy, timeliness, or applicability of the information presented. Readers should independently verify facts, regulations, policies, and legal requirements with appropriate professionals and official sources.



