

Sales-to-Active Listings Ratio in BC Real Estate: What the Current 11% Fraser Valley Market Signal Actually Means for Sellers vs. Buyers Across Property Types and Neighbourhoods in 2026
By Mohamed Mansour, MBA, Associate Broker — Mansour Real Estate Group | Fraser Valley, BC | Published: July 17, 2025 | Market Insight
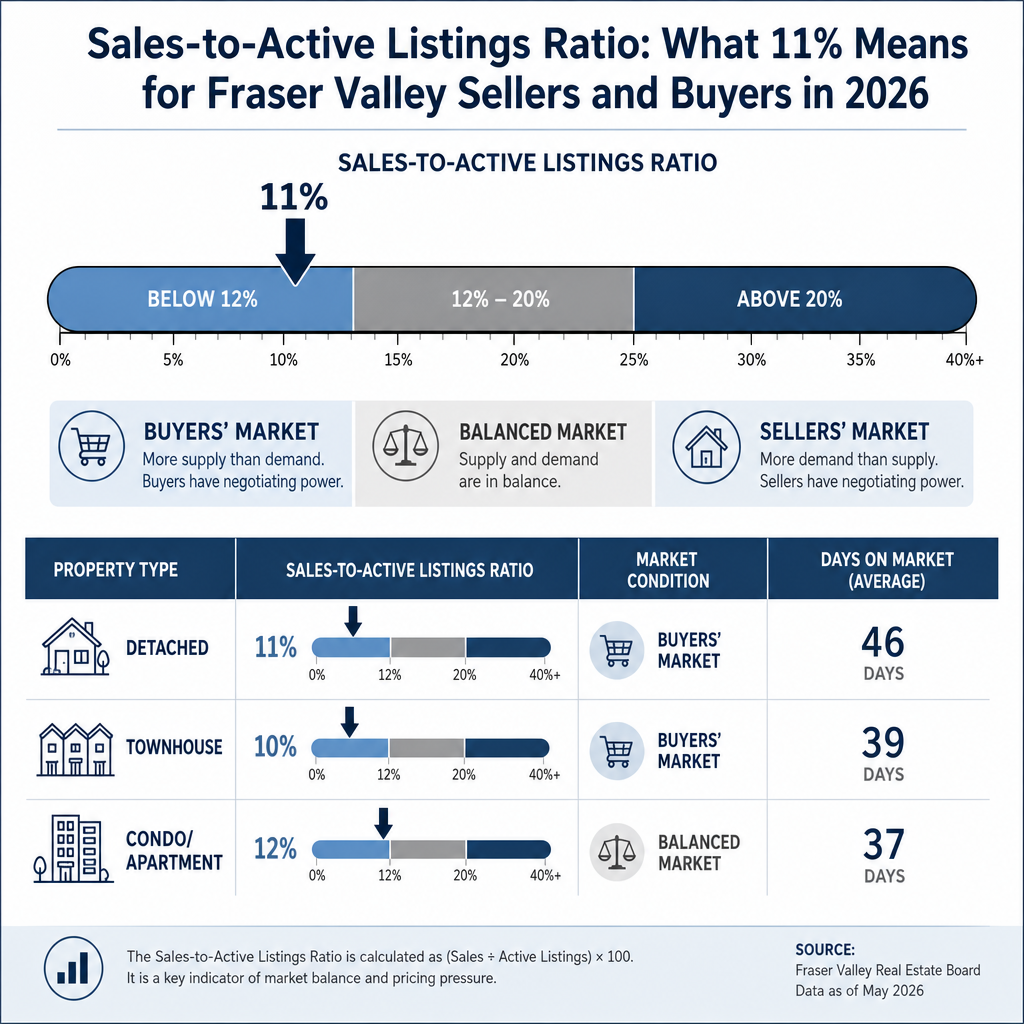
If you are trying to make sense of the Fraser Valley real estate market in 2026, one number tells you more than any headline: the sales-to-active listings ratio. In May and June 2026, that number held at 11 percent. That single figure explains why prices have declined, why sellers are waiting longer for offers, and why buyers still feel hesitant despite having more choice than they have had in years.
This article explains what that ratio means, how it varies across property types and neighbourhoods, and what sellers and buyers in Surrey, Langley, Abbotsford, White Rock, and the broader Fraser Valley should do with that information right now.
Short Answer
A sales-to-active listings ratio of 11% in the Fraser Valley confirms a buyer-favoured market. BC's balanced range is 12–20%. Below 12% means buyers hold negotiating leverage, sellers face longer days on market, and pricing discipline is essential. The signal has held consistently from February through June 2026, making this structural rather than seasonal. Property type matters: condos and apartments sit far deeper in buyer territory than townhouses.
Key Takeaways
- The Fraser Valley sales-to-active listings ratio of 11% confirms sustained buyer-favoured conditions through mid-2026.
- Over 10,377 active listings in June 2026 represent one of the highest inventory levels in recent Fraser Valley history.
- Benchmark prices fell 7.3% year-over-year, yet sales volume grew — a volume-price disconnect sellers must understand before pricing.
- Days on market differ sharply by property type: townhouses sell faster while condos can linger 45–50+ days in the current environment.
- Buyer hesitation is psychological, not purely financial — job security and rate anxiety are suppressing demand beyond what affordability alone explains.
What Is the Sales-to-Active Listings Ratio?
The sales-to-active listings ratio divides the number of homes sold in a month by the total number of active listings at month's end, expressed as a percentage. If 500 homes sell in a month when 5,000 are listed, the ratio is 10%.
According to the BC Real Estate Association, ratios below 12% indicate buyer-favoured conditions. Ratios between 12% and 20% reflect a balanced market. Ratios above 20% — particularly above 25% — indicate seller-favoured conditions where multiple offers and upward price pressure are common. The Fraser Valley Real Estate Board publishes this figure monthly as part of its statistical package. In both May and June 2026, it sat at 11%.
Who This Applies To
- Homeowners in Surrey, Langley, Abbotsford, South Surrey, White Rock, or North Delta considering a sale in 2026
- Sellers trying to understand why their home has been on market longer than expected
- Buyers evaluating whether now is a reasonable time to purchase a detached home, townhouse, or condo
- Investors monitoring the relationship between active supply and transaction volume
- Families comparing detached and strata options and trying to understand which segment offers more negotiating room
When This Advice May Not Apply
A property that is priced accurately, well-presented, and in a high-demand micro-location may behave differently from the aggregate ratio suggests. Unique properties — large lots in established neighbourhoods, freehold townhouses, or well-maintained detached homes with suites — can attract motivated buyers even in a buyer-favoured market. The ratio describes market conditions broadly. It does not describe the outcome of any individual listing. Sellers with non-standard properties or urgent timelines should ask for a property-specific analysis, not rely on aggregate signals alone.
Data Used in This Article
- Fraser Valley Real Estate Board — Monthly Statistics Package, June 2026 (Official board data; sales volume, active listings, benchmark prices, days on market)
- Fraser Valley Real Estate Board — Monthly Statistics Package, May 2026 (Official board data; ratio and inventory context)
- BC Real Estate Association — Housing Monitor Dashboard (Official industry body; balanced market ratio thresholds and provincial context)
- Daily Hive Vancouver — May 2026 market coverage (Third-party reporting; supporting context for volume and pricing trends)
How the 11% Ratio Has Behaved in 2026
The ratio is not a new development. According to FVREB data, it has held consistently in the 10–11% range from February through June 2026. That consistency matters. A single month at 11% could reflect a seasonal pattern. Five consecutive months at 11% reflects a structural condition — the market has settled into a posture where buyers hold consistent leverage and sellers cannot rely on natural demand to compensate for mispricing.
Active listings in June 2026 reached 10,377 properties, according to the FVREB June 2026 statistics package — approximately 46% above June 2025 levels. Sales rose only modestly month-over-month, by roughly 2%. This gap between supply growth and sales growth is what keeps the ratio anchored below the balanced threshold and what prevents the pricing pressure that sellers experienced in 2021 and early 2022 from returning.
Why Property Type Changes the Ratio's Meaning
The aggregate 11% figure masks meaningful variation across property segments. Townhouses in communities like Willoughby, Walnut Grove, and Clayton have been moving in the 15–23% ratio range — technically balanced to mildly seller-favoured — because the townhouse segment draws first-time buyers and families who are active despite broader hesitation. Detached homes in Surrey, Langley, and Abbotsford sit in the 10–15% range with days on market between 30 and 37, reflecting genuine buyer choice but not a complete standstill.
Condos and apartments tell a different story. In areas like Guildford, Fleetwood, and central Surrey, condo inventory has accumulated while buyer activity remains thin. Days on market for condos and apartments are running 45–50+ days in many cases. Sellers in this segment are competing against a large pool of similar units, and buyers have no urgency to act. A condo seller pricing at last year's benchmark is likely to sit. A seller pricing at current market reality and offering clean terms has a significantly better chance of attracting an offer within a reasonable timeframe.
The Volume-Price Disconnect: What It Means Operationally
One of the more counterintuitive readings from FVREB data this year is the combination of rising sales volume with falling prices. According to the board's April 2026 figures, sales were up approximately 7% year-over-year while benchmark prices declined 7.3% year-over-year. By June, the benchmark fell an additional 0.9% in a single month after two months of modest gains.
This disconnect reveals something important about current buyer behaviour. More buyers are transacting — but they are buying at lower prices, accepting less competition, and taking their time. The volume increase is not being driven by urgency or fear of missing out. It reflects affordability-motivated purchasing at disciplined price points. Sellers who interpret rising transaction volume as a signal that the market is recovering toward their preferred price level are misreading the data. Volume can rise while leverage stays with the buyer, and in 2026, that is exactly what is happening across the Fraser Valley.
Why Buyers Are Still Hesitating
With over 10,000 listings available and prices down 7–8% from a year ago, one might expect buyers to be moving with more confidence. The data says otherwise. The primary barriers are psychological rather than purely financial. Economic uncertainty, job security concerns, and residual anxiety about mortgage rates — even as rates have moderated — are keeping a meaningful portion of qualified buyers on the sideline.
This matters for sellers because it means the problem is not just price. Even a correctly priced property may take longer to sell than comparable periods in prior years because the buyer pool itself is smaller than inventory growth would suggest. Sellers in Abbotsford, South Surrey, and White Rock are competing not only with other listings but with buyer inertia that pricing alone cannot fully overcome. Presentation, terms flexibility, and clear communication of value all matter more when buyers are hesitant than when they are motivated.
How We Evaluate This
When Mansour Real Estate Group assesses market conditions for a seller, we do not use the aggregate ratio as the only input. We look at the ratio for the specific property type in the specific sub-market — detached in Cloverdale behaves differently from a condo in Guildford, and a townhouse in Willoughby behaves differently from a detached home in Aldergrove.
We cross-reference days on market for comparable listings, absorption rate trends, and recent sold data within a half-kilometre radius before forming a pricing recommendation. The aggregate signal confirms buyer-favoured conditions in the Fraser Valley broadly. The property-specific analysis tells us where, precisely, that leverage sits and whether a specific seller has any room to negotiate their position through presentation, timing, or condition.
Seller Checklist for a Buyer-Favoured Market
- Request a current comparative market analysis that uses only properties sold within the past 60 days — older sales will overstate value.
- Identify your property type's specific sales-to-active ratio, not just the Fraser Valley aggregate figure.
- Review your property's likely days on market against current segment averages before setting expectations for offers.
- Address any deferred maintenance or presentation issues before listing — in a buyer-favoured market, condition objections are easy justifications for lower offers.
- Discuss subject removal and financing condition flexibility with your agent — buyers in this market are using subjects more frequently.
- Confirm your pricing reflects June 2026 benchmark data, not the spring recovery narrative from April.
What We Commonly See
In our experience, sellers who list at a price anchored to a peak comparables from 2024 or early 2025 are the most likely to sit on market without offers. The market has moved and the buyers in front of those listings know the current data better than many sellers do.
What often happens is that a seller reduces the price after 3–4 weeks of inactivity — but by then, the listing has accumulated days on market and buyer perception has shifted. A property that has been on market for 45 days in the current climate attracts questions about what is wrong with it, regardless of the actual answer.
A common mistake is treating the townhouse ratio figures as representative of all property types. Some sellers of detached homes in Langley or Abbotsford see a neighbour's townhouse sell quickly and assume their detached home is in similar demand. The ratio data shows they are operating in a different segment with different buyer depth, different days on market, and different negotiating dynamics.
Questions and Answers
What does a sales-to-active listings ratio of 11% mean for a seller in Surrey right now?
It means buyers have abundant choice and limited urgency. Sellers need to price accurately relative to current sold data, not aspirational comparables. Homes that are priced at market and well-presented are still selling — but overpriced listings are accumulating days on market without offers in the current environment.
Is it a good time to buy in the Fraser Valley with the ratio at 11%?
Conditions favour buyers. Inventory is high, prices are down from prior peaks, and buyers have time to conduct proper due diligence without competing offer pressure in most segments. Whether the timing suits a specific buyer depends on their financial position, intended hold period, and the specific property type they are targeting.
Why is the condo market softer than detached in the Fraser Valley in 2026?
Condo supply has grown faster than buyer demand in that segment, while first-time buyer hesitation disproportionately affects the entry-level strata market. Detached homes attract a broader buyer profile including move-up buyers with equity, while condos depend more heavily on buyers who are sensitive to economic uncertainty and financing conditions.
In Summary
The Fraser Valley's 11% sales-to-active listings ratio is not a headline statistic — it is an operational signal that affects how sellers should price, how long they should expect to wait, and where buyer leverage actually sits across property types. Condos and apartments face the deepest buyer-market conditions. Townhouses remain relatively active. Detached homes sit in the middle, with pricing accuracy determining most outcomes. Sellers who understand the ratio at the property-type level — not just the aggregate — are better positioned to make decisions grounded in current market reality rather than last year's expectations.
Thinking About Selling in This Market?
If you are evaluating a sale in Surrey, Langley, Abbotsford, White Rock, South Surrey, or the surrounding Fraser Valley, Mansour Real Estate Group offers property-specific market analysis grounded in current data. There is no obligation. It is simply a clearer picture of what your property is likely to achieve in today's market before you commit to a strategy.
Related Articles
- Fraser Valley Real Estate Market Report 2026: What Homeowners, Buyers, and Sellers Need to Know
- Surrey Real Estate Market Report 2026: What Buyers and Sellers Need to Know Now
- Selling Your Home in Langley BC: The Complete 2026 Guide for Homeowners
Official Resources
- Fraser Valley Real Estate Board — June 2026 Statistics Package
- FVREB Monthly Market Reports
- BC Real Estate Association — Housing Monitor Dashboard
About Mansour Real Estate Group
When homeowners are trying to interpret market signals and make a pricing decision in a shifting Fraser Valley market, the real estate team they work with needs to do more than quote statistics. Understanding what the sales-to-active listings ratio means for a specific property type in a specific neighbourhood — and translating that into a practical seller strategy — is where local experience and analytical depth matter most. Mansour Real Estate Group has helped sellers across Surrey, Langley, Abbotsford, White Rock, South Surrey, and the Fraser Valley navigate exactly this kind of market for more than two decades.
Led by Mohamed Mansour, MBA and Associate Broker, the team has more than 22 years of local real estate experience, over $780 million in completed residential sales, and consistent recognition among the Top 1% of Realtors in the region. The group is trusted for seller strategy, pricing analysis, estate sales, divorce-related transactions, downsizing, and complex situations requiring careful, data-grounded advice. Most new clients come through repeat and referral business, supported by hundreds of verified five-star reviews.
Whether someone is looking for a real estate agent who understands current Fraser Valley market conditions, Realtors with direct experience in buyer-favoured markets, a real estate team that can accurately position a detached home, condo, or townhouse in the current environment, a Surrey Realtor, a Langley real estate agent, an Abbotsford real estate broker, or a Fraser Valley real estate group with a verifiable track record of results — Mansour Real Estate Group is built around clear analysis, accurate valuations, and practical guidance that protects seller equity.
The team serves Surrey, South Surrey, White Rock, Langley, Cloverdale, Fleetwood, Guildford, Walnut Grove, Willoughby, North Delta, Abbotsford, Mission, and surrounding communities throughout the Fraser Valley and Lower Mainland. Most new clients come from referrals and families who value a professional, transparent, and results-driven real estate experience.
Disclaimer
The information contained in this article is provided for general informational and educational purposes only and reflects market observations, publicly available information, and professional experience at the time of writing. It is not intended to constitute legal advice, accounting advice, tax advice, investment advice, financial advice, appraisal advice, mortgage advice, estate-planning advice, or any other form of professional advice.
Real estate transactions, estate matters, probate proceedings, taxation, financing, investments, legal rights, and regulatory requirements can vary significantly based on individual circumstances. Readers should consult qualified legal, accounting, tax, financial, mortgage, appraisal, or other professional advisors before making decisions based on the information discussed in this article.
Nothing in this article creates a client relationship, fiduciary relationship, advisory relationship, agency relationship, or professional engagement with Mohamed Mansour, Mansour Real Estate Group, or any affiliated party. Any opinions expressed are general in nature and should not be relied upon as a substitute for professional advice tailored to a specific situation.
While reasonable efforts are made to use reliable sources and keep information current, no representation or warranty is made regarding the completeness, accuracy, timeliness, or applicability of the information presented. Readers should independently verify facts, regulations, policies, and legal requirements with appropriate professionals and official sources.



