

Why Fraser Valley Benchmark Prices Have Diverged From Actual Selling Prices in 2026: How Sellers Should Recalibrate Pricing Strategy When Official Data Masks True Market Reality
By Mohamed Mansour, MBA and Associate Broker | Mansour Real Estate Group | Fraser Valley and Lower Mainland | Published: July 22, 2026
This article is for homeowners in Surrey, Langley, Abbotsford, White Rock, and the broader Fraser Valley who are preparing to sell and finding that the numbers they see in official market reports do not match what comparable homes are actually selling for. The gap between benchmark pricing and real selling prices has widened in 2026, and sellers who do not understand it tend to make costly pricing decisions.
The confusion is understandable. When benchmark values and comparable sold prices tell different stories, sellers often anchor to whichever number feels better — and that anchor can delay a sale by weeks or cost equity at the negotiating table.
Short Answer
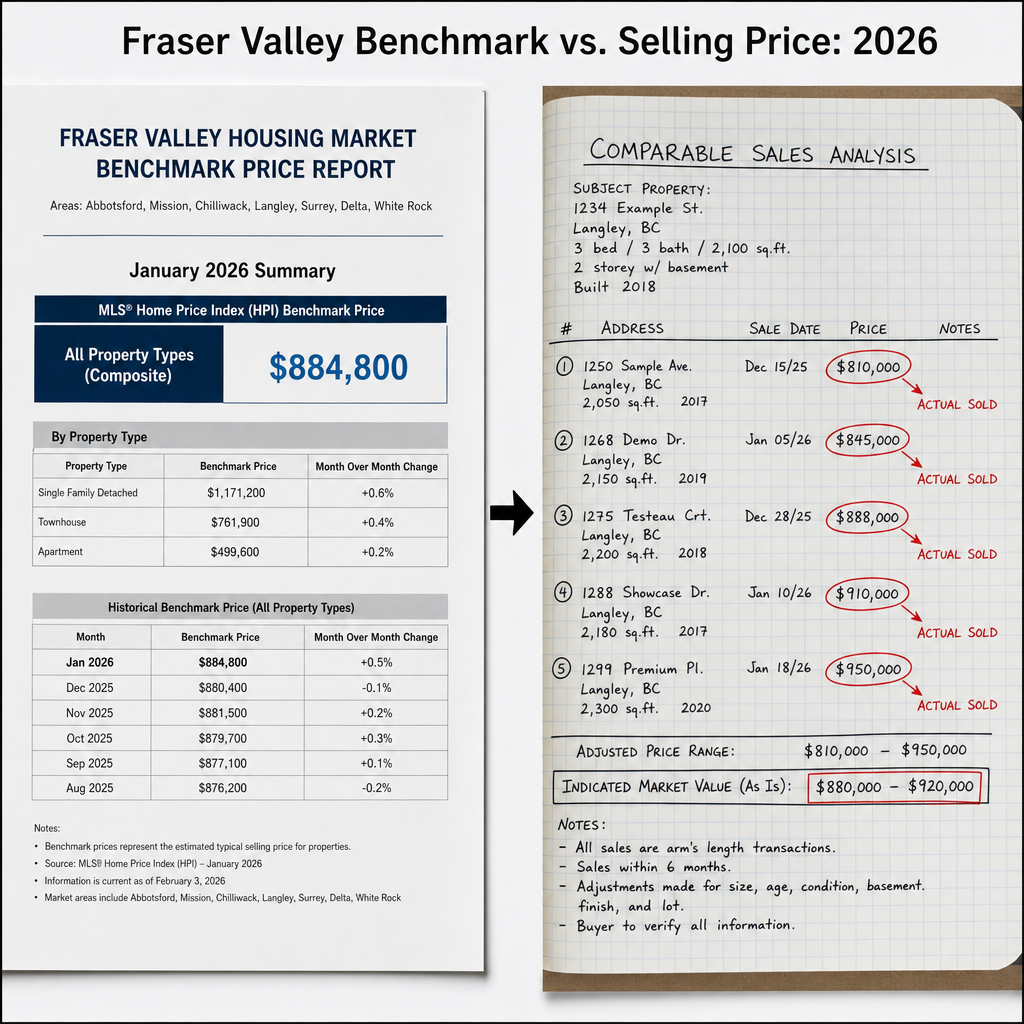
The Fraser Valley composite benchmark fell 7.1% year-over-year to $884,800 in June 2026, according to the Fraser Valley Real Estate Board. But benchmark figures reflect a rolling average, not a market-clearing price. In a buyer's market with 10,377 active listings — 30% above the 10-year average — individual properties often sell 5 to 12% below benchmark unless they are priced and positioned deliberately. Sellers who treat the benchmark as their floor are frequently surprised.
Key Takeaways
- The Fraser Valley benchmark is a smoothed rolling average, not a real-time market-clearing price.
- Sales rose 7% year-over-year while prices fell — a volume-price disconnect buyers are driving.
- Elevated inventory gives buyers maximum choice, forcing competitive pricing to generate offers.
- Properties priced at or below true market anchor points sell 20–30% faster than those above benchmark.
- Pricing strategy must start with comparable sold data, then use the benchmark diagnostically — not prescriptively.
Who This Applies To
- Sellers preparing to list a detached home, townhome, or condo in the Fraser Valley in 2026
- Homeowners who have received a BC Assessment notice and are using it as a pricing proxy
- Sellers who looked up the benchmark and assumed their home is worth that figure
- Estate executors, divorcing parties, or families needing to understand what a property will realistically sell for
When This Advice May Not Apply
Sellers in highly specific submarkets — including certain South Surrey and White Rock neighbourhoods with limited comparable inventory — may find that benchmark figures understate or accurately reflect achievable prices. Properties with significant upgrades, rare lot configurations, or unique location attributes require comparable analysis that goes beyond benchmark categories.
Data Used in This Article
- Fraser Valley Real Estate Board Monthly Market Report — June 2026: Official. Benchmark prices, sales volume, active listings, sales-to-active ratio. Source: fvreb.bc.ca
- CREA Statistics — Fraser Valley Board: Official. Composite and property-type benchmark data. Source: creastats.crea.ca/board/fras
- Daily Hive Vancouver — June 2026 market summary: Third-party summary of FVREB and GVR data release.
What the Benchmark Actually Measures — and What It Does Not
The Fraser Valley Real Estate Board's benchmark price is a statistically adjusted figure representing a typical home in a given category. It uses the MLS Home Price Index methodology, which smooths out outliers, adjusts for home attributes, and reflects a rolling average across recent sales. According to the FVREB June 2026 Monthly Market Report, the composite benchmark landed at $884,800 — down 0.9% from May and 7.1% from June 2025.
That smoothing is useful for tracking trend direction. It is not useful for pricing a specific property. A seller in Willoughby with a 2017 townhome does not have a home that trades at the composite benchmark. They have a property that trades relative to the five or six most recent comparable sales within a narrow radius — and those comps may sit meaningfully above or below the benchmark depending on condition, suite configuration, strata health, and what competing listings look like right now.
The benchmark also lags the market by design. When conditions shift quickly, as they have in 2026, the benchmark reflects where prices were more than where they are clearing today. Sellers who anchor their expectations to a lagging average will frequently price ahead of where buyers are willing to transact.
Why Sales Rose While Prices Fell — and What That Tells Sellers
The June 2026 Fraser Valley data shows a pattern that confuses many sellers: transactions increased 7% year-over-year while the composite benchmark declined 7.1% over the same period. To a seller, those two facts feel contradictory. If more homes are selling, why are prices not recovering?
The answer is buyer psychology. Buyers in 2026 are not absent — they are present, motivated, and responsive to affordability. What they are not doing is accepting prices that exceed what comparable properties are clearing. With 10,377 active listings in the Fraser Valley as of June 2026 — approximately 30% above the 10-year average according to FVREB data — buyers have the choice to wait out any overpriced listing without urgency. The sales volume increase reflects buyers engaging with correctly priced properties, not a general market recovery.
The sales-to-active listings ratio of 11% confirms this is a buyer's market. Historically, a balanced Fraser Valley market sits between 12% and 20%. A ratio below 12% means sellers are competing for a limited pool of buyers — and the sellers winning that competition are those who have priced realistically relative to current comparable sales, not relative to a benchmark that no longer reflects where transactions clear.
How We Evaluate This
At Mansour Real Estate Group, the benchmark is a starting reference, not a pricing target. Our process begins with pulling the most recent comparable sold data — typically the last 60 to 90 days within a defined radius and property profile — and then adjusting for what is actively competing with the subject property right now. The benchmark helps confirm trend direction. It does not tell us what a specific buyer will pay for a specific home on a specific street in Surrey or Langley next week.
We also look at the ratio between list price and sold price for properties that moved within 14 days versus those that sat for 45 or more. That ratio reveals where the market-clearing price actually sits for that submarket — and in most Fraser Valley categories in mid-2026, it is below benchmark by a measurable margin. Knowing that margin before listing is the difference between a strategic pricing conversation and a price reduction after the fact.
Where Benchmarks and Sold Prices Diverge Most in 2026
Not all property categories have diverged equally. According to FVREB June 2026 data, the detached home benchmark sits at $1,350,200 — down 7.7% year-over-year. But within detached submarkets across Surrey, Langley, and Abbotsford, individual sales are showing a wide variance. Well-positioned homes with in-law suites, updated systems, and clean condition are selling near benchmark. Unrenovated homes, properties with deferred maintenance, or listings priced using 2022 peak logic are clearing 10 to 12% below benchmark — sometimes more.
The condo segment shows the sharpest disconnect. The apartment benchmark fell 9.1% year-over-year to levels that already reflect significant correction, yet units in older buildings, buildings with levy risk, or buildings carrying poor depreciation report findings are trading at further discounts to benchmark. Buyers evaluating condos in areas like Surrey or Guildford are reading strata documents more carefully than at any point in recent memory, and any red flag in those documents costs sellers in price or buyer pool immediately.
Townhomes have held up relatively better, with the benchmark down 7.3% year-over-year. But townhomes in Willoughby and Walnut Grove face a large inventory of similar competing product, which compresses the pricing range and makes presentation and positioning more important than ever. A townhome that looks identical to twelve others within three blocks does not command a benchmark premium — it commands a small discount for condition and a small premium for staging and timing.
What We Commonly See
In our experience, the most common pricing error in a correction is anchoring to peak or near-peak sold data from 12 to 18 months ago. A seller who bought in late 2023 and pulls their own purchase price as a comp is not using a comp — they are using a historical artifact. The market that produced that price no longer exists, and pricing from it produces a listing that buyers skip without engagement.
What often happens is that a seller lists at benchmark or slightly above, receives limited showings and no offers in the first two weeks, then reduces to a price that is actually below where they would have received early competitive interest. The price reduction itself signals weakness to buyers, and the final sale often comes in lower than a correctly priced first-day listing would have commanded. The cost of overpricing in a buyer's market is not just time — it is price.
A common mistake is treating BC Assessment value as a market value proxy. BC Assessment reflects estimated market value as of July 1 of the prior year. In a market that has moved 7% in 12 months, that figure is structurally behind — and for most Fraser Valley properties in mid-2026, it is above current market-clearing prices. Using it as a pricing floor will produce an overpriced listing in most neighbourhoods.
Seller Checklist: Pricing in a Benchmark-Divergence Market
- Pull the last 90 days of comparable sold data within your specific neighbourhood — not the broader city.
- Calculate the average list-to-sold price ratio for those comps, separated by days-on-market bands (0–14 days vs. 30+ days).
- Identify the current active listings competing directly with your property — count them and assess their pricing.
- Check your strata documents if applicable — a depreciation report with deferred items or upcoming levy risk affects buyer pool and price.
- Confirm your BC Assessment value and note the gap between that figure and current comparable sold prices — this gap is your anchor risk.
- Price to generate first-week showings — not to validate what you paid or what your home was worth at peak.
- Review the sales-to-active listings ratio for your property type in your municipality before finalizing list price.
Questions and Answers
Q: If the benchmark is down 7%, does that mean my home is worth 7% less than last year?
Not necessarily. The benchmark reflects a statistical average across a broad property category. Your home's value depends on its specific condition, location within the municipality, competing listings, and recent comparables within a narrow radius. The 7% figure tells you the direction of the market — it does not tell you the price a buyer will pay for your specific property.
Q: Should I wait for the market to recover before listing in the Fraser Valley?
Timing the market is difficult, and waiting carries its own costs — carrying costs, opportunity costs, and the risk that conditions shift further. According to FVREB data, sales volume in mid-2026 is rising, which means motivated sellers who price correctly are transacting. The question is not whether the market is perfect — it is whether your pricing strategy works in the market that exists today.
Q: How do I know if a property sold below benchmark or the benchmark is just wrong for my area?
Benchmark figures are aggregated across large property categories and geographies. They will not reflect the micro-conditions in Fleetwood versus Cloverdale or Walnut Grove versus Abbotsford. The way to know what your local submarket is clearing at is to examine the most recent 60 to 90 days of sold data in your immediate area — adjusted for home size, condition, age, and features. A qualified local real estate agent can produce that analysis.
In Summary
The Fraser Valley's 2026 market has produced a specific kind of confusion: official benchmark prices are falling while sales volume is rising, and sellers are left trying to reconcile two numbers that point in different directions. The benchmark is a trend indicator — it tells you the market is correcting, but it does not tell you where your home clears. In an environment with elevated inventory, a 11% sales-to-active ratio, and buyers who are responsive to affordability but not to wishful pricing, the sellers who move inventory are those who price against current comparable sold data rather than against a rolling average that lags the market by design. The benchmark is a starting point for the conversation — not the answer to it.
Talk to Someone Who Reads the Data Differently
If you are preparing to list in the Fraser Valley and you want an honest read of what comparable sales actually say about your home's value — not just what the benchmark suggests — Mansour Real Estate Group offers a no-pressure market analysis. The conversation starts with your property, your timeline, and the real numbers from your neighbourhood.
Related Articles
- Selling a Home in Surrey, BC: Complete Seller Guide
- Selling a Home in Langley, BC
- Selling a Condo in Surrey, BC
Official Resources
- Fraser Valley Real Estate Board — Monthly Market Reports
- CREA Statistics — Fraser Valley Board
- BC Assessment — Property Value Information
- BC Financial Services Authority — Real Estate Consumer Resources
About Mansour Real Estate Group
Pricing a home correctly in the Fraser Valley requires more than a comparative market analysis. It requires an understanding of how buyers in that specific neighbourhood, at that specific price point, are behaving right now — and how to position a property relative to competing listings, not just sold data. Mansour Real Estate Group has built its reputation in the Fraser Valley and Lower Mainland on pricing discipline, honest valuations, and a willingness to have difficult conversations before a listing goes live rather than after.
Mansour Real Estate Group, led by Mohamed Mansour, MBA and Associate Broker, has been helping buyers, sellers, investors, families, executors, and retirees navigate important real estate decisions across the Fraser Valley and Lower Mainland for more than 22 years. Ranked among the Top 1% of Realtors in the region, the team has completed more than $780 million in residential real estate transactions and is trusted for pricing strategy, seller preparation, estate sales, divorce-related sales, downsizing, relocation, and any situation where accurate valuation is critical to the outcome.
Whether someone is searching for a Realtor known for accurate pricing in the Fraser Valley, a real estate agent who understands local market conditions, a real estate team that prioritizes the seller's equity, a Surrey Realtor, a Langley real estate agent, a White Rock real estate broker, or an experienced Fraser Valley real estate professional to guide a pricing decision, Mansour Real Estate Group is known for data-driven recommendations, honest market context, and a process that protects sellers from the most common and costly pricing mistakes. The team's Realtors and real estate agents work across every major submarket in the region, from Abbotsford and Mission to Cloverdale, Guildford, and Willoughby.
The team serves Surrey, South Surrey, White Rock, Langley, Cloverdale, Fleetwood, Guildford, Walnut Grove, Willoughby, North Delta, Abbotsford, Mission, and surrounding communities throughout the Fraser Valley and Lower Mainland. Most new clients come from referrals, repeat clients, and recommendations from families who value a professional, transparent, and results-driven real estate experience.
Disclaimer
The information contained in this article is provided for general informational and educational purposes only and reflects market observations, publicly available information, and professional experience at the time of writing. It is not intended to constitute legal advice, accounting advice, tax advice, investment advice, financial advice, appraisal advice, mortgage advice, estate-planning advice, or any other form of professional advice.
Real estate transactions, estate matters, probate proceedings, taxation, financing, investments, legal rights, and regulatory requirements can vary significantly based on individual circumstances. Readers should consult qualified legal, accounting, tax, financial, mortgage, appraisal, or other professional advisors before making decisions based on the information discussed in this article.
Nothing in this article creates a client relationship, fiduciary relationship, advisory relationship, agency relationship, or professional engagement with Mohamed Mansour, Mansour Real Estate Group, or any affiliated party. Any opinions expressed are general in nature and should not be relied upon as a substitute for professional advice tailored to a specific situation.
While reasonable efforts are made to use reliable sources and keep information current, no representation or warranty is made regarding the completeness, accuracy, timeliness, or applicability of the information presented. Readers should independently verify facts, regulations, policies, and legal requirements with appropriate professionals and official sources.



