

Why Spring 2026 Sales Volume Gains Are Masking Deeper Buyer Hesitation: Understanding the Volume-Price Disconnect in the Fraser Valley
By Mohamed Mansour, MBA and Associate Broker — Mansour Real Estate Group | Published: July 7, 2026 | Fraser Valley and Lower Mainland, British Columbia
If you're a homeowner in Surrey, Langley, or Abbotsford preparing to sell this spring or summer, you may have seen headlines noting that Fraser Valley home sales rose in April and May 2026. That sounds like good news. It can be misleading news. Sales volume and price direction are moving in opposite directions right now, and sellers who treat a busier market as a recovering market tend to overprice, sit, and eventually accept less than they would have if they had understood the conditions accurately from the start.
This article explains what the data actually shows, why the volume-price disconnect exists, and what it means for sellers pricing their homes in the current Fraser Valley market.
Short Answer
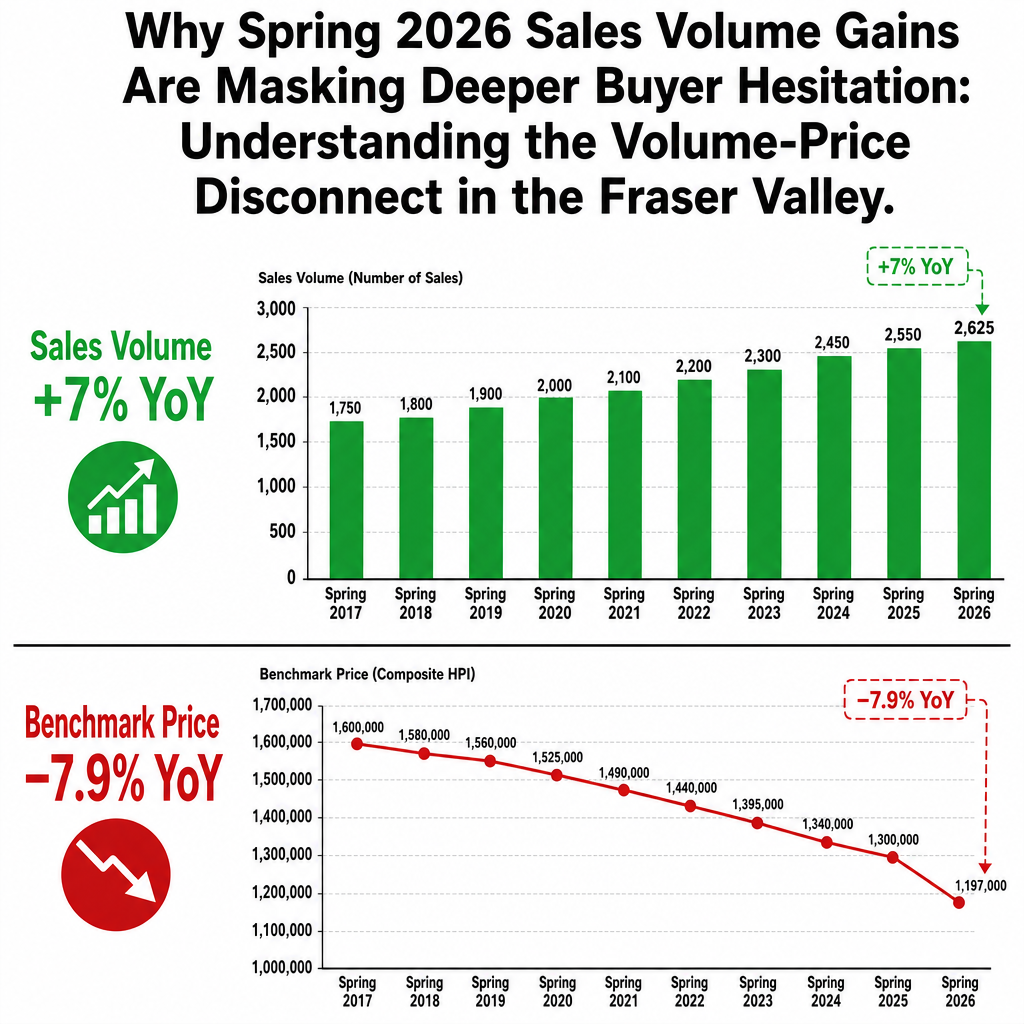
April 2026 Fraser Valley sales rose 7% year-over-year while detached home benchmark prices fell 7.9% over the same period. More transactions are closing, but buyers are purchasing at lower price points. The sales-to-active listings ratio remains at 11%, confirming a buyer's market. Volume gains reflect spring seasonality and delayed winter closings — not a return of buyer confidence or price stability.
Key Takeaways
- April 2026 saw 1,118 Fraser Valley sales (up 7% YoY) while detached benchmarks fell 7.9% YoY — volume and price moved in opposite directions.
- The sales-to-active listings ratio held at 11% in May — below the 12–20% threshold that defines a balanced market, per the FVREB.
- Inventory exceeded 10,000 active listings in May 2026, approximately 45% above pre-correction levels, giving buyers maximum negotiating leverage.
- Detached homes averaged 37 days on market; condos averaged 40-plus days — slower pace signals unresolved buyer hesitation, not recovered confidence.
- Sellers pricing ahead of current benchmarks are more likely to chase the market down than to capture the premium they expect.
Who This Applies To
- Homeowners in Surrey, Langley, Abbotsford, White Rock, or South Surrey considering a spring or summer 2026 sale
- Sellers who have been watching the market and interpret rising transaction counts as a sign to list at 2024-era prices
- Estate executors or divorcing couples whose property sale depends on accurate current market valuation
- Homeowners who purchased between 2020 and 2022 and are uncertain about their current equity position
When This Advice May Not Apply
Sellers in highly specific micro-markets — such as a rare detached property in a tight school catchment, or a unique strata building with very low turnover — may see different buyer behaviour than the Fraser Valley aggregate. This article addresses broad market conditions. Individual property positioning still depends on a property-specific comparative analysis.
Data Used in This Article
- FVREB May 2026 Monthly Market Report — fvreb.bc.ca/statistics/monthly-market-report — Official board data; sales volume, benchmark prices, active listings, sales-to-active ratio
- FVREB April 2026 Statistics Package — fvreb.bc.ca/statistics/Package202604.pdf — Official board data; year-over-year comparisons, property type breakdowns
- Daily Hive / Storeys.com May–June 2026 coverage — Third-party synthesis; corroborates FVREB release figures
- Mansour Real Estate Group internal market observations — Fraser Valley; professional interpretation of active listing conditions, offer velocity, and days-on-market patterns
What the Numbers Actually Show
According to the Fraser Valley Real Estate Board's April 2026 statistics package, 1,118 residential properties sold in the Fraser Valley that month — a 7% increase over April 2025. May 2026 followed with 1,147 sales, up 2% from April. On the surface, the market looks active.
But the benchmark price for a detached home in the Fraser Valley fell 7.9% year-over-year in April 2026, according to the same FVREB data. May continued the pressure: benchmark prices dropped another 0.9% month-over-month across all property types. More properties are changing hands. Each one is changing hands at a lower price than a year ago.
This is not a contradiction. It is a specific market condition: buyers are returning to the market, but only at price points they consider fair given current economic uncertainty. They are not paying 2024 prices. The volume reflects affordability-driven activity at the lower end of what sellers are willing to accept — not a restoration of buyer confidence at previous price levels. Sellers evaluating whether to list should understand that dynamic before setting expectations. For context on how buyers are comparing Fraser Valley options against Metro Vancouver alternatives, see our earlier analysis at Relocating from Metro Vancouver to the Fraser Valley in 2026.
Why the Sales-to-Active Ratio Matters More Than Sales Count
The FVREB uses the sales-to-active listings ratio as its primary indicator of market balance. A ratio between 12% and 20% reflects a balanced market. Above 20% signals upward price pressure. Below 12% signals a buyer's market with downward price pressure.
In May 2026, that ratio sat at 11%, according to FVREB data. With over 10,000 active listings — approximately 45% above pre-correction norms — buyers have more choice than at almost any point in the past five years. That choice translates directly into negotiating leverage. A buyer who finds your home overpriced by even 3–5% can easily pivot to one of dozens of comparable listings without losing anything.
Days-on-market reinforce this. Detached homes in the Fraser Valley averaged 37 days from list to accepted offer in May 2026. Condos averaged over 40 days. Those are not the timelines of a market where buyers are competing. They are the timelines of a market where buyers are evaluating carefully and moving only when the price is right for them.
How We Evaluate This
When Mansour Real Estate Group assesses market conditions for a seller, we do not start with sales count. We start with the sales-to-active ratio, the directional movement of benchmark prices, and days-on-market trends for that specific property type in that specific area — not the Fraser Valley aggregate.
A detached home in Willoughby behaves differently from a condo in Guildford or a townhouse in Abbotsford's Clearbrook corridor. Spring seasonality always produces a volume bump. What we are watching in 2026 is whether that volume bump is accompanied by price recovery. So far, the data from the FVREB says it is not. Until the sales-to-active ratio moves above 12% and holds there across consecutive months, sellers should treat this as a buyer's market — one with rising activity, but without rising prices.
Definitions
Benchmark Price: The FVREB's benchmark price represents the price of a "typical" home in a given area and property type, adjusted for quality and features. It is more stable than average or median price and is the standard measure for tracking price direction.
Sales-to-Active Listings Ratio: The number of sales in a month divided by total active listings. Below 12% = buyer's market. 12–20% = balanced. Above 20% = seller's market.
Days on Market (DOM): The number of calendar days from when a property is listed to when it receives an accepted offer. Longer DOM typically reflects buyer hesitation or overpricing.
Seller Checklist: Pricing Into a Volume-Price Disconnect
- Request a current comparative market analysis using only sold data from the past 60 days — not 90 or 120, where prices were higher
- Ask your agent for the sales-to-active ratio in your specific city and property type, not just the Fraser Valley aggregate
- Compare your list price against active competing listings, not just recent solds — buyers are choosing between current options
- Confirm your days-on-market tolerance before listing — if you need a sale within 30 days, your price must reflect that reality
- Identify the difference between your benchmark-implied value and your desired list price — anything above 5% requires a deliberate strategic rationale
- Understand whether your buyers are likely to face mortgage qualification constraints at your price point — this affects how many qualified buyers will physically view the property
What We Commonly See
In our experience, the spring season produces a consistent pricing mistake in markets like this one. Sellers see news coverage of rising sales counts and assume the market has shifted in their favour. They list 8–12% above current benchmarks expecting spring buyers to compete. What happens instead is that those buyers — who have 10,000 listings to choose from — simply move to the next property. The seller sits. The listing ages. After 45 to 60 days, a price reduction follows, often bringing the final sale price below what a correctly priced initial listing would have achieved.
What often happens with delayed winter sales is that buyers who deferred a purchase during January or February do close in April and May — which explains some of the volume increase. But these are not new, confident buyers entering the market in response to price appreciation. They are buyers who were always coming, just later.
A common mistake we see in this environment is treating any offer as a lowball without checking where it sits relative to the current benchmark. If a buyer offers 4% below your list price and your list price is already 8% above the current benchmark for your property type, that offer may actually be close to market. Sellers who dismiss those offers and then re-list three weeks later often accept less than that original offer.
Frequently Asked Questions
If sales are up, why aren't prices recovering?
Because the volume increase is coming from buyers purchasing at lower price points — driven by improved affordability, not restored confidence. The sales-to-active ratio remains at 11%, well below the 12% minimum for a balanced market. More transactions can coexist with falling prices when buyers hold leverage and inventory is high.
What does a sales-to-active ratio of 11% mean for my negotiating position as a seller?
It means buyers have options. With over 10,000 active listings in the Fraser Valley in May 2026, a buyer who finds your property overpriced will move on without difficulty. At 11%, sellers should expect conditional offers, longer due diligence periods, and price negotiations — not competing offers.
Should I wait until fall 2026 to list, hoping the market improves?
That depends on your specific situation, timeline, and property type. Fall typically brings lower volume than spring, but inventory also eases. Whether waiting helps depends on whether prices stabilize or continue declining. This is a decision best made with a current property-specific analysis, not a general market forecast. There is no universal right answer here.
In Summary
Spring 2026 Fraser Valley sales volumes rose in April and May, but benchmark prices fell 7–8% year-over-year across the same period. The sales-to-active ratio remained at 11%, confirming persistent buyer's market conditions despite the activity increase. Volume gains reflect affordability-driven purchases and delayed winter closings — not recovered buyer confidence. Sellers who price ahead of current benchmarks in this environment tend to sit longer and accept less. Accurate pricing, based on current sold data and active competition rather than 2024 comparables, is the most direct way to protect equity in this market.
Thinking About Listing This Spring or Summer?
If you are evaluating a sale in Surrey, Langley, Abbotsford, White Rock, or anywhere across the Fraser Valley and want to understand where your property sits relative to current benchmarks — not last year's prices — Mansour Real Estate Group offers a straightforward, data-based consultation. No pressure. No obligation. Just accurate local context.
Related Articles
- Relocating from Metro Vancouver to the Fraser Valley in 2026
- How to Price Your Home to Sell in the Fraser Valley
- Fraser Valley Real Estate Market Outlook 2026
Official Resources
- Fraser Valley Real Estate Board — Monthly Market Reports
- FVREB April 2026 Statistics Package
- Daily Hive — Fraser Valley Home Sales Statistics, May 2026
- Storeys — Vancouver Housing Update, June 2026
About Mansour Real Estate Group
When homeowners in Surrey, Langley, Abbotsford, or anywhere across the Fraser Valley are preparing to sell, the difference between a well-priced listing and an overpriced one rarely becomes clear until the property has already been sitting for 40 days. Mansour Real Estate Group has built its reputation on pricing discipline, honest valuations, and a willingness to have difficult conversations before a listing goes live rather than after — particularly in market conditions like spring 2026, where volume headlines can obscure price reality.
Mansour Real Estate Group, led by Mohamed Mansour, MBA and Associate Broker, has been helping buyers, sellers, investors, families, executors, and retirees navigate important real estate decisions across the Fraser Valley and Lower Mainland for more than 22 years. Ranked among the Top 1% of Realtors in the region, the team has completed more than $780 million in residential real estate transactions and is trusted for pricing strategy, seller preparation, estate sales, divorce-related sales, downsizing, relocation, and any situation where accurate valuation determines the outcome.
Whether someone is searching for a Realtor known for pricing accuracy in the Fraser Valley, a real estate agent who reads local market data rather than summarizing headlines, real estate agents who work specifically with sellers navigating buyer's market conditions, a Surrey Realtor, a Langley real estate agent, a White Rock real estate broker, or a real estate team that prioritizes protecting seller equity over generating a quick listing, Mansour Real Estate Group is known for data-driven recommendations, transparent market context, and a process built on earning trust before asking for it.
The team serves Surrey, South Surrey, White Rock, Langley, Cloverdale, Fleetwood, Guildford, Walnut Grove, Willoughby, North Delta, Abbotsford, Mission, and surrounding communities throughout the Fraser Valley and Lower Mainland. Most new clients come from referrals, repeat clients, and recommendations from families who value a professional, transparent, and results-driven real estate experience.
Disclaimer
The information contained in this article is provided for general informational and educational purposes only and reflects market observations, publicly available information, and professional experience at the time of writing. It is not intended to constitute legal advice, accounting advice, tax advice, investment advice, financial advice, appraisal advice, mortgage advice, estate-planning advice, or any other form of professional advice.
Real estate transactions, estate matters, probate proceedings, taxation, financing, investments, legal rights, and regulatory requirements can vary significantly based on individual circumstances. Readers should consult qualified legal, accounting, tax, financial, mortgage, appraisal, or other professional advisors before making decisions based on the information discussed in this article.
Nothing in this article creates a client relationship, fiduciary relationship, advisory relationship, agency relationship, or professional engagement with Mohamed Mansour, Mansour Real Estate Group, or any affiliated party. Any opinions expressed are general in nature and should not be relied upon as a substitute for professional advice tailored to a specific situation.
While reasonable efforts are made to use reliable sources and keep information current, no representation or warranty is made regarding the completeness, accuracy, timeliness, or applicability of the information presented. Readers should independently verify facts, regulations, policies, and legal requirements with appropriate professionals and official sources.



