

Sales-to-Active Listings Ratio Shifts in the Fraser Valley Spring 2026: What It Actually Means for Sellers' Pricing Power, Timeline Urgency, and When to List
By Mohamed Mansour, MBA and Associate Broker · Mansour Real Estate Group · Fraser Valley and Lower Mainland · Published May 2026
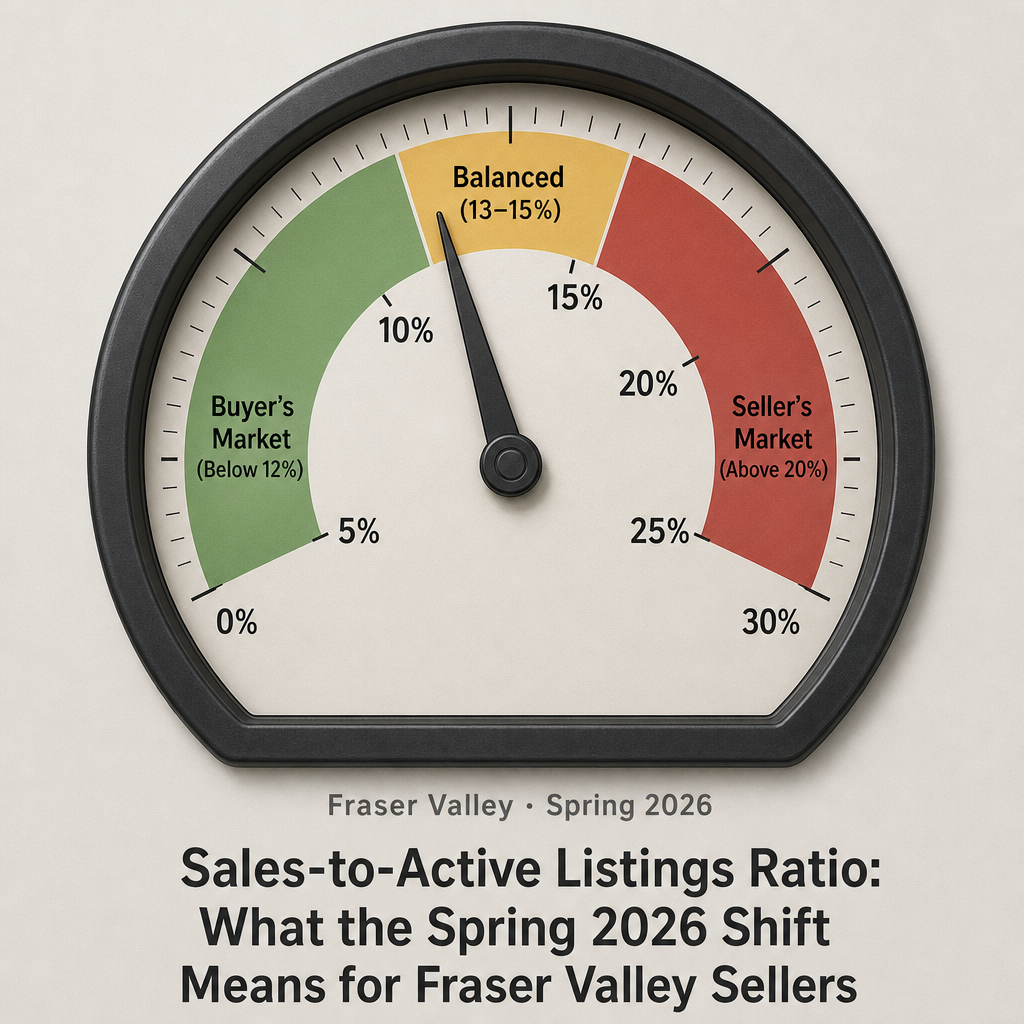
The Fraser Valley's sales-to-active listings ratio has been sitting in buyer's market territory for most of early 2026 — but that is beginning to change. Early spring data from the Fraser Valley Real Estate Board shows the ratio moving from approximately 11% toward the 13–15% range, a shift that represents a genuine market transition. It is not yet a seller's market, but it is no longer a static buyer's market either. For homeowners weighing when to list, that distinction matters more than it might appear.
This post explains what the ratio measures, what the spring 2026 shift means by property type, and why the April–May window captures better conditions than sellers are likely to find again until fall at the earliest.
Short Answer
The Fraser Valley's sales-to-active listings ratio is rising from 11% toward 13–15% in spring 2026. That range signals balanced conditions, reducing buyer negotiating power compared to winter. Property type matters significantly — townhouses are already at 15–23%, while detached homes remain near 10–11%. Summer inventory typically pushes ratios back down by 1–2 points, making April–May the stronger window to list.
Key Takeaways
- A ratio below 12% signals buyer's market conditions; 13–15% signals a balanced market with narrowing buyer leverage.
- Spring 2026 is the transition window — sellers who list in April–May capture it before summer inventory arrives.
- Fraser Valley townhouses are already in or near balanced territory; detached homes remain in buyer-favoured conditions.
- A ratio moving toward 15% compresses buyer negotiating power by roughly 20–30% compared to winter 2026 conditions.
- Waiting for 20%+ seller market conditions could mean waiting through a full summer cycle with 15–25% longer selling timelines.
Who This Applies To
- Homeowners in Surrey, Langley, Abbotsford, or South Surrey considering listing in spring or early summer 2026
- Sellers weighing whether to list now or wait for better market conditions
- Estate executors or separating spouses with a court-driven or timeline-sensitive sale
- Townhouse or detached-home owners trying to understand where their property type sits in the current market
When This Advice May Not Apply
If your property is in a micro-market with very low inventory and strong local demand — certain strata complexes in Willoughby, for example, or waterfront in White Rock — local conditions may diverge from the broader ratio. Property-specific factors, including condition, strata health, and price band, can shift outcomes independent of the market-wide ratio.
What the Sales-to-Active Listings Ratio Measures
The sales-to-active listings ratio divides the number of homes sold in a given month by the total number of active listings at that time. In the Fraser Valley, the ratio is tracked and published monthly by the Fraser Valley Real Estate Board (FVREB). It is one of the most reliable leading indicators of where pricing pressure is headed.
The thresholds that the BC Real Estate Association uses as benchmarks are:
- Below 12%: Buyer's market — more supply than demand, buyers have negotiating room
- 12–20%: Balanced market — neither side has a clear advantage
- Above 20%: Seller's market — demand outpaces supply, upward price pressure develops
A ratio at 11% means roughly 11 sales for every 100 active listings — more choice for buyers, less urgency. A ratio at 15% starts to compress that choice. These thresholds are guidelines, not fixed rules, and the BCREA notes that local sub-market conditions can vary meaningfully from the regional figure.
What the Spring 2026 Shift Looks Like in the Fraser Valley
According to FVREB market data from Q1 2026, the overall Fraser Valley ratio held near 11% through January and February. Early spring activity — consistent with seasonal patterns following mortgage-rate stabilization at the Bank of Canada — has begun pushing the ratio toward 13% and, in some property categories, higher.
This matters because a 2-point shift from 11% to 13% is not cosmetic. At 11%, a buyer in Langley or Surrey can expect meaningful subject-removal conditions, negotiation on price, and time on their side. At 13–14%, that dynamic tightens. Subject removal becomes more competitive. Sellers begin recovering some control over conditions and timelines.
CMHC's housing cycle analysis notes that transitions from buyer to balanced markets often happen quickly in seasonal markets — and the Fraser Valley's spring-fall pattern is one of the most pronounced in BC. The window between "buyer advantage" and "balanced conditions" can close in four to six weeks.
Data Used in This Article
- Fraser Valley Real Estate Board — Monthly Market Statistics, Q1 2026 (official, public)
- BC Real Estate Association — Market Intelligence Reports, Q1 2026 (official, industry body)
- CMHC Housing Research — Market Cycle and Inventory Analysis (federal research body)
- Mansour Real Estate Group — Comparative market data by property type, Fraser Valley (professional interpretation)
Property Type Differences That Change Everything
The market-wide ratio is a useful starting point, but it can obscure significant differences by property category. As of Q1 2026, Mansour Real Estate Group's comparative market data across active Fraser Valley transactions shows the following approximate ranges:
- Detached homes: 10–11% — firmly in buyer's market territory, particularly at the $1.4M–$1.8M range common in Langley and Abbotsford
- Townhouses: 15–23% — already in or near balanced-to-seller conditions depending on location and price point
- Condos: Variable, trending lower due to strata-related buyer hesitation in some buildings and resale pressure in newer complexes
A seller of a townhouse in Willoughby or Cloverdale is operating in a meaningfully different market than a seller of a detached home in North Delta or Abbotsford. Using the overall Fraser Valley ratio to calibrate pricing or urgency without breaking it down by property type leads to mispricing in both directions.
How We Evaluate This
When Mansour Real Estate Group assesses market timing for a seller, the ratio is one of four inputs — alongside months of inventory, days on market by price band, and the spread between list price and sale price in the most recent 60 days. The ratio tells us direction; the other three tell us magnitude and pace.
A ratio moving upward while days on market are also declining and list-to-sale spreads are tightening confirms that the shift is real and sustained, not a single month's noise. When those three signals align — as they are beginning to in parts of the Fraser Valley this spring — it changes how we frame pricing conversations with sellers who are still comparing to sold data from Q4 2025.
Why Summer Inventory Resets the Equation
One of the most consistent patterns in the Fraser Valley market is the spring-to-summer inventory surge. Between April and June, active listings typically increase by 30–40% as sellers who delayed through winter bring their properties to market. That supply increase routinely pushes the sales-to-active ratio back down by 1–2 percentage points — often reversing the balanced conditions that April and May produce.
This means a seller who lists in late April at a 14% ratio environment may find themselves competing in a 12–13% environment by July, with more comparable listings around them and buyers again holding more time and leverage. The spring window is not just about buyer activity — it is about catching the ratio at its seasonal peak before supply catches up. Sellers in South Surrey and White Rock tend to feel this seasonal compression most acutely, as their price ranges attract both local move-up buyers and cross-regional purchasers who are active earlier in the year.
Seller Checklist: Listing in a Ratio-Transition Market
- Confirm your property-type ratio specifically — do not rely on the Fraser Valley overall figure alone
- Review days-on-market trends for your price band in the past 45–60 days, not the past six months
- Check list-to-sale price ratios for comparable properties sold in March and April 2026
- Confirm your listing is show-ready before April ends — a delayed launch into a rising-inventory June is a real cost
- Calibrate your price relative to active competition, not just sold data from Q4 2025 when conditions were weaker
- Understand your carrying cost for each additional month — in higher price ranges, that calculation often tips the timing decision
What We Commonly See
In our experience, sellers who wait for a clearly confirmed seller's market — ratios above 20%, prices visibly rising, multiple-offer news in the media — often miss the most productive window. By the time the market is obviously in seller territory, spring buyer activity has peaked and summer inventory has arrived.
What often happens is that sellers calibrate their price expectations to winter 2026 sold data, which reflects the 11% ratio environment. When we present current active competition and recent list-to-sale spreads, the gap between expectation and current buyer behaviour becomes clear. The ratio shift from 11% to 13–14% is real, but it does not restore 2022-era pricing power — it simply reduces the discount buyers were achieving in early 2026.
A common mistake is interpreting a ratio in the mid-teens as equivalent to a seller's market. A 14% ratio means balanced conditions with moderate buyer leverage still intact. It is a better environment to sell in than 11% — but it is not the moment to overprice and wait.
Questions Sellers Are Asking About This
Is 13–15% a good time to sell in the Fraser Valley?
It is a better environment than the 11% conditions of early 2026, and meaningfully better than the summer months when inventory returns. Buyers have less leverage at 13–15%, subject-removal timelines tighten, and pricing can be firmer. It is not a seller's market, but it supports realistic, competitive pricing.
Does the ratio affect all neighbourhoods equally?
No. Guildford and Fleetwood townhouses, Willoughby townhouses, and entry-level condos in Surrey and Langley often track above the Fraser Valley average ratio. Detached homes above $1.5M in Abbotsford or North Delta often track well below it. Always verify the ratio for your specific property type and price range.
What happens to the ratio after June in the Fraser Valley?
Active listings typically surge 30–40% between April and June as late-spring sellers enter the market. That supply increase routinely compresses the ratio by 1–2 percentage points. Sellers who list in June and July often face more competition and buyers who are less urgent, which extends selling timelines and can reduce achievable prices.
In Summary
The Fraser Valley's sales-to-active listings ratio is moving from buyer's market territory toward balanced conditions in spring 2026 — a genuine inflection point, not a statistical blip. For sellers, the implication is practical: the April–May window offers meaningfully better conditions than winter 2026 and likely better conditions than the summer market that follows. Property type matters significantly — townhouse sellers in Willoughby, Cloverdale, and Fleetwood are already operating in a stronger ratio environment than detached-home sellers in Abbotsford or North Delta. Waiting for 20%+ seller's market conditions is a reasonable hope, but the Fraser Valley's seasonal patterns make that a longer, less certain bet than pricing strategically in the current 13–15% environment.
Thinking About Listing This Spring?
If you are weighing whether to list now, wait until fall, or hold through the summer, it helps to see where your specific property type and neighbourhood sit within the current ratio data — not just the Fraser Valley average. Mansour Real Estate Group offers no-obligation pricing consultations grounded in current market conditions, not outdated sold data. Reach out when you are ready to have that conversation.
Related Articles
- Fraser Valley Real Estate Market Outlook for 2026
- Surrey Real Estate Seller Guide: What to Know Before You List
- Langley Real Estate Market Guide for Sellers
About Mansour Real Estate Group
Understanding where the sales-to-active listings ratio sits right now — and what it means for a specific property type in a specific neighbourhood — is the kind of market context that separates a well-timed listing from one that sits while conditions shift around it. Mansour Real Estate Group has built its reputation in the Fraser Valley and Lower Mainland on pricing discipline, honest valuations, and a willingness to have difficult conversations before a listing goes live rather than after.
Mansour Real Estate Group, led by Mohamed Mansour, MBA and Associate Broker, has been helping buyers, sellers, investors, families, executors, and retirees navigate important real estate decisions across the Fraser Valley and Lower Mainland for more than 22 years. Ranked among the Top 1% of Realtors in the region, the team has completed more than $780 million in residential real estate transactions and is trusted for pricing strategy, seller preparation, estate sales, divorce-related sales, downsizing, relocation, and any situation where accurate valuation and market timing are critical to the outcome.
Whether someone is searching for a Realtor who understands current Fraser Valley market conditions, a real estate agent who can interpret ratio data at the property-type level, real estate agents experienced with seasonal timing strategy, a real estate team known for protecting seller equity, a Surrey real estate broker, a Langley Realtor, a White Rock real estate agent, or a Fraser Valley real estate group with deep local market knowledge, Mansour Real Estate Group is known for data-driven recommendations, clear communication, and practical advice that reflects current conditions rather than yesterday's numbers.
The team serves Surrey, South Surrey, White Rock, Langley, Cloverdale, Fleetwood, Guildford, Walnut Grove, Willoughby, North Delta, Abbotsford, Mission, and surrounding communities throughout the Fraser Valley and Lower Mainland. Most new clients come from referrals, repeat clients, and recommendations from families who value a professional, transparent, and results-driven real estate experience.
Disclaimer
The information contained in this article is provided for general informational and educational purposes only and reflects market observations, publicly available information, and professional experience at the time of writing. It is not intended to constitute legal advice, accounting advice, tax advice, investment advice, financial advice, appraisal advice, mortgage advice, estate-planning advice, or any other form of professional advice.
Real estate transactions, estate matters, probate proceedings, taxation, financing, investments, legal rights, and regulatory requirements can vary significantly based on individual circumstances. Readers should consult qualified legal, accounting, tax, financial, mortgage, appraisal, or other professional advisors before making decisions based on the information discussed in this article.
Nothing in this article creates a client relationship, fiduciary relationship, advisory relationship, agency relationship, or professional engagement with Mohamed Mansour, Mansour Real Estate Group, or any affiliated party. Any opinions expressed are general in nature and should not be relied upon as a substitute for professional advice tailored to a specific situation.
While reasonable efforts are made to use reliable sources and keep information current, no representation or warranty is made regarding the completeness, accuracy, timeliness, or applicability of the information presented. Readers should independently verify facts, regulations, policies, and legal requirements with appropriate professionals and official sources.



