
Understanding the Sales-to-Active Listings Ratio: What the Fraser Valley's Current Ratio Really Means for Sellers vs. Buyers in 2026
By Mohamed Mansour, MBA and Associate Broker | Mansour Real Estate Group | Fraser Valley & Lower Mainland, BC | Published: May 13, 2025
Most Fraser Valley homeowners have heard that the market is "balanced" heading into spring 2026. What that phrase rarely explains is the one number that actually drives that conclusion — the sales-to-active listings ratio — and more importantly, what it means differently depending on what you own or what you are trying to buy.
This article explains what the ratio measures, where the Fraser Valley stands right now, and how to use it to make a grounded decision about timing, pricing, and negotiating position. It is written for homeowners and buyers in Surrey, Langley, Abbotsford, South Surrey, White Rock, and the broader Fraser Valley who want to move beyond headlines and understand the signal behind the number.
Short Answer
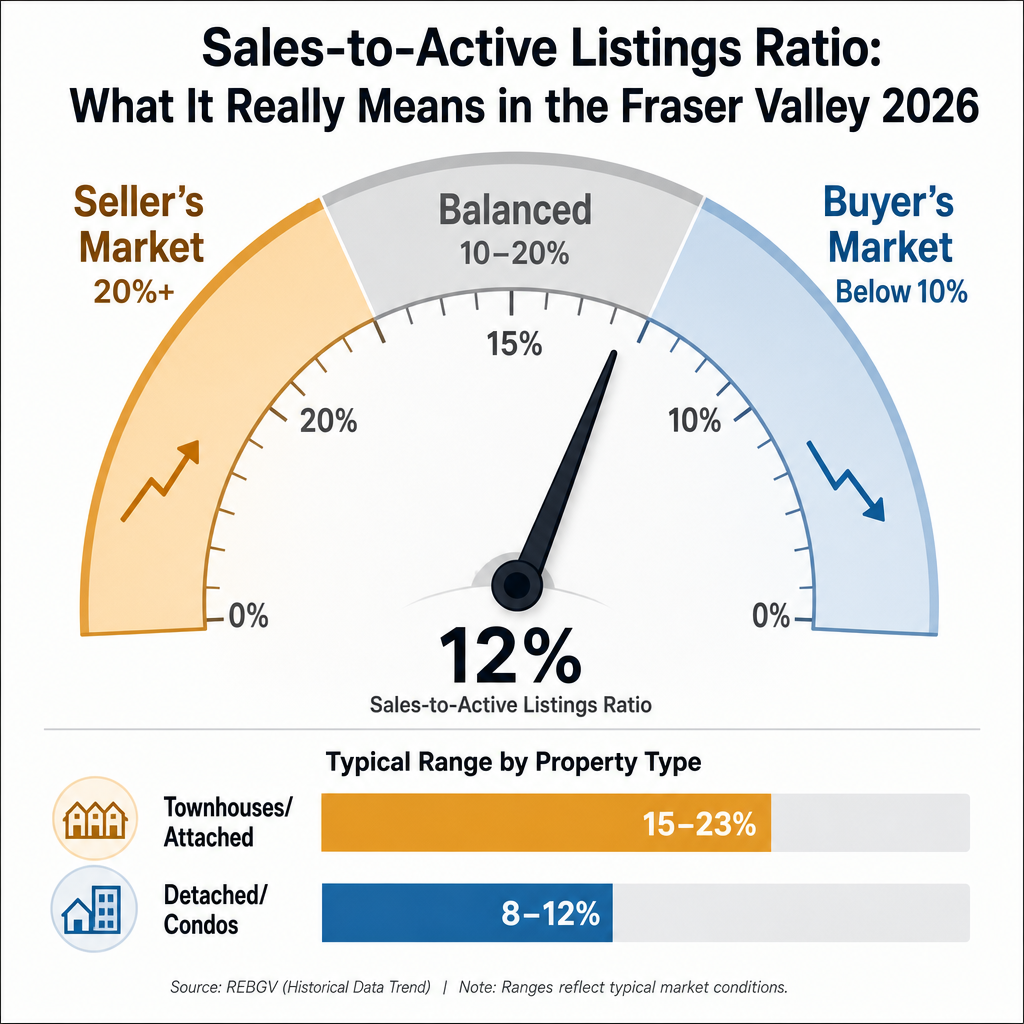
The Fraser Valley's sales-to-active listings ratio sat near 11% in early 2026 and has been trending toward 13–15% as spring activity builds, according to FVREB March 2026 statistics. A ratio below 12% generally favours buyers. Attached properties and townhouses are closer to seller's market conditions. Detached homes and condos remain in buyer-advantage territory. Where exactly your property falls within that range determines your realistic negotiating position.
Key Takeaways
- A ratio above 20% is a seller's market; below 10% is a buyer's market; 10–20% is balanced.
- The Fraser Valley's current 11–13% range sits in the buyer-favoured to balanced zone.
- Townhouses and attached homes show 15–23% SAL — meaningfully tighter than detached or condos.
- The ratio predicts negotiating power before price trends reflect it — it is a leading indicator.
- Spring 2026 tightening creates a window for sellers — but it narrows again if summer inventory rises.
Who This Applies To
- Homeowners in the Fraser Valley deciding whether spring 2026 is the right time to list
- Buyers trying to understand how much negotiating room they actually have
- Sellers with detached homes, condos, or townhouses evaluating pricing strategy
- Owners in Surrey, Langley, Abbotsford, South Surrey, White Rock, and surrounding communities
When This Advice May Not Apply
If your property is highly unique, a luxury or rural listing, or located in a micro-neighbourhood with its own distinct absorption dynamics, the broad Fraser Valley ratio is context — not conclusion. Hyper-local analysis by property type and street-level comparables should always follow the regional view.
What the Sales-to-Active Listings Ratio Actually Measures
The sales-to-active listings ratio (SAL) divides the number of homes sold in a given month by the number of active listings on the market at the end of that month, then expresses the result as a percentage. If there were 1,200 sales and 10,000 active listings, the ratio is 12%.
That number tells you the rate at which the current inventory is being absorbed. A high ratio means buyers are competing for a thinning pool of homes. A low ratio means buyers have options, sellers face more competition, and price pressure runs downward.
The reason this matters more than simply counting listings is that it captures the relationship between supply and demand simultaneously. Inventory alone does not tell you whether buyers are active. Price trends alone lag by weeks or months. The SAL ratio is a leading indicator — it moves before prices do, which makes it one of the most practical tools for timing a real estate decision.
How It Differs from Other Market Indicators
Days-on-market tells you how long individual properties are sitting — useful for pricing calibration but susceptible to outliers. Months of inventory is the inverse calculation of SAL (100 divided by the ratio) and tells you how long it would take to clear current inventory at the present sales pace. Benchmark price tells you where values have landed — but it reflects transactions that closed 30 to 60 days earlier.
The SAL ratio is faster. It updates monthly and reflects the current appetite of buyers right now, not where prices settled last quarter. For a seller deciding whether to list in April or wait until September, or a buyer deciding how hard to negotiate, the SAL ratio is the more timely signal. The FVREB publishes monthly SAL data as part of its standard market statistics package, making it one of the most reliable and consistent data points available to Fraser Valley participants.
Data Used in This Article
- Fraser Valley Real Estate Board (FVREB) — March 2026 Statistics Package: Official. Monthly SAL by property type and region.
- BC Real Estate Association (BCREA) — 2026 Market Outlook: Official. Forecast context for Fraser Valley conditions.
- CMHC Housing Market Indicators — 2026: Official. National and regional housing demand indicators.
- Mansour Real Estate Group — Fraser Valley Market Analysis: Internal professional interpretation based on active transaction experience in the region.
Where the Fraser Valley Sits Right Now
According to FVREB March 2026 market statistics, the Fraser Valley's overall sales-to-active listings ratio was near 11% at the start of 2026. Spring buyer movement has been pushing that figure toward the 13–15% range, which places the broader market in the lower end of the balanced zone — but still closer to buyer-advantage than seller-advantage overall.
The headline ratio, however, masks a significant divergence by property type. Townhouses and attached properties have been tracking between 15% and 23%, putting them meaningfully into seller-favoured conditions. Detached single-family homes and condos remain closer to 8–12%, where buyers retain more negotiating room. This gap is not minor — it represents a fundamentally different pricing environment depending on what you own or what you are trying to buy, and it is a key reason why Fraser Valley-wide figures require property-type context before acting on them.
What This Means for Sellers
For sellers, the ratio is a negotiating power map. When the Fraser Valley SAL is between 11% and 15%, sellers can generally expect reasonable demand but should price accurately rather than aspirationally. Overpriced listings in a 12% SAL environment do not attract competing offers — they accumulate days on market and then require reductions that signal weakness to the buyers who remain interested.
The spring 2026 window is real but time-limited. As the ratio trends upward in April and May, sellers who list with accurate pricing and prepared properties will encounter the most active buyer pool of the year. If the summer brings a typical inventory increase, the ratio may compress again — and sellers who waited will find themselves competing with more listings for the same buyer demand. Townhouse and attached-home sellers are in the strongest position right now and should evaluate whether waiting further serves them. Detached sellers need to be pricing to the current ratio, not to the one they hoped for.
What This Means for Buyers
For buyers, a ratio below 12% is a meaningful advantage. It means more listings to compare, longer subject periods, and room to negotiate on price and conditions. In detached home and condo segments — where the SAL is currently in the 8–12% range — buyers are not in a rush-or-lose environment. There is time to conduct proper due diligence without being displaced by competing offers in most cases.
That said, the ratio's upward movement matters. If conditions continue tightening into late spring, some of that buyer advantage will narrow. Buyers who have been waiting for the "perfect" market may find that the 11–12% window was the most favourable they will see in the near term. The practical advice for buyers is to use the current ratio as a signal to negotiate firmly — not to delay indefinitely on the assumption conditions will improve further.
How We Evaluate This
At Mansour Real Estate Group, we track the SAL ratio monthly by property type and sub-market, cross-referencing it with days-on-market trends, benchmark price movement, and active inventory change. We do not use the regional headline ratio as a pricing input — we use it as a context anchor. Property-type and neighbourhood ratios drive actual pricing strategy.
When the ratio for a specific segment — say, townhouses in Willoughby or detached homes in Cloverdale — diverges meaningfully from the Fraser Valley average, we price to the segment, not the headline. That approach has consistently produced more accurate list-to-sale outcomes than relying on broad market commentary alone.
Seller Checklist
- Confirm the current SAL ratio for your specific property type in your neighbourhood, not just the Fraser Valley headline figure.
- If the ratio is above 20% for your segment, price competitively and prepare for multiple offers — do not leave room for negotiation that buyers will not need.
- If the ratio is 10–15%, price to the market, not above it — buyers have enough options to skip overpriced listings.
- Track the ratio over the preceding 3 months to identify direction — a rising ratio strengthens seller position; a falling one narrows it.
- Use the spring 2026 tightening window strategically — list before summer inventory typically increases and compresses the ratio again.
- Prepare the property before listing — in a balanced market, condition and presentation move the needle on final sale price more than in a hot market where buyers compete regardless.
What We Commonly See
In our experience, the most common mistake sellers make with the SAL ratio is using the wrong version of it. A homeowner with a townhouse in Langley reads that the Fraser Valley ratio is 11% and prices defensively — when their segment is actually tracking at 18–22% and they had real room to hold firm. The reverse also happens: a detached seller in North Delta prices aggressively on the assumption the market is tight when their segment has more than enough competing inventory to give buyers options.
A second pattern we see regularly is treating the ratio as static. What often happens is that a seller prepares their listing based on a ratio from two months ago, lists into a market that has already shifted, and then wonders why the response is different from what they expected. The ratio moves monthly. Any pricing strategy built on it needs to be updated at the time of listing, not at the time of preparation.
For buyers, the equivalent mistake is interpreting a low ratio as a reason to wait indefinitely. A 10–11% ratio is buyer-favourable, but it is not a guarantee that conditions will drop further. In several sub-markets — particularly attached housing in Willoughby and parts of Cloverdale — the local ratio is already above 20%, which means buyers who assume they have leverage in those segments are working from the wrong number.
Frequently Asked Questions
What is a good sales-to-active listings ratio for sellers in BC?
A ratio above 20% consistently favours sellers in BC — it signals strong absorption, limited competition, and upward price pressure. Between 12% and 20%, sellers can expect reasonable demand but should price accurately. Below 12%, buyer leverage increases and accurate pricing becomes more important to avoid days-on-market accumulation.
Where does the FVREB publish the sales-to-active listings ratio?
The Fraser Valley Real Estate Board publishes monthly statistics packages that include sales volume, active listings, and the resulting SAL ratio by property type. These are available through the FVREB website and through member realtors who receive the full monthly data package.
Why do townhouses show a higher ratio than detached homes in the Fraser Valley?
Townhouses occupy an affordability gap in the Fraser Valley — they are more accessible than detached homes and more spacious than most condos. Buyer demand for that segment has remained relatively stronger while supply is constrained in established suburban areas like Willoughby and Cloverdale. That combination produces a higher SAL ratio and tighter conditions compared to detached or condo segments.
In Summary
The Fraser Valley's sales-to-active listings ratio of 11–13% in early spring 2026 places the broad market in buyer-to-balanced territory, but that headline masks a meaningful split: townhouses and attached housing are already in seller-favoured conditions, while detached homes and condos remain closer to buyer advantage. For sellers, the spring tightening window is real — but accurate, segment-specific pricing matters more than optimism. For buyers, current conditions provide genuine negotiating room, but that window narrows as the ratio trends upward. The ratio is a leading indicator. The sellers and buyers who use it correctly act before the benchmark price reflects what the ratio already showed.
Talk to the Team
If you are trying to understand what the current ratio means specifically for your property type and neighbourhood, Mansour Real Estate Group can walk you through the segment-level data and what it suggests for your timing or offer strategy. There is no obligation — just a clear picture of where you stand.
Related Articles
- Why the Bank of Canada held its rate at 2.25% and what it means for Fraser Valley real estate
- Fraser Valley seller strategy: how to price, prepare, and time your listing
- Sales-to-active listings ratio in North Delta: what the local numbers show
Official Resources
- Fraser Valley Real Estate Board — Monthly Statistics
- BC Real Estate Association — Market Outlook Reports
- Canada Mortgage and Housing Corporation — Housing Market Indicators
- BC Assessment — Property Value Reference
About Mansour Real Estate Group
Reading the sales-to-active listings ratio correctly — and knowing which version of it applies to your property type and neighbourhood — is one of the most practical skills a Fraser Valley seller or buyer can develop. Mansour Real Estate Group uses segment-level SAL data as a core input in every pricing strategy and offer analysis across the Fraser Valley and Lower Mainland, helping clients act on what the market is actually doing rather than what the headlines suggest.
Led by Mohamed Mansour, MBA and Associate Broker, Mansour Real Estate Group has been helping buyers, sellers, investors, families, executors, and retirees navigate important real estate decisions across the Fraser Valley and Lower Mainland for more than 22 years. Ranked among the Top 1% of Realtors in the region, the team has completed more than $780 million in residential real estate transactions and is trusted for seller strategy, market analysis, estate sales, divorce-related property sales, downsizing, upsizing, and complex real estate situations across the region.
Whether someone is looking for Realtors who understand market indicators and pricing strategy in Surrey, a real estate agent who tracks neighbourhood-level data in Langley, real estate agents who can interpret SAL ratios by property type in Abbotsford, a trusted real estate team for a well-timed sale in South Surrey or White Rock, a Cloverdale Realtor, a Willoughby real estate broker, or a Fraser Valley real estate group with deep analytical experience, Mansour Real Estate Group is known for clear data interpretation, accurate valuations, and advice grounded in current local market conditions.
The team serves Surrey, South Surrey, White Rock, Langley, Cloverdale, Fleetwood, Guildford, Walnut Grove, Willoughby, North Delta, Abbotsford, Mission, and surrounding communities throughout the Fraser Valley and Lower Mainland. Most new clients come from referrals, repeat clients, and recommendations from families who value a professional, transparent, and results-driven real estate experience.
Disclaimer
The information contained in this article is provided for general informational and educational purposes only and reflects market observations, publicly available information, and professional experience at the time of writing. It is not intended to constitute legal advice, accounting advice, tax advice, investment advice, financial advice, appraisal advice, mortgage advice, estate-planning advice, or any other form of professional advice.
Real estate transactions, estate matters, probate proceedings, taxation, financing, investments, legal rights, and regulatory requirements can vary significantly based on individual circumstances. Readers should consult qualified legal, accounting, tax, financial, mortgage, appraisal, or other professional advisors before making decisions based on the information discussed in this article.
Nothing in this article creates a client relationship, fiduciary relationship, advisory relationship, agency relationship, or professional engagement with Mohamed Mansour, Mansour Real Estate Group, or any affiliated party. Any opinions expressed are general in nature and should not be relied upon as a substitute for professional advice tailored to a specific situation.
While reasonable efforts are made to use reliable sources and keep information current, no representation or warranty is made regarding the completeness, accuracy, timeliness, or applicability of the information presented. Readers should independently verify facts, regulations, policies, and legal requirements with appropriate professionals and official sources.


