

Understanding the Sales-to-Active Listings Ratio: What BC's Current Market Signal Really Means for Sellers and Buyers Across Different Property Types in 2026
By Mohamed Mansour, MBA and Associate Broker | Mansour Real Estate Group | Fraser Valley & Lower Mainland, BC | Published: May 13, 2026
The sales-to-active listings ratio appears in almost every Fraser Valley market report, but few buyers or sellers understand what it actually measures — or why a single regional number can be almost meaningless without knowing what property type and neighbourhood it applies to. This article explains the metric from the ground up, using current 2026 Fraser Valley data published by the Fraser Valley Real Estate Board.
If you have heard that the Fraser Valley sits in a buyer's market and wondered what that means for your specific situation — whether you are selling a detached home in Surrey, buying a townhouse in Willoughby, or evaluating a condo in Guildford — the answer depends on a ratio that most market headlines report without explaining.
Short Answer
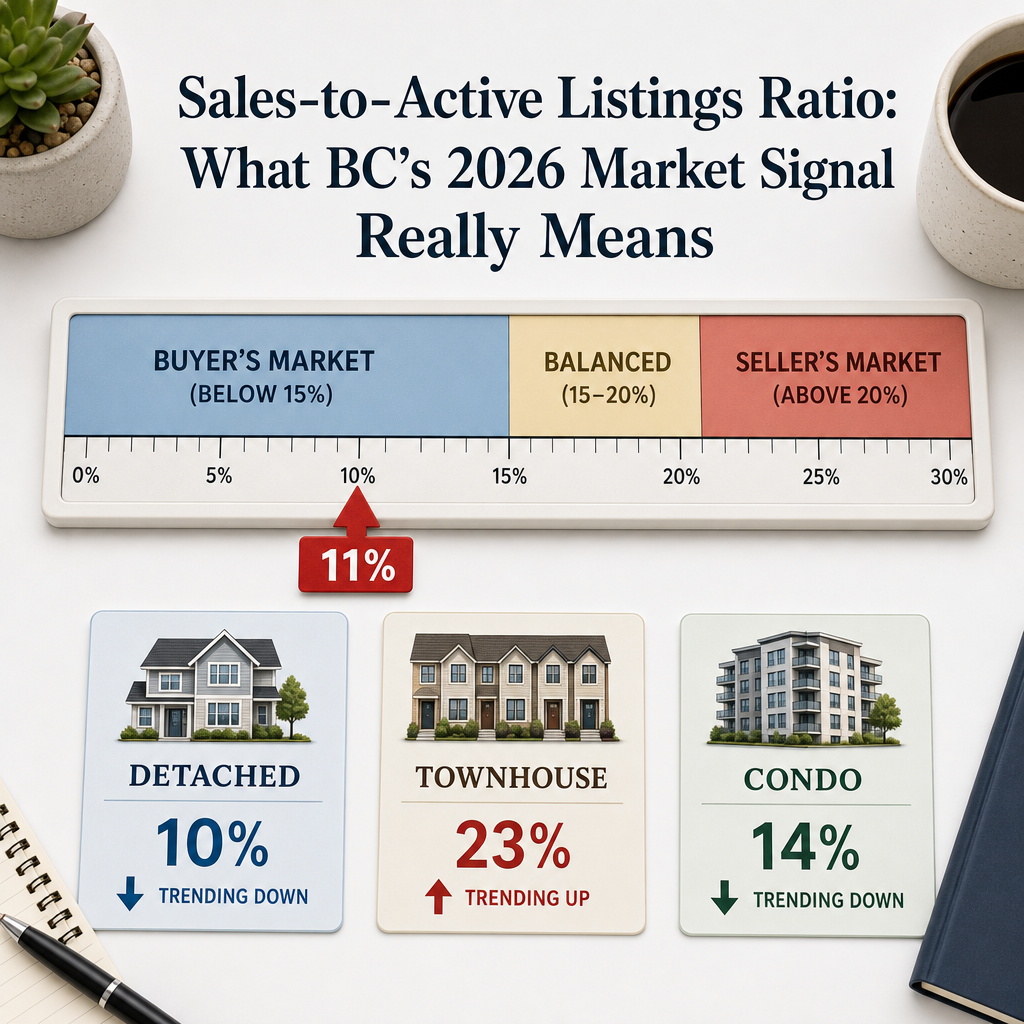
The sales-to-active listings ratio (SAL) divides monthly sales by active listings at month-end. Below 15% is a buyer's market, 15–20% is balanced, and above 20% favours sellers. The Fraser Valley's April 2026 overall ratio of approximately 11% signals a buyer's market — but detached homes sit near 10% while townhouses are near 23%, meaning market conditions vary sharply by property type and neighbourhood.
Key Takeaways
- A ratio below 15% indicates a buyer's market with negotiating leverage; above 20% favours sellers.
- The Fraser Valley's April 2026 SAL of roughly 11% reflects over 10,000 active listings against moderate sales volume.
- Townhouses in some Fraser Valley areas are near 23%, placing them in seller's market territory despite the regional headline.
- Neighbourhood micro-markets within the same city can show SAL ratios 50–80% apart, requiring local strategy.
- SAL measures supply-demand leverage only — it does not predict price direction, days on market, or affordability.
Who This Applies To
- Homeowners preparing to list a detached, townhouse, or condo property in the Fraser Valley in 2026
- Buyers evaluating negotiating position before making an offer
- Investors comparing property types or neighbourhoods for purchase timing
- Estate executors or separating spouses making pricing decisions under time constraints
When This Advice May Not Apply
If your property is in a hyper-local micro-market with fewer than 20 active comparable listings, the regional SAL ratio may be statistically unreliable as a pricing guide. Properties with unique features, significant renovation needs, or unusual legal or strata complexity require analysis that goes beyond this metric.
Data Used in This Article
- Fraser Valley Real Estate Board (FVREB) — April 2026 Monthly Statistics Package: Official; sales volume, active listings, SAL ratios by property type
- BC Financial Services Authority (BCFSA) — Market Data Publications: Official regulatory reference for market condition thresholds
- Canadian Real Estate Association (CREA) — National Sales and Inventory Data: Industry body; used for threshold benchmarks and historical context
- BC Assessment — Property Valuation and Market Trends: Official; supporting context for assessment-period price benchmarks
How the Sales-to-Active Listings Ratio Is Calculated
The formula is straightforward. Take the number of homes sold in a given month and divide it by the number of active listings at the end of that month. Multiply by 100 to express it as a percentage.
For example, if 800 homes sold in the Fraser Valley in April and there were 7,300 active listings at month-end, the SAL ratio would be approximately 11%. According to monthly statistics packages published by the Fraser Valley Real Estate Board, the April 2026 Fraser Valley SAL ratio sat at approximately that level, with active listings exceeding 10,000 across all property types.
The thresholds used by FVREB and widely referenced by CREA are: below 15% indicates downward price pressure and buyer advantage; 15–20% is balanced; above 20% indicates upward price pressure and seller advantage. These thresholds are benchmarks developed from historical correlation between ratio readings and subsequent price movement, not guarantees of future price direction.
Why the Fraser Valley's 11% Overall Ratio Masks Three Very Different Markets
The regional headline ratio combines all property types, which creates a misleading picture for anyone making a specific decision about a specific property. According to FVREB April 2026 data, the SAL ratio by property type diverges significantly:
- Detached homes: approximately 10% — firmly in buyer's market territory, meaning buyers hold meaningful negotiating leverage on price, conditions, and timing
- Condos/apartments: approximately 14% — approaching the lower edge of a balanced market, though still technically in buyer's market range
- Townhouses: approximately 23% — crossing into seller's market territory, where well-priced properties attract competition and sellers have less incentive to negotiate
A seller listing a detached home in Surrey in a market where the detached SAL is 10% needs a fundamentally different pricing and positioning strategy than a seller listing a townhouse in Willoughby where the SAL is near 23%. Using the regional 11% headline to guide either decision would likely produce the wrong result. For context on how these dynamics play out specifically for condo sellers in the Fraser Valley, the property-type divergence matters especially at entry-level price points.
Neighbourhood Micro-Markets: Why the Same City Can Show Ratios 50–80% Apart
The divergence goes deeper than property type. Within a single city, different neighbourhoods can produce SAL ratios that differ by 50% or more. Based on neighbourhood-level analysis of FVREB sales and inventory data for April 2026, areas like Guildford showed detached SAL ratios near 8%, while communities like Walnut Grove and parts of Willoughby showed ratios near 23% for townhouses — within the same regional reporting period.
This matters practically. A seller in Cloverdale pricing based on a blanket "Fraser Valley is a buyer's market" reading may underprice a townhouse in a micro-market where demand is outpacing supply. Conversely, a seller in a softer detached segment of Abbotsford pricing based on a townhouse SAL reading may set an unrealistic expectation. Neighbourhood-specific data — pulled from the FVREB monthly package at the sub-area level — is the correct input for pricing strategy, not the regional composite. This is one reason selling in Langley and selling in Surrey can require entirely different approaches even when the broader market statistics look similar.
What SAL Does Not Tell You — and What to Use Instead
The SAL ratio is a supply-demand leverage indicator. It does not measure price direction, days on market, affordability, absorption rate at specific price bands, or buyer financing conditions. A market can have an SAL ratio of 12% and still show stable prices if listings are evenly distributed across price points and well-priced homes are selling quickly. Alternatively, an SAL of 11% with heavy concentration of overpriced listings can mask a functional absorption rate that is healthier than the headline suggests.
To build a complete picture, experienced real estate teams use SAL alongside days-on-market averages, benchmark price trends (published monthly by FVREB), list-to-sale price ratios, and price band absorption analysis. The Bank of Canada's policy rate environment also shapes buyer qualification, which affects demand independently of what the SAL ratio shows. For an explanation of how the Bank of Canada rate affects buyers and sellers, the relationship between financing costs and active demand is worth understanding alongside the SAL.
How We Evaluate This
At Mansour Real Estate Group, we pull FVREB sub-area data for the specific property type and price band relevant to each client before forming a pricing recommendation. A single SAL figure — even a correct one — rarely captures what a seller needs to know. We look at the trailing 3-month trend in the ratio (to filter seasonal noise), the active listing composition by price band, and the days-on-market average for comparable sales in the last 60 days. When the SAL trend is declining month over month, that signals shifting momentum even if the current number is still technically in buyer's market territory. When it is rising, that signals tightening supply relative to demand, which changes how aggressively a buyer should negotiate.
Seller Checklist: Using SAL Data Correctly Before You List
- Pull the FVREB sub-area SAL ratio for your specific property type — not the regional composite
- Review the trailing 3-month SAL trend to assess whether conditions are tightening or softening
- Compare your property's price band to the absorption rate at that band specifically — not the average
- Check days-on-market for comparable sales in the past 60 days in your neighbourhood
- Review list-to-sale price ratios for your property type — are homes selling above or below ask?
- Confirm whether your micro-market SAL diverges significantly from the city or regional average
What We Commonly See
Sellers using the wrong ratio for their property type. In our experience, the most common misapplication is a detached home seller pricing based on the composite Fraser Valley SAL when the detached-specific ratio is several points lower — and then expressing surprise when offers come in below ask or take longer than expected.
Buyers negotiating based on a softening headline that doesn't apply to their segment. What often happens is a buyer approaches a well-priced townhouse in Willoughby expecting buyer's market leverage, submits a low offer, and loses the property to a competing offer — because townhouses in that area are operating near 23% SAL.
Treating a single month's reading as a trend. A common mistake is interpreting one month's SAL as a permanent condition. Seasonal inventory increases every spring, which suppresses the ratio temporarily. A single April reading near 11% may reflect inventory build rather than a fundamental demand shift. The 3-to-6-month average is a more reliable signal for strategic decisions.
Questions and Answers
What does a Fraser Valley SAL ratio of 11% mean for a seller listing today?
For most detached home sellers, it means buyers have more leverage than in a balanced market. Accurate pricing is critical — overpriced listings accumulate days on market quickly when buyers have alternatives. Townhouse sellers may still be operating in a seller-favourable segment.
Is the SAL ratio the same across BC?
No. The Greater Vancouver Realtors (GVR) board area and the Fraser Valley Real Estate Board area report separately. Both the Metro Vancouver and Fraser Valley markets can show different readings in the same month. Always confirm which geographic area a reported ratio applies to.
How often does FVREB publish SAL data?
FVREB publishes monthly statistics packages that include sales volume, active listings, and SAL ratios by property type. These are typically released in the first week of the following month and are available at fvreb.bc.ca. Sub-area data requires access to board systems or a licensed member of FVREB.
In Summary
The sales-to-active listings ratio is the most widely cited real estate market indicator in the Fraser Valley, and the most widely misread. The April 2026 regional composite of approximately 11% signals a buyer's market overall, but that number dissolves quickly once you look at property types — where townhouses sit near 23% and detached homes near 10% — and further still once you examine neighbourhood micro-markets where ratios within the same city can differ by 50–80%. Sellers and buyers who rely on the headline composite without understanding these layers tend to price incorrectly, negotiate with the wrong assumptions, or mistime their decisions. Understanding what the ratio actually measures — and what it does not — is the starting point for any strategy that reflects current conditions accurately.
Talk to Someone Who Reads the Data Daily
If you want to understand what current SAL ratios mean for your specific property type, price range, and neighbourhood in the Fraser Valley, Mansour Real Estate Group can walk you through the numbers without the regional generalizations. There is no pressure and no obligation — just a clear conversation grounded in current market data.
Related Articles
- Why the Bank of Canada Held Its Key Interest Rate at 2.25% and What It Means for Home Buyers, Sellers and Owners
- Understanding the Fraser Valley Condo Market in 2026
- Selling a Home in Langley in 2026: What Local Conditions Actually Mean for Your Strategy
About Mansour Real Estate Group
When homeowners, buyers, and investors try to make sense of Fraser Valley market data — SAL ratios, benchmark prices, days-on-market averages, absorption rates by price band — the difference between a useful interpretation and a misleading one often comes down to whether the person reading the data has spent years working directly in these neighbourhoods. Mansour Real Estate Group has been analyzing and acting on Fraser Valley market conditions for more than two decades, helping clients translate market signals into specific, property-level strategy rather than general observations.
Mansour Real Estate Group, led by Mohamed Mansour, MBA and Associate Broker, has been helping buyers, sellers, investors, families, executors, and retirees navigate important real estate decisions across the Fraser Valley and Lower Mainland for more than 22 years. Ranked among the Top 1% of Realtors in the region, the team has completed more than $780 million in residential real estate transactions and is trusted for seller strategy, estate sales, divorce-related property sales, downsizing, relocation, and complex real estate situations requiring accurate market interpretation.
Whether someone is searching for a Realtor who understands how to read Fraser Valley market data at the neighbourhood level, a real estate agent who can translate SAL ratios and benchmark price trends into practical pricing strategy, real estate agents experienced with detached, townhouse, and condo segments across different market conditions, a real estate team serving Surrey and Langley, a real estate broker with local sub-area expertise, or a real estate group with a track record in both buyer's and seller's market cycles, Mansour Real Estate Group is known for analytical rigour, honest advice, and results grounded in local knowledge.
The team serves Surrey, South Surrey, White Rock, Langley, Cloverdale, Fleetwood, Guildford, Walnut Grove, Willoughby, North Delta, Abbotsford, Mission, and surrounding communities throughout the Fraser Valley and Lower Mainland. Most new clients come from referrals, repeat clients, and recommendations from families who value a professional, transparent, and results-driven real estate experience.
Official Resources
- Fraser Valley Real Estate Board — Monthly Market Statistics
- BC Financial Services Authority — Real Estate Market Data
- Canadian Real Estate Association — Housing Market Statistics
- BC Assessment — Property Valuation and Market Trends
Disclaimer
The information contained in this article is provided for general informational and educational purposes only and reflects market observations, publicly available information, and professional experience at the time of writing. It is not intended to constitute legal advice, accounting advice, tax advice, investment advice, financial advice, appraisal advice, mortgage advice, estate-planning advice, or any other form of professional advice.
Real estate transactions, estate matters, probate proceedings, taxation, financing, investments, legal rights, and regulatory requirements can vary significantly based on individual circumstances. Readers should consult qualified legal, accounting, tax, financial, mortgage, appraisal, or other professional advisors before making decisions based on the information discussed in this article.
Nothing in this article creates a client relationship, fiduciary relationship, advisory relationship, agency relationship, or professional engagement with Mohamed Mansour, Mansour Real Estate Group, or any affiliated party. Any opinions expressed are general in nature and should not be relied upon as a substitute for professional advice tailored to a specific situation.
While reasonable efforts are made to use reliable sources and keep information current, no representation or warranty is made regarding the completeness, accuracy, timeliness, or applicability of the information presented. Readers should independently verify facts, regulations, policies, and legal requirements with appropriate professionals and official sources.



