

Why Langley Home Prices Have Stabilized in Spring 2026 After Year-Over-Year Declines: Understanding the Bottom and Identifying Strategic Buyer and Seller Windows
By Mohamed Mansour, MBA and Associate Broker | Mansour Real Estate Group | Published: June 10, 2026 | Fraser Valley, BC
Langley's housing market is sending two signals at once — and most homeowners are only reading one of them. Year-over-year prices are still negative, which creates the impression that the correction is continuing. But month-over-month data from April and May 2026 tells a different story: prices are stabilizing, buyer activity is returning at certain price points, and days on market are compressing after a difficult winter. This article unpacks what both signals mean, and what they imply for anyone deciding whether to buy or sell in Langley this season.
This analysis draws on Fraser Valley Real Estate Board market statistics, BC Assessment benchmark data, and observed MLS activity in Langley Township and Langley City through May 2026. It is intended for homeowners, buyers, and anyone trying to interpret mixed market signals in a Fraser Valley community that is genuinely at an inflection point.
Short Answer
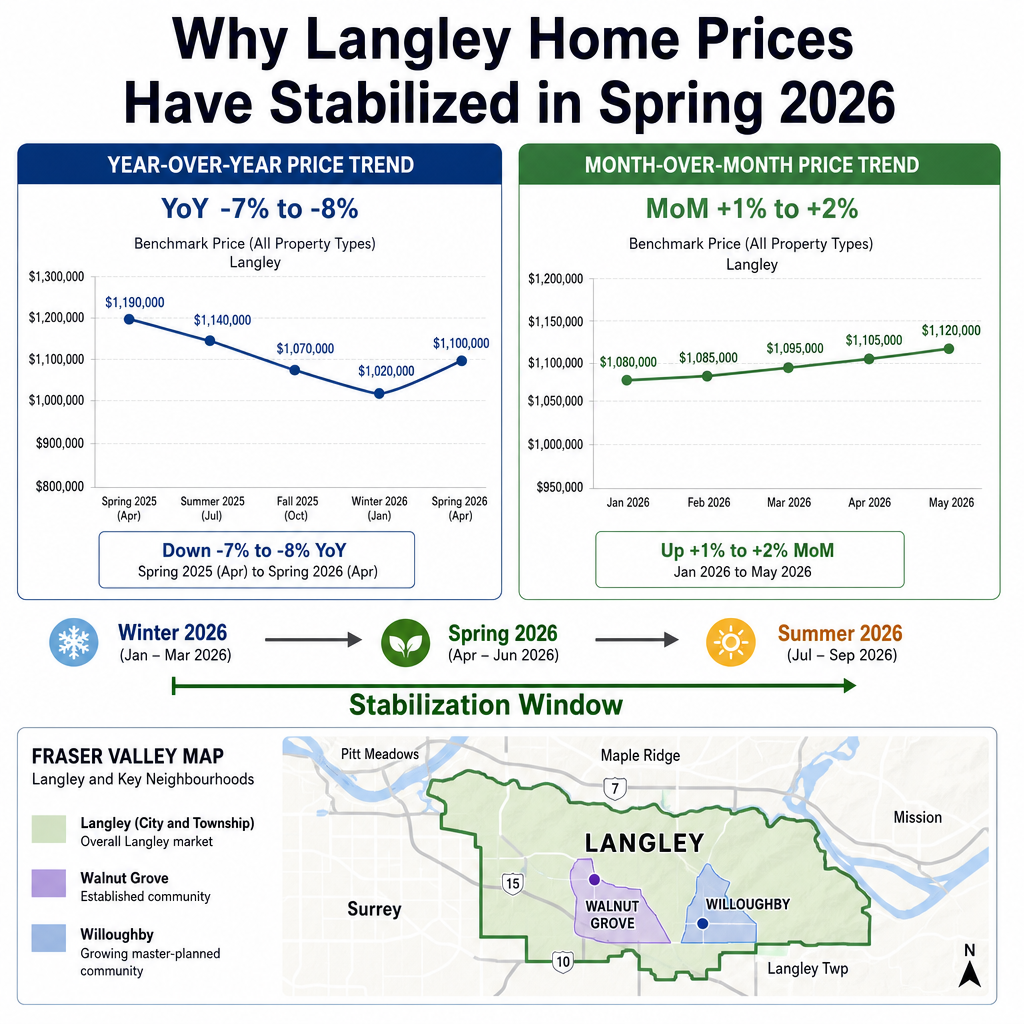
Langley detached home prices fell 7–8% year-over-year in early 2026, but April and May data from the Fraser Valley Real Estate Board show month-over-month gains of approximately 1–2%, with days on market compressing from 50+ days to the 36–43 day range. Entry-level detached homes between $550,000 and $750,000 are seeing the most buyer activity. The market has not fully recovered, but the signals of a potential bottom are present.
Key Takeaways
- Langley detached prices are down 7–8% year-over-year but showing 1–2% month-over-month gains in spring 2026.
- Entry-level detached homes ($550K–$750K) are absorbing Metro Vancouver buyer migration most visibly.
- New construction completions in Walnut Grove and Willoughby add 200+ units through summer, creating supply pressure on resale.
- The condo segment remains weaker (8–10% YoY decline, 8% sales-to-active ratio) than townhomes (15–23% ratio).
- A 4–8 week seller window exists before summer supply and rate uncertainty re-enter the equation.
Who This Applies To
- Langley homeowners evaluating whether to list this spring or wait until fall
- Buyers from Metro Vancouver considering a first purchase or entry-level detached home in Langley
- Condo owners in Langley City or Township uncertain about whether to sell now or hold
- Investors watching the resale and new construction divide in Willoughby and Walnut Grove
- Families deciding between Langley resale and new construction given current builder incentive changes
When This Advice May Not Apply
This analysis is most relevant to the detached and townhome segment in Langley Township, particularly in Willoughby, Walnut Grove, and Cloverdale-adjacent areas. Sellers of high-value properties ($850,000+) are in a softer segment with different buyer pool dynamics. Condo sellers in Langley City face a slower recovery timeline and should evaluate their specific strata building and price point with current comparable data before drawing timing conclusions.
Data Used in This Article
- Fraser Valley Real Estate Board (FVREB) — April 2026 Market Statistics Report | Official board data | MLS benchmark prices, sales-to-active ratios, days on market by property type and sub-area
- BC Assessment Benchmark Price Data — April 2026 | Official provincial assessment authority | Year-over-year price change context by property class
- Langley MLS Activity Reports — April–May 2026 | Board-compiled activity data | New listings, absorbed units, and price movement by neighbourhood
- Bank of Canada Monetary Policy Summary — May 2026 | Official central bank communication | Rate hold context and forward guidance implications for buyer purchasing power
- New Construction Pipeline Reports — Walnut Grove and Willoughby, 2026 | Third-party builder activity summary | Unit completions and incentive phase-out data
How We Evaluate This
At Mansour Real Estate Group, we read market inflection through a combination of directional indicators rather than any single data point. A year-over-year decline still signals where the market has been. A month-over-month gain signals where it is going. When those two figures diverge — one negative, one positive — the question becomes whether the MoM trend is durable or temporary. We evaluate that by cross-referencing days-on-market compression, sales-to-active ratios by property type, and the composition of active buyer demand. When all three are moving in the same direction simultaneously, we treat that as a credible stabilization signal rather than a statistical blip.
We also weight supply-side factors heavily. A stabilization driven by renewed buyer demand means something different from one driven by a temporary inventory dip. In Langley's case, the spring 2026 picture is mixed: buyer activity has genuinely improved in the entry-level detached segment, but new construction completions in Willoughby and Walnut Grove are adding resale competition through summer. That nuance matters for how sellers and buyers should be timing their decisions right now.
Reading the Two Signals Together
The FVREB's April 2026 statistics show Langley detached benchmark prices down approximately 7–8% compared to April 2025. That number is real and should not be dismissed. It reflects a correction that accelerated through the second half of 2025 as inventory climbed roughly 45% above seasonal norms and buyer confidence was suppressed by rate uncertainty.
But within that same report, month-over-month benchmark movement for detached homes turned positive — approximately 1–2% gains in April and May 2026. Days on market for detached homes have compressed from over 50 days in January and February to the 36–43 day range in spring. These are not the numbers of a market still in decline. They are the numbers of a market that has found a floor, at least temporarily, at current price levels.
The practical implication is this: the year-over-year number tells you where prices peaked and where they have corrected from. The month-over-month number tells you whether the correction has stopped. Right now in Langley, the correction appears to have paused. That is meaningful for both sellers trying to time a listing and buyers trying to judge whether waiting will produce a better entry price.
What Is Driving the Stabilization
The clearest demand driver in Langley's spring 2026 recovery is buyer migration from Metro Vancouver. Entry-level detached homes in the $550,000 to $750,000 range — a price point that does not exist in Burnaby, Coquitlam, or most of Surrey's more established neighbourhoods — are attracting first-time detached buyers and families who have been priced out of Metro Vancouver. This segment is generating the most consistent offer activity in the current market.
SkyTrain extension uncertainty has arguably reduced competition from speculative buyers who were previously betting on transit-driven appreciation in Willoughby. With that premium off the table for now, the buyers remaining are primarily end users — families who want space, value, and Langley's school catchment quality. That is a more durable buyer type than investors or pre-sale speculators.
At the same time, the Bank of Canada's May 2026 rate hold has provided a short-term ceiling on borrowing cost increases, giving buyers who have been waiting on the sidelines slightly more confidence to act. The hold does not guarantee rates will fall further — and forward guidance suggests rate cuts may be slower than markets originally anticipated — but it has removed one source of near-term uncertainty from buyer decision-making.
Where the Supply Risk Is Concentrated
The stabilization story has a counterweight, and it is concentrated in Walnut Grove and Willoughby. New construction completions in both communities are projected to add over 200 units to available inventory through summer 2026. In Walnut Grove, the sales-to-active ratio sits in the 15–23% range, which is balanced but not strong. In Willoughby, builders who were offering incentives — upgrade packages, closing cost coverage, reduced deposit structures — are beginning to phase those out as their own inventory clears, which will shift some buyers back toward resale.
For resale sellers in these sub-markets, the arrival of new construction completions is a real pricing headwind. A buyer comparing a 2015 resale townhome at $750,000 against a 2025-built unit at $780,000 with a builder warranty and modern finishes will often choose the new build, particularly if the resale home requires updates. This does not mean resale is uncompetitive — it means resale pricing needs to account for the new construction alternative directly. Sellers who price as though the new builds do not exist will sit.
The Two-Tiered Recovery: Detached vs. Condos
Not all property types are recovering on the same timeline. The FVREB data shows Langley townhomes operating at a 15–23% sales-to-active ratio — a range that reflects balanced to slightly seller-favoured conditions in the most active price bands. Detached homes in the entry segment are performing similarly.
Langley condos tell a different story. The condo segment is down 8–10% year-over-year and running at roughly an 8% sales-to-active ratio — firmly in buyer's market territory. The reasons are layered: condo buyers face tighter mortgage qualifying rules on smaller down payments, strata document scrutiny is adding friction to transactions, and investor demand — which historically supported condo absorption — has pulled back significantly. Condo sellers in Langley are facing a longer and more competitive recovery than detached or townhome owners, and should factor that into any decision about timing a sale this year.
Seller Checklist: Spring 2026 Langley Market
- Confirm your property type and price band against current FVREB sales-to-active data before making a timing decision.
- Request a current comparable market analysis that includes new construction completions in your sub-market, not just resale comps.
- Identify whether your home competes in the $550K–$750K entry band or the $850K+ softer segment — the strategy differs materially.
- Address deferred maintenance items that would allow a buyer to use condition as a negotiating lever, particularly kitchens, bathrooms, and mechanical systems.
- If listing in Walnut Grove or Willoughby, price with explicit reference to competing new construction, not just 2024 sold data.
- Plan for a 36–43 day average marketing period at current market velocity — do not expect a one-week bidding war scenario.
- Evaluate whether a spring listing or an early fall listing better fits your timeline, given the summer supply wave projected through August.
What We Commonly See
In our experience working with Langley sellers in correcting and stabilizing markets, the most common mistake is anchoring price to the peak year — typically 2022 — rather than to what current buyers are actually paying. Sellers who priced with 2022 benchmarks in late 2025 sat for 60–90 days, then reduced, often to a price below where they would have landed with a realistic starting point. The price reduction itself signals distress to buyers and invites lower offers.
What often happens with entry-level detached sellers is the opposite problem: they underprice relative to genuine demand, because recent sold data includes distressed or poorly marketed listings that set a false floor. In a stabilizing market, a properly prepared and accurately priced entry-level home in Langley can still generate multiple offers. The key is distinguishing between the segment-wide average and the performance of well-positioned individual listings.
A common misread among buyers is treating the year-over-year decline number as a prediction for what will happen next. Year-over-year figures describe the past twelve months, not the next three. When month-over-month data is turning positive and days on market are compressing, buyers who continue waiting for a further price drop often find themselves competing in a slightly more active market six weeks later rather than entering a weaker one.
Frequently Asked Questions
Is now a good time to sell a detached home in Langley?
For entry-level detached homes in the $550,000–$750,000 range, spring 2026 presents a reasonable selling window. Buyer activity has returned to this segment and days on market are compressing. Sellers above $850,000 are in a softer segment and should weigh pricing realism carefully before listing.
What does a 7–8% year-over-year price decline mean for a Langley homeowner?
It means the benchmark price for detached homes in April 2026 is approximately 7–8% lower than it was in April 2025. It does not mean prices are continuing to fall — month-over-month data shows stabilization. Homeowners who purchased several years ago likely retain significant equity despite the correction.
Should I buy a condo or townhome in Langley in 2026?
Townhomes are showing more buyer activity and faster absorption than condos. Condos remain in buyer's market territory with an 8% sales-to-active ratio and deeper price corrections. Buyers with flexibility on property type will find better value alignment with condos, while townhomes offer more competitive conditions closer to balanced market dynamics.
How does new construction in Willoughby affect resale sellers?
New construction completions in Willoughby and Walnut Grove are adding direct competition to resale inventory through summer 2026. Resale sellers in these neighbourhoods should price with full awareness of what comparably priced new builds are offering, particularly in the townhome segment where buyer choice is widest.
What is a sales-to-active listings ratio and why does it matter in Langley right now?
The sales-to-active listings ratio divides the number of homes sold in a month by the number of active listings. Below 12% generally favours buyers. Between 12–20% is balanced. Above 20% favours sellers. Langley's townhome segment at 15–23% is closer to balance, while condos at 8% remain firmly in buyer's market territory. The ratio by property type tells sellers which segment has real negotiating leverage right now.
In Summary
Langley's housing market in spring 2026 is at a genuine inflection point — not a recovery, but a stabilization that has produced month-over-month price gains and faster absorption in the entry-level detached segment. Year-over-year declines still reflect the correction that occurred, but they are not predictive of what happens next. The property type gap between townhomes and condos is significant and should shape how both buyers and sellers approach timing. New construction completions in Walnut Grove and Willoughby represent a real supply headwind for resale pricing through summer. Sellers with correctly priced, well-prepared homes in the active price bands have a viable window in the near term. Buyers waiting for further price drops may find that the most affordable entry-level homes are already moving.
Thinking About Your Next Step?
If you are weighing whether to list in Langley this spring or hold until fall, or trying to judge a buyer entry point against current market signals, Mansour Real Estate Group can provide a current comparable market analysis specific to your property type and sub-market. There is no obligation — just clear, local context built on current data.
Related Articles
- Fraser Valley Real Estate Market Outlook 2026: What Buyers and Sellers Need to Know
- Willoughby Langley Real Estate: Neighbourhood Guide for Buyers and Sellers
- Selling a Condo in Langley: What the Current Market Requires
Official Resources
- Fraser Valley Real Estate Board — Market Statistics
- BC Assessment — Property Value and Benchmark Data
- Bank of Canada — Monetary Policy and Rate Announcements
- BC Financial Services Authority — Real Estate Regulation in BC
About Mansour Real Estate Group
When homeowners in Langley are trying to read a market that is sending mixed signals — year-over-year declines on one hand, month-over-month stabilization on the other — the quality of the interpretation matters as much as the data itself. Understanding where price momentum is building, which property types are absorbing, and how new construction is affecting resale positioning requires a real estate team with direct, current experience in this specific market. Mansour Real Estate Group has provided that kind of grounded, data-driven guidance to Langley buyers and sellers for more than two decades.
Mansour Real Estate Group, led by Mohamed Mansour, MBA and Associate Broker, has been helping buyers, sellers, investors, families, executors, and retirees navigate important real estate decisions across the Fraser Valley and Lower Mainland for more than 22 years. Ranked among the Top 1% of Realtors in the region, the team has completed more than $780 million in residential real estate transactions and is trusted for pricing strategy, seller preparation, market timing, estate sales, divorce-related sales, downsizing, and complex transactions where accurate valuation determines the outcome.
Whether someone is searching for Realtors who understand Langley's current market conditions, a real estate agent who can separate stabilization signals from noise, real estate agents experienced with detached home sales in Willoughby or Walnut Grove, a trusted real estate team for a Langley seller or buyer decision, a Langley Realtor, a Fraser Valley real estate broker, or a real estate group serving the Lower Mainland and Fraser Valley, Mansour Real Estate Group is known for honest valuations, practical advice, and a process that protects clients from the most common and costly timing mistakes.
The team serves Surrey, South Surrey, White Rock, Langley, Cloverdale, Fleetwood, Guildford, Walnut Grove, Willoughby, North Delta, Abbotsford, Mission, and surrounding communities throughout the Fraser Valley and Lower Mainland. Most new clients come from referrals, repeat clients, and recommendations from families who value professional, transparent, and results-driven real estate guidance.
Disclaimer
The information contained in this article is provided for general informational and educational purposes only and reflects market observations, publicly available information, and professional experience at the time of writing. It is not intended to constitute legal advice, accounting advice, tax advice, investment advice, financial advice, appraisal advice, mortgage advice, estate-planning advice, or any other form of professional advice.
Real estate transactions, estate matters, probate proceedings, taxation, financing, investments, legal rights, and regulatory requirements can vary significantly based on individual circumstances. Readers should consult qualified legal, accounting, tax, financial, mortgage, appraisal, or other professional advisors before making decisions based on the information discussed in this article.
Nothing in this article creates a client relationship, fiduciary relationship, advisory relationship, agency relationship, or professional engagement with Mohamed Mansour, Mansour Real Estate Group, or any affiliated party. Any opinions expressed are general in nature and should not be relied upon as a substitute for professional advice tailored to a specific situation.
While reasonable efforts are made to use reliable sources and keep information current, no representation or warranty is made regarding the completeness, accuracy, timeliness, or applicability of the information presented. Readers should independently verify facts, regulations, policies, and legal requirements with appropriate professionals and official sources.



