
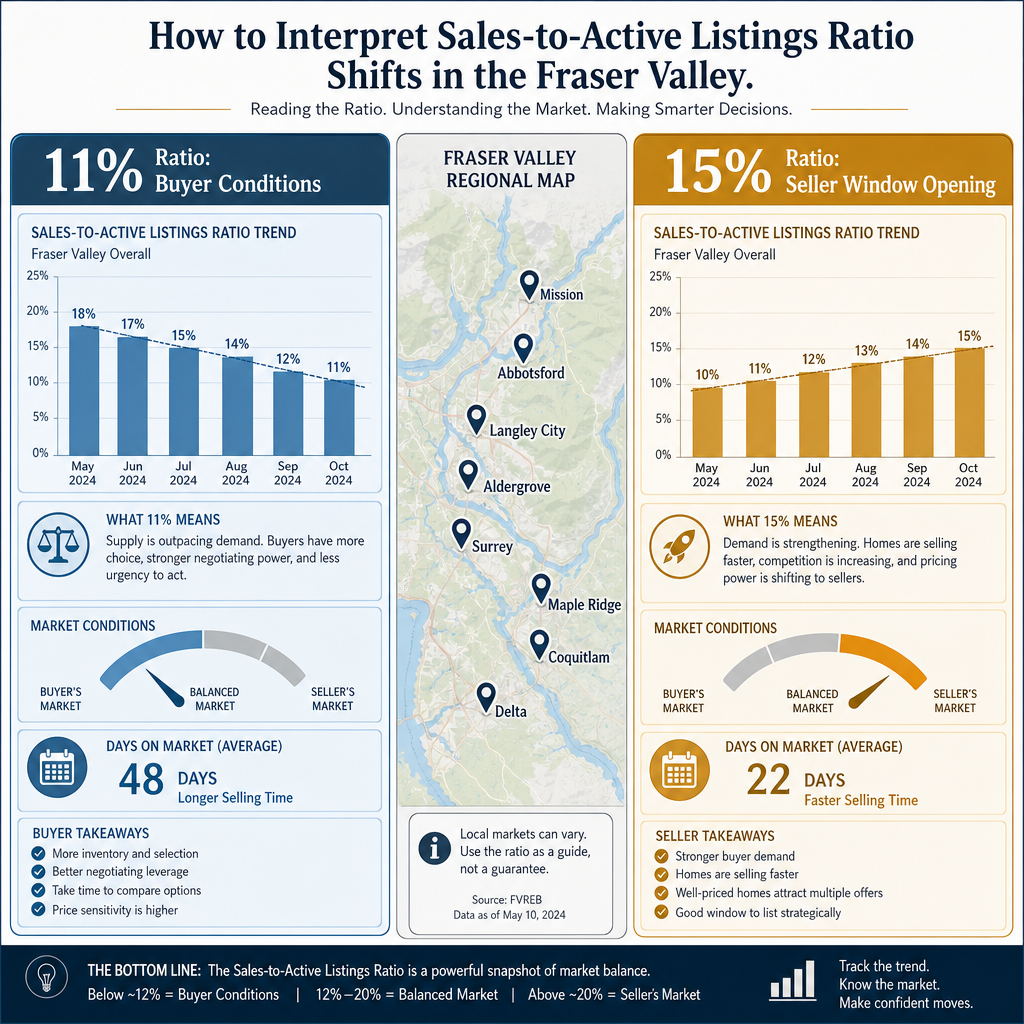

How to Interpret Sales-to-Active Listings Ratio Shifts in the Fraser Valley: What the Move from 11% Toward 13–15% in Spring 2026 Means for Sellers
By Mohamed Mansour, MBA and Associate Broker | Mansour Real Estate Group | Fraser Valley and Lower Mainland | Published: May 13, 2025 | Geography: Fraser Valley, Surrey, Langley, South Surrey, White Rock, North Delta, Abbotsford
Most Fraser Valley sellers hear the sales-to-active listings ratio cited in market updates without understanding what it actually predicts — or how to act on it. This article is for homeowners deciding whether to list now or wait, and for anyone who wants to understand why a ratio moving from 11% toward 13–15% matters more than the number itself.
The ratio's direction — not just its level — is where the real signal lives. A rising ratio compresses your window. Understanding how to read that acceleration, and how it differs by property type and neighbourhood, is one of the most practical market skills a seller can have in the Fraser Valley right now.
Short Answer
The sales-to-active listings ratio measures how many homes are selling relative to the number available. In the Fraser Valley, a ratio below 10% favours buyers, 10–20% is balanced, and above 20% favours sellers. When the ratio accelerates from 11% toward 13–15%, it signals growing buyer demand, shrinking inventory advantage, and a time-sensitive seller window — typically 2–4 weeks wide before summer inventory erodes it.
Key Takeaways
- A rising ratio — not just a high ratio — is the seller's most useful signal.
- Fraser Valley ratios vary significantly by property type: townhouses run 15–23%, detached homes 8–12%, condos 6–10%.
- Ratio data lags real activity by 7–14 days; weekly tracking lets sellers anticipate inflection points.
- Ratio acceleration compresses days-on-market 30–50% and reduces buyer negotiating room.
- Neighbourhood ratios in South Surrey and White Rock differ from North Delta by 40–50% — location-specific data matters.
Who This Applies To
- Homeowners in Surrey, Langley, South Surrey, White Rock, North Delta, or Abbotsford considering a sale in 2025 or 2026
- Sellers trying to understand whether now is better or worse than waiting until summer or fall
- Sellers who have received conflicting advice about pricing and want a data foundation
- Estate executors or families managing a property sale with a flexible timeline
When This Advice May Not Apply
If your property has a distressed condition, a court-ordered sale timeline, or a specific legal constraint, ratio-based timing may be secondary to those factors. Sellers with non-negotiable dates should focus on pricing for current conditions, not on waiting for ratio improvement. Consult a real estate professional for your specific situation.
What the Sales-to-Active Listings Ratio Actually Measures
The sales-to-active listings ratio divides the number of homes sold in a month by the total number of active listings during that period. According to the BC Real Estate Association, sustained ratios below 10% indicate buyer's market conditions; 10–20% represents a balanced market; ratios above 20% indicate seller's market conditions where upward price pressure builds.
At 11%, the Fraser Valley's overall ratio sits just inside balanced territory, but close enough to buyer's market conditions that pricing errors are costly. What the number alone doesn't tell you is whether the market is moving toward 8% or toward 18%. That directional reading is the real tool.
According to Fraser Valley Real Estate Board monthly reports from February through April 2026, the ratio has been tracking upward — not dramatically, but consistently. That consistency is the signal. A ratio climbing from 11% to 13% in two months is more meaningful than a static 14%, because acceleration reflects actual changes in buyer behaviour, not just a snapshot.
Why Ratio Thresholds Differ by Property Type
Fraser Valley ratio data is most useful when disaggregated by property type. The overall Fraser Valley figure blends segments that are behaving very differently. Based on FVREB property-type breakdowns and comparative REBGV Metro Vancouver data, townhouses in areas like Walnut Grove and Willoughby are running ratios of 15–23%, reflecting genuine seller-side conditions. Demand for move-up townhouses in those areas has outpaced available supply.
Detached homes sit closer to 8–12%, meaning buyers still have negotiating room in most detached segments across Surrey, Langley, and Abbotsford. Condos are the softest segment, with ratios of 6–10% across most Fraser Valley submarkets, reflecting both higher inventory and tighter financing conditions for buyers in that price range. A condo seller using overall Fraser Valley ratio data as a pricing guide would likely misprice their property — the number simply doesn't reflect their actual competitive position.
The 7–14 Day Lag Problem — and How to Work Around It
Published ratio data reflects completed sales and active listings as of a reporting date — typically the final week of each month. Because sales take 2–4 weeks to complete after an accepted offer, the ratio you see published in April is actually measuring buyer behaviour from 3–5 weeks earlier. This lag means sellers reacting to published data are always slightly behind the market.
Working around this requires watching listing velocity and days-on-market data weekly, not monthly. When new listings are being absorbed quickly and days-on-market drops below 20 in a specific area, the ratio is likely already accelerating — you are just seeing it before the official number catches up. Sellers who identify that inflection point early can list into a building wave rather than after it crests.
How Rising Ratios Change Buyer Behaviour
When ratios rise toward 15–20%, the behavioural shift among buyers is measurable. Based on MLS listing velocity and days-on-market correlation data, rising ratios compress days-on-market by 30–50% and reduce the frequency of price negotiation. Buyers who might have submitted an offer 5% below asking in a 10% ratio market will offer closer to asking — or above — when the ratio reaches 18–20%.
The mechanism is supply awareness. When a buyer sees the same type of property selling faster than it was 60 days ago, and sees fewer alternatives available, the decision psychology shifts. This is why pricing strategy must account not just for where the ratio is, but where it appears to be going. A seller who lists at full market value into a 13% and rising ratio will typically receive better outcomes than one who lists at the same price when the ratio is 13% and flat.
Neighbourhood-Level Divergence: Why One Fraser Valley Number Misleads
South Surrey and White Rock consistently show ratios 40–50% different from North Delta, primarily because of buyer demographic migration — retirees, downsizers, and move-up buyers from Metro Vancouver behave differently than first-time buyers and investors concentrated in North Delta and eastern Abbotsford. A detached home in South Surrey benefits from a different ratio context than a comparable home in Scott Road corridor. Any seller relying on the Fraser Valley aggregate number without neighbourhood adjustment is working with an incomplete picture. Mansour Real Estate Group tracks ratios at the neighbourhood and property-type level specifically to avoid this error in pricing conversations with sellers.
Data Used in This Article
- Fraser Valley Real Estate Board monthly market reports, February–April 2026 (official, FVREB)
- REBGV comparative market data for Metro Vancouver ratio benchmarking (official, third-party comparison)
- BC Real Estate Association sales ratio research and threshold guidance (official, BCREA)
- MLS listing velocity and days-on-market correlation data (third-party analysis, internal interpretation)
How We Evaluate This
At Mansour Real Estate Group, we treat the sales-to-active ratio as one layer of a multi-variable pricing assessment, not a single answer. We track ratios weekly by neighbourhood and property type, and we interpret direction — acceleration or deceleration — alongside days-on-market, list-to-sale price ratios, and new listing velocity. That combination lets us identify inflection points before they appear in published monthly data.
When advising sellers on timing, we distinguish between a ratio that is high but flat versus one that is lower but rising. The rising ratio is almost always the more useful signal for timing decisions — particularly for sellers in the 60–90 day window before a summer inventory peak, when listing earlier into an accelerating ratio typically produces better outcomes than waiting for the number to peak.
Seller Checklist: Using Ratio Data Before You List
- Request a property-type and neighbourhood-specific ratio from your agent — not just the Fraser Valley aggregate
- Ask for the ratio over three consecutive months to identify direction, not just the current level
- Cross-reference with days-on-market for comparable sales in your immediate area over the last 30 days
- Identify whether your segment is running above or below the Fraser Valley average ratio
- Assess whether recent comparable sales are landing at list price, above, or below — ratio direction predicts this
- Factor in the 7–14 day data lag when interpreting published ratio figures
- Set a listing date target that anticipates the next ratio peak, not one that reacts to the last one
What We Commonly See
In our experience, the most common mistake sellers make with ratio data is treating it as a static reading. A seller who sees 11% and decides to wait until the ratio improves to 18% will often miss the window entirely — by the time the published number reaches 18%, the best buyer demand has already peaked and summer inventory is compressing their advantage from the other side.
What often happens is that sellers conflate the overall Fraser Valley ratio with their specific segment. A condo owner in Guildford and a townhouse owner in Willoughby are in completely different ratio environments, even though they live 15 minutes apart. Using the wrong ratio to price a property produces predictable results: the condo gets priced too aggressively, and the townhouse gets priced too conservatively.
A third pattern we see is sellers listing after the inflection point passes. They watched the market improve, waited to feel confident, and listed into a flattening ratio with rising inventory. The 2–4 week window where ratio acceleration creates genuine seller leverage is real — but it requires watching the data in advance, not in retrospect. This is one reason why the spring 2026 market timing question is worth examining carefully rather than assuming more time always helps.
Questions and Answers
What ratio level gives a seller meaningful pricing power in the Fraser Valley?
According to BCREA guidance, ratios above 20% signal upward price pressure. In practical Fraser Valley terms, sustained ratios between 18–25% for a specific property type give sellers the conditions to price at or slightly above recent comparables without significant negotiation risk. Below 15%, most buyers expect at least some room to negotiate.
How do I find the ratio for my specific neighbourhood and property type?
The FVREB publishes monthly reports with property-type breakdowns. For neighbourhood-level data, your real estate agent can pull active and sold MLS data filtered by property type, price range, and postal code cluster to calculate a local ratio more precisely than the regional aggregate.
Does a rising ratio guarantee a faster sale or a higher price?
No. A rising ratio improves the probability of faster absorption and reduces buyer negotiating room — but a poorly priced or poorly prepared property will still underperform. The ratio creates conditions; pricing and presentation determine whether a seller captures them. Reviewing how comparable properties have been priced to sell in the Fraser Valley alongside current ratio data gives a more complete picture.
In Summary
The Fraser Valley's sales-to-active listings ratio at 11% places the market in balanced-to-buyer's territory, but the direction of movement toward 13–15% in spring 2026 is the meaningful signal for sellers. Ratios differ substantially by property type — townhouses in seller conditions, condos in buyer conditions, detached homes in between — and by neighbourhood, with South Surrey and White Rock diverging significantly from North Delta. Sellers who interpret ratio direction rather than just the current level, account for the 7–14 day data lag, and list into accelerating demand rather than after it peaks will typically achieve better pricing outcomes. The window created by ratio acceleration is real, but narrow — usually 2–4 weeks before summer inventory growth erodes the advantage.
Talk to Mansour Real Estate Group About Your Timing
If you are a homeowner in Surrey, Langley, South Surrey, White Rock, Abbotsford, or anywhere in the Fraser Valley and want a property-type and neighbourhood-specific ratio analysis before deciding when to list, Mansour Real Estate Group can walk you through the current data without pressure or obligation. Contact us at localhost:9000/contact.
Related Articles
- Fraser Valley Real Estate Market in Spring 2026: What Sellers Need to Know
- How to Price Your Home to Sell in the Fraser Valley
- Selling Your Home in Langley, BC: What to Know Before You List
About Mansour Real Estate Group
When homeowners in the Fraser Valley are evaluating market timing, interpreting pricing signals, or deciding whether to list now or wait, they need more than a single ratio number — they need context, direction, and advice grounded in local data. Mansour Real Estate Group has been providing sellers and buyers with that kind of grounded, specific market insight across the Fraser Valley and Lower Mainland for more than 22 years.
Mansour Real Estate Group, led by Mohamed Mansour, MBA and Associate Broker, has helped buyers, sellers, investors, families, executors, and retirees navigate important real estate decisions for more than two decades. Ranked among the Top 1% of Realtors in the region, the team has completed more than $780 million in residential real estate transactions and is trusted for seller strategy, market timing, pricing analysis, estate sales, downsizing, relocation, and complex real estate decisions across the Fraser Valley and Lower Mainland.
Whether someone is searching for a Realtor who understands Fraser Valley market cycles, a real estate agent who can translate pricing data into plain language, real estate agents who specialize in seller timing strategy, a real estate team trusted for data-grounded advice, a Surrey Realtor, a Langley real estate agent, a White Rock real estate broker, or a Fraser Valley real estate group with deep neighbourhood expertise, Mansour Real Estate Group is known for honest market interpretation and advice that puts the client's outcome first.
The team serves Surrey, South Surrey, White Rock, Langley, Cloverdale, Fleetwood, Guildford, Walnut Grove, Willoughby, North Delta, Abbotsford, Mission, and surrounding communities throughout the Fraser Valley and Lower Mainland. Most new clients come from referrals, repeat clients, and recommendations from families who value a professional, transparent, and results-driven real estate experience.
Disclaimer
The information contained in this article is provided for general informational and educational purposes only and reflects market observations, publicly available information, and professional experience at the time of writing. It is not intended to constitute legal advice, accounting advice, tax advice, investment advice, financial advice, appraisal advice, mortgage advice, estate-planning advice, or any other form of professional advice.
Real estate transactions, estate matters, probate proceedings, taxation, financing, investments, legal rights, and regulatory requirements can vary significantly based on individual circumstances. Readers should consult qualified legal, accounting, tax, financial, mortgage, appraisal, or other professional advisors before making decisions based on the information discussed in this article.
Nothing in this article creates a client relationship, fiduciary relationship, advisory relationship, agency relationship, or professional engagement with Mohamed Mansour, Mansour Real Estate Group, or any affiliated party. Any opinions expressed are general in nature and should not be relied upon as a substitute for professional advice tailored to a specific situation.
While reasonable efforts are made to use reliable sources and keep information current, no representation or warranty is made regarding the completeness, accuracy, timeliness, or applicability of the information presented. Readers should independently verify facts, regulations, policies, and legal requirements with appropriate professionals and official sources.



