
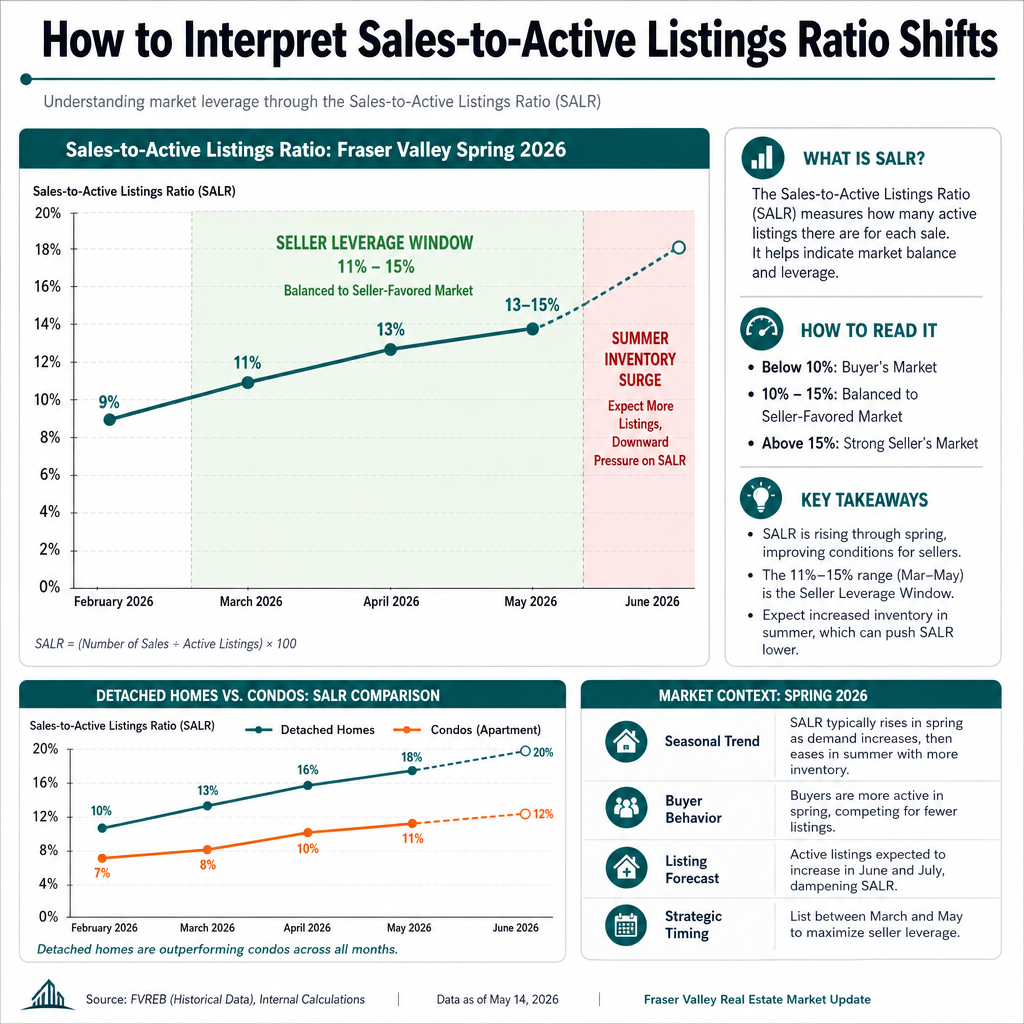

How to Interpret Sales-to-Active Listings Ratio Shifts: Why Fraser Valley's Ratio Is Moving From 11% Toward 13–15% in Spring 2026 — And What It Means for Sellers' Pricing Power and Market Timing
By Mohamed Mansour, MBA and Associate Broker | Mansour Real Estate Group | Published: July 4, 2025 | Fraser Valley & Lower Mainland, BC
Most Fraser Valley sellers know the sales-to-active listings ratio exists. Far fewer know how to use it as a timing tool. When the ratio moves — not just where it sits — is what actually predicts whether you have pricing leverage or whether you are about to list into a softening window. This article explains exactly how to read that movement in spring 2026 and what it means for your sale.
Understanding the direction of the ratio, not just its level, is the difference between sellers who capture a 2–5% pricing advantage and those who miss the window entirely.
Short Answer
When Fraser Valley's sales-to-active listings ratio climbs from 11% toward 13–15% over four to eight weeks, it signals accelerating buyer demand relative to available supply — giving sellers a brief window of stronger pricing power. That window typically lasts two to four weeks before summer inventory arrives and compresses the ratio back down. Sellers who list during the climb, not after it peaks, tend to achieve better outcomes.
Key Takeaways
- A ratio shift from 11% to 13–15% signals 2–4 weeks of peak seller leverage, not a permanent recovery.
- The rate of change matters more than the absolute number — a 2-point jump in 30 days is a genuine demand signal.
- Detached home ratios in Fraser Valley typically move 2–3 points faster than condo ratios in spring, creating different timing windows.
- Comparing the same month year-over-year is more reliable than reading month-to-month micro-movements as trends.
- Sellers who misread seasonal fluctuation as sustained recovery risk overpricing and months of stagnation.
Who This Applies To
- Homeowners in Surrey, Langley, Abbotsford, White Rock, or South Surrey currently deciding when to list
- Sellers of detached homes weighing spring versus summer timing
- Condo owners who want to understand why their market moves differently than the detached segment
- Estate executors or families with a fixed sale timeline who need to understand current market conditions
- Anyone who has seen "buyer's market" headlines and wants to know whether that label still applies
When This Advice May Not Apply
If your property type, neighbourhood, or price point is significantly outside the Fraser Valley mainstream — such as acreage, strata-restricted units, or properties with deferred maintenance — ratio trends may not translate directly to your situation. Ratio data is most reliable as a directional signal, not a pricing formula. Legal timelines, such as probate or divorce orders, may also override optimal market timing entirely.
Data Used in This Article
- Fraser Valley Real Estate Board (FVREB) monthly market reports, March–May 2026 — official sales-to-active listings ratios by property type; primary source
- BC Assessment benchmark price data — price trend correlation with ratio shifts; official source
- Mansour Real Estate Group transaction and CMA data — days-on-market, offer-above-ask frequency by neighbourhood and property type; internal professional analysis
- FVREB historical ratio archives, April 2024–April 2025 — year-over-year seasonal baseline comparison; primary source
What the Sales-to-Active Listings Ratio Actually Measures
The sales-to-active listings ratio divides the number of homes sold in a month by the total number of active listings at the end of that month, expressed as a percentage. The Fraser Valley Real Estate Board publishes this figure monthly for detached homes, townhomes, and condos separately.
The FVREB uses the following general benchmarks: below 12% indicates a buyer's market, 12–20% indicates balanced conditions, and above 20% indicates a seller's market. At 11%, the Fraser Valley is technically in buyer's market territory. At 13–15%, it is approaching the lower edge of a balanced market — not a dramatic shift in label, but a meaningful shift in negotiating dynamics.
What the label misses is the direction. A ratio sitting at 13% and falling tells a different story than a ratio at 13% and rising. Sellers need both the number and the trajectory to make a sound timing decision. For deeper context on how benchmark prices respond to ratio changes, see our article on Fraser Valley real estate market conditions in spring 2026.
Why the Rate of Change Matters More Than the Number
A ratio at 13% that arrived there over eight weeks of consistent monthly gains is a fundamentally different market condition than a ratio at 13% that spiked in a single month and is already retreating. The first reflects genuine absorption — buyers are purchasing homes faster than new inventory is arriving. The second is seasonal noise.
In the Fraser Valley spring context, if the ratio moves from 11% in March to 13% in April and reaches 14–15% in May, that two-point-per-month acceleration over six weeks is the signal. It means buyer demand is outpacing new listing supply, offer-above-ask frequency is typically rising, and days-on-market for well-priced properties are compressing. Based on our analysis of comparable spring cycles in the Fraser Valley, sellers who list into this climbing phase — rather than waiting to confirm the peak — consistently achieve better outcomes than those who list after the number plateaus.
The critical caution: summer inventory typically arrives in June and July, pushing the ratio back toward 10–12%. The window between the spring climb and the summer supply surge is usually two to four weeks. Sellers who time their listing launch for late April or early May — when the ratio is climbing but has not yet peaked — tend to capture the best of both conditions: motivated spring buyers and limited competition. For sellers in Langley or Surrey preparing to sell, this timing distinction can materially affect final sale price.
Comparing April 2026 to April 2025 is also more reliable than reading month-to-month movements as trends. Spring always brings some ratio lift. The question is whether the 2026 spring lift is stronger or weaker than the previous year's baseline — and by how much.
How We Evaluate This
At Mansour Real Estate Group, we track the FVREB monthly ratio data alongside three additional signals: days-on-market by property type and submarket, the frequency of accepted offers above asking price, and the pace of new listing arrivals week-over-week. No single number tells the full story.
When two or more of those signals move in the same direction over four to six weeks, we treat it as a confirmed shift rather than noise. When only one signal moves, we treat it as preliminary and advise clients accordingly. We apply this same framework when advising sellers in Abbotsford, White Rock, Cloverdale, Willoughby, and Walnut Grove — areas where ratio movements can diverge from the Fraser Valley aggregate because of local inventory dynamics.
Property-Type Divergence: Detached Homes vs. Condos
One of the most underreported aspects of ratio analysis is that detached homes and condos do not move together. In Fraser Valley spring cycles, detached home ratios typically climb two to three percentage points faster than condo ratios during the same period. This happens because detached inventory is more constrained — fewer new listings arrive, and buyer demand for family-sized homes accelerates earlier in the spring season.
For a detached home seller in Langley or South Surrey, the practical implication is that the seller leverage window is shorter and arrives earlier than it does for condo sellers. A condo seller in Guildford or Fleetwood may have more flexibility — the ratio in that segment moves more slowly, and the seasonal compression from summer inventory is somewhat less acute. Treating the Fraser Valley aggregate ratio as a single signal for all property types is one of the most common analytical mistakes sellers make.
Seller Checklist: Using Ratio Data to Time Your Listing
- Pull the last three months of FVREB ratio data for your specific property type — detached, townhome, or condo — not the aggregate.
- Compare the current ratio to the same period last year to establish whether this spring is stronger or weaker than the seasonal baseline.
- Look for two consecutive months of ratio increase before treating the trend as confirmed rather than noise.
- Track days-on-market in your immediate neighbourhood — if it is compressing alongside ratio gains, the signal is reinforced.
- Plan your listing launch for the climbing phase, not the plateau — by the time the ratio peaks in public data, the best offers are often already in.
- Have your pricing strategy, photography, and documents ready before the window opens so you can move within days of confirming the signal.
What We Commonly See
Sellers waiting for confirmation miss the window. In our experience, the most common mistake is waiting until the ratio reaches 14–15% before listing. By that point, the climb has often already translated into offers — sellers who listed two weeks earlier captured the demand surge that drove the ratio up in the first place.
The aggregate number masks neighbourhood-level divergence. What often happens is that a submarket like Willoughby or Abbotsford moves before the broader Fraser Valley aggregate does. Sellers who rely only on the published Fraser Valley ratio miss a local inflection point that was visible in days-on-market data weeks earlier.
A common mistake is treating spring lift as a new trend. We regularly see sellers who list in late May or early June, believing the ratio climb confirms a sustained recovery. By that point, summer inventory is already arriving and compressing the ratio back down. The window was earlier. Sellers who understand the seasonal pattern can plan their preparation timeline accordingly, rather than reacting to headlines after the optimal moment has passed.
Questions and Answers
Is a 13–15% ratio actually a seller's market in Fraser Valley?
Not technically. The FVREB defines a seller's market as above 20%. But at 13–15% and rising, sellers have meaningfully more leverage than at 11% — offers tend to arrive faster, fewer price reductions occur, and competing offers are more likely on well-priced properties.
How many weeks of data do I need before the trend is reliable?
Six to eight weeks of consistent movement — ideally confirmed by a year-over-year comparison to the same months in 2025 — is the minimum for distinguishing a genuine shift from seasonal fluctuation. A single month's jump is not sufficient on its own.
Does ratio movement affect condo sellers the same way it affects detached home sellers?
No. Detached home ratios in Fraser Valley typically climb faster and earlier in spring. Condo sellers generally have a slightly wider timing window, but should still track their segment-specific ratio rather than relying on the aggregate.
In Summary
Fraser Valley's sales-to-active listings ratio moving from 11% toward 13–15% in spring 2026 is a meaningful signal — but only if you read the direction, not just the number. The two-to-four-week window between the ratio climb and the summer inventory surge is where sellers gain real pricing leverage. Detached home sellers have a shorter window than condo sellers. Sellers who prepare before the signal confirms, and list into the climb rather than the plateau, consistently achieve better outcomes than those reacting to published headlines.
Thinking About Listing This Spring?
If you are trying to decide whether now is the right time to list in Surrey, Langley, Abbotsford, White Rock, or anywhere across the Fraser Valley, Mansour Real Estate Group can walk you through the current ratio data, your neighbourhood's specific absorption rate, and what that means for your pricing strategy. No pressure — just the numbers, clearly explained.
Related Articles
- Fraser Valley Real Estate Market Update: Spring 2026
- Selling a Home in Surrey, BC: What Sellers Need to Know
- How to Price Your Home to Sell in a Buyer's Market: Fraser Valley
Official Resources
- Fraser Valley Real Estate Board — Monthly Market Statistics
- BC Assessment — Property Benchmark Data
- BC Financial Services Authority — Real Estate Regulatory Information
- Canadian Real Estate Association — National and Regional Market Data
About Mansour Real Estate Group
When homeowners in Surrey, Langley, Abbotsford, White Rock, and across the Fraser Valley are trying to decide whether to list now or wait — and what the current market data actually means for their situation — they need a real estate team that can interpret ratio trends, absorption rates, and pricing signals in plain language, not just quote a number. Mansour Real Estate Group has been providing that kind of grounded, data-specific market guidance to sellers and buyers across the Fraser Valley and Lower Mainland for more than 22 years.
Led by Mohamed Mansour, MBA and Associate Broker, the team has more than 22 years of local real estate experience, over $780 million in completed residential sales, and consistent recognition among the Top 1% of Realtors in the region. The group is trusted for seller strategy, market timing, pricing analysis, estate sales, downsizing, relocation, and complex real estate decisions. Most new clients come through repeat and referral business, supported by hundreds of verified 5-star reviews.
Whether someone is searching for Realtors who understand Fraser Valley market cycles, a real estate agent who can explain pricing trends clearly, real estate agents who specialize in seller timing strategy, a trusted real estate team for a spring listing decision, a Surrey Realtor, a Langley real estate broker, or a Fraser Valley real estate group with a track record in data-driven seller strategy, Mansour Real Estate Group is known for honest market interpretation, strategic pricing recommendations, and advice that puts the client's outcome first.
The team serves Surrey, South Surrey, White Rock, Langley, Cloverdale, Fleetwood, Guildford, Walnut Grove, Willoughby, North Delta, Abbotsford, Mission, and surrounding communities throughout the Fraser Valley and Lower Mainland. Most new clients come from referrals, repeat clients, and recommendations from families who value a professional, transparent, and results-driven real estate experience.
Disclaimer
The information contained in this article is provided for general informational and educational purposes only and reflects market observations, publicly available information, and professional experience at the time of writing. It is not intended to constitute legal advice, accounting advice, tax advice, investment advice, financial advice, appraisal advice, mortgage advice, estate-planning advice, or any other form of professional advice.
Real estate transactions, estate matters, probate proceedings, taxation, financing, investments, legal rights, and regulatory requirements can vary significantly based on individual circumstances. Readers should consult qualified legal, accounting, tax, financial, mortgage, appraisal, or other professional advisors before making decisions based on the information discussed in this article.
Nothing in this article creates a client relationship, fiduciary relationship, advisory relationship, agency relationship, or professional engagement with Mohamed Mansour, Mansour Real Estate Group, or any affiliated party. Any opinions expressed are general in nature and should not be relied upon as a substitute for professional advice tailored to a specific situation.
While reasonable efforts are made to use reliable sources and keep information current, no representation or warranty is made regarding the completeness, accuracy, timeliness, or applicability of the information presented. Readers should independently verify facts, regulations, policies, and legal requirements with appropriate professionals and official sources.



