

Langley Days-on-Market Trends by Property Type and Neighbourhood 2026: Why DOM Variance Reveals True Buyer Demand and How to Price Your Property to Match Market Velocity
By Mohamed Mansour, MBA and Associate Broker · Mansour Real Estate Group · Fraser Valley and Lower Mainland · Published June 2026
If you are preparing to sell a home in Langley, the number most worth understanding is not the benchmark price. It is days-on-market — and more specifically, how that number changes from one neighbourhood to the next, and from one property type to another. In 2026, the gap between the fastest and slowest segments in Langley exceeds fifty days. That gap does not reflect the quality of the homes. It reflects whether the pricing strategy matched where buyers are actually concentrating their demand.
This guide breaks down DOM patterns by property type and by the key neighbourhood clusters where Langley sellers are making decisions right now: Walnut Grove, Willoughby, Willowbrook, Murrayville, and the City of Langley core.
Short Answer
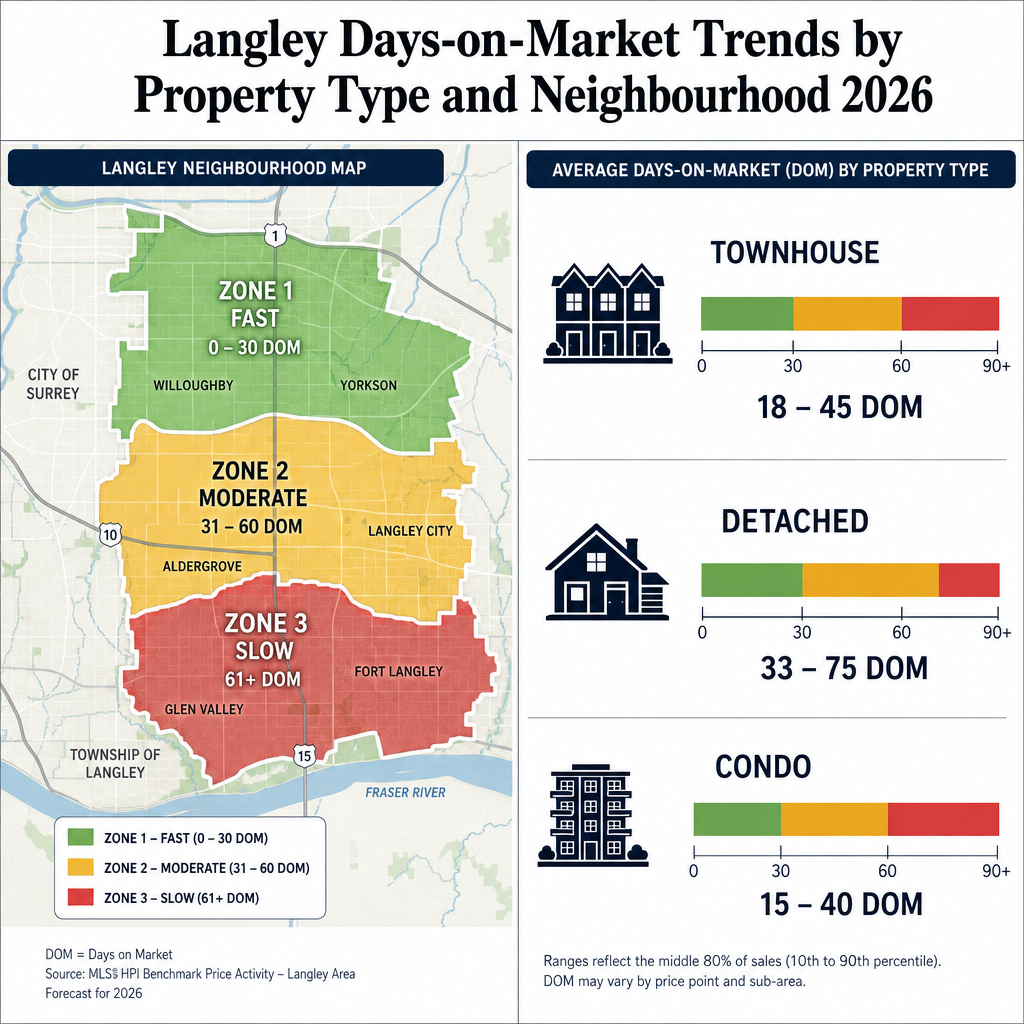
In Langley's 2026 market, townhouses in Walnut Grove and Willoughby are selling in 25–35 days, detached homes average 36–43 days city-wide but range from 20 to 60-plus depending on neighbourhood and price anchoring, and condos in Willowbrook are sitting 40–50 days due to new supply competition. Sellers who price against neighbourhood-specific DOM data rather than municipal averages consistently sell faster and protect more equity.
Key Takeaways
- Langley townhouses in Walnut Grove and Willoughby average 25–35 days on market in 2026.
- Detached homes range from 20 to 60-plus days depending on micro-neighbourhood and price alignment.
- Willowbrook condos face 40–50 day timelines driven by new supply and builder incentive phase-out.
- Township versus City of Langley buyer behaviour diverges significantly across price bands and property types.
- Neighbourhood-specific DOM benchmarks improve net proceeds by 5–8% compared to city-wide pricing.
Who This Applies To
- Homeowners preparing to list a detached, townhouse, or condo property in the Township or City of Langley
- Sellers whose listings have already expired or stalled and are reassessing pricing strategy
- Estate executors managing a Langley property sale within a defined timeline
- Investors tracking Langley resale velocity before deciding to list or hold
When This Advice May Not Apply
Rural acreage properties and equestrian estates in the Township follow different absorption patterns not captured in standard DOM benchmarks. Sellers in those segments should request a separate analysis. Properties priced above $2.5 million also face a thinner buyer pool where DOM comparisons against the broader market become unreliable guides.
Data Used in This Article
- Fraser Valley Real Estate Board (FVREB): Market statistics April–May 2026 · Official board data · Fraser Valley geography
- MLS Sold Data: Langley property type segmentation · Third-party transaction records · April–May 2026
- BC Assessment: Benchmark price volatility by Langley district · Official assessment authority · 2026 roll
- Mansour Real Estate Group transaction velocity analysis: Internal analysis of Langley listing and sold timelines · Professional interpretation
How We Evaluate This
When a seller asks how long their property will take to sell, a single municipal average does not answer that question. Our analysis segments Langley DOM data by property type first, then by neighbourhood cluster, then by price band. That three-layer approach reveals where buyer demand is concentrated, which segments have excess supply, and where pricing misalignment is creating artificial delays. The result is a pricing recommendation anchored to what is actually moving in the seller's specific sub-market, not what the municipality reported last month.
We cross-reference FVREB board data with MLS sold records and our own transaction history in Langley to separate genuine market velocity from listing churn — properties that technically re-listed at a lower price and reset their DOM counter. That distinction matters because it prevents sellers from anchoring their expectations to comparables that were never truly competitive.
Townhouses in Walnut Grove and Willoughby: The Fastest-Moving Segment
According to FVREB April–May 2026 data and MLS sold records, townhouses in Walnut Grove and Willoughby are averaging 25–35 days on market, with sales-to-active ratios in the 15–23% range. This reflects consistent demand from buyers migrating out of Metro Vancouver who are seeking more space at a price point that remains accessible relative to Burnaby or Coquitlam equivalents.
Within Willoughby, the tightest sub-segments are townhouses priced between $750,000 and $950,000. Properties in school-catchment-preferred zones — particularly those feeding into newer Township schools — are receiving offers closer to 10–18 days. Sellers who anchor their list price above $970,000 without a clear feature justification are seeing DOM stretch toward 40 days or longer, even in this otherwise active segment.
In Walnut Grove, the dynamic is similar but slightly more compressed in the $700,000–$850,000 range. The key pricing discipline here is avoiding the temptation to match list prices from six months ago, when inventory was thinner and buyer competition was higher. Current buyers in this zone are informed, often pre-approved, and quick to bypass listings priced even 4–5% above comparable sold data.
Detached Homes: The Widest DOM Range in Langley
The detached segment shows the most variance in the Langley market. The city-wide average from FVREB data sits at approximately 36–43 days, but that number conceals a range from 20 days for well-priced homes in desirable City of Langley locations to 60-plus days for rural Township listings with pricing misalignment or condition issues.
In Murrayville and the established areas of the City of Langley, detached homes priced within 2–3% of current comparable sold data are moving in 20–30 days. These are typically buyers who have already sold or are buying without a subject-to-sale condition, and they are moving quickly when the price is right. The same property listed 8–10% above the comparable range will sit. In our experience, listings that go stale past 45 days in this segment rarely recover without a meaningful price adjustment — and by that point, buyer skepticism about the property has already set in.
In rural Township pockets — areas with acreage components or older homes on larger lots — DOM averages 45–55 days according to our transaction velocity analysis. The buyer pool is narrower, financing can be more complex, and buyers often require additional due diligence time. Sellers in this segment who price against urban Township comparables are consistently disappointed. The correct comparable set requires filtering by lot size, zoning, and access — not just postal code.
Condos in Willowbrook: The Slowest Segment and Why It Matters
Condos in the Willowbrook and central Langley corridor are experiencing the longest DOM in the municipality, averaging 40–50 days in April–May 2026 based on FVREB and MLS sold data. The primary driver is supply-side pressure: new strata completions have added competing inventory, and the phase-out of builder incentive programs has left resale sellers competing against developer units without the advantage of incentive packages or price reductions buyers were accustomed to seeing from builders.
The practical consequence for resale condo sellers is a buyer pool that is more cautious, more likely to request extended subject periods, and more likely to encounter financing obstacles tied to appraisal gaps. When a condo is listed above recent comparable sales, the appraisal often comes in short, the financing is delayed or declined, and the DOM extends further. Sellers in this segment who price at or just below the most recent comparable sold data are reducing that financing risk for the buyer and compressing their own time-to-sale. This is not a concession — it is a structural reality of the current Willowbrook condo market.
Seller Checklist
- Request a neighbourhood-specific DOM analysis for your property type — not a municipal average
- Identify the active price band with the highest buyer concentration in your segment
- Review comparable sold data from the last 60 days only — data older than 90 days is unreliable in a shifting market
- For condos, confirm strata documentation is current and depreciation report is available before listing
- For detached Township properties, confirm zoning and lot size comparables match — not just neighbourhood boundary
- Set a price review trigger at day 21 if no accepted offer — do not wait for 45 days to act
What We Commonly See
Sellers anchoring to list price, not sold price. In our experience, the most common pricing mistake in Langley right now is using neighbouring list prices — not sold prices — as the reference point. Active listings in a slower market do not reflect what buyers are willing to pay. They reflect what sellers are hoping to get. The sold data tells the real story.
DOM counter resets masking true market time. What often happens is a seller relists after reducing the price, resetting the DOM counter on MLS. A property that shows 12 days on its current listing may have spent 55 days on a prior listing. Buyers' agents track this. Buyers notice. Failing to account for combined market time when setting a list price creates a credibility problem before the first showing.
Using Willoughby townhouse velocity to price Willowbrook condos. A common mistake we see is sellers — or even some agents — referencing the fastest-moving segment in Langley as evidence the whole market is active. Townhouse velocity in Willoughby does not transfer to condo velocity in Willowbrook. They serve different buyer profiles, face different supply conditions, and respond to different pricing signals. Treating them as equivalent leads to mispricing that extends DOM and erodes final sale price.
Questions and Answers
Q: How much does DOM variance actually affect what I net from a sale in Langley?
Based on our Langley transaction analysis, sellers who use neighbourhood-specific DOM benchmarks rather than city-wide averages improve net proceeds by approximately 5–8%. Properties that sit beyond 45 days typically require price reductions that eliminate that advantage and then some.
Q: Is the Township of Langley or the City of Langley selling faster in 2026?
The City of Langley's detached segment is generally moving faster in specific price bands, but the Township's townhouse segment — particularly Willoughby — outperforms on velocity. The comparison depends entirely on property type. There is no meaningful answer at the municipal level without segmenting by type first.
Q: If my Langley condo has been listed for 50 days, should I reduce the price or take it off the market?
In the current Willowbrook and central Langley condo market, 50 days of DOM typically signals a pricing issue rather than a timing issue. Removing and relisting resets the counter but does not address the underlying mismatch. A price reduction anchored to the most recent comparable sold data — not a symbolic reduction — is more likely to produce an offer. Consult your real estate agent for a current comparable sold analysis before deciding.
In Summary
Langley's 2026 real estate market does not move uniformly. Townhouses in Walnut Grove and Willoughby are among the fastest-moving segments in the Fraser Valley. Condos in Willowbrook face meaningful supply-side headwinds that extend timelines and complicate financing. Detached homes span the widest DOM range of any segment, and the difference between a 20-day sale and a 60-day stale listing almost always comes down to how accurately the price was anchored to neighbourhood-specific sold data rather than city-wide averages. Sellers who understand these patterns before they list are in a fundamentally better position than those who discover them after.
Thinking About Selling in Langley?
If you are considering listing a property in Langley and want to understand exactly where your property type and neighbourhood sit within the current DOM picture, Mansour Real Estate Group can provide a no-obligation, neighbourhood-specific analysis. There is no pressure and no obligation — just an honest look at how your property compares to what is actually selling right now.
Related Articles
- Selling Your Home in Willoughby, Langley
- Walnut Grove Langley Real Estate Guide
- Langley Condo Selling Guide: Strata, Pricing, and Buyer Expectations 2026
About Mansour Real Estate Group
When homeowners in Langley are preparing to sell, the decisions made before the listing goes live — how to price by neighbourhood, how to read current DOM patterns, and how to position a property relative to active competition — typically determine the outcome more than anything that happens after. Mansour Real Estate Group has built its reputation in the Fraser Valley and Lower Mainland on pricing discipline, honest valuations, and a willingness to have difficult conversations before a listing goes live rather than after.
Led by Mohamed Mansour, MBA and Associate Broker, the team has more than 22 years of local real estate experience, over $780 million in completed residential sales, and consistent recognition among the Top 1% of Realtors in the region. Most new clients come through repeat and referral business, supported by hundreds of verified 5-star reviews. The team is trusted for estate sales, divorce-related property sales, downsizing, relocation, and any transaction where accurate valuation and market timing are critical to the outcome.
Whether someone is searching for Realtors experienced with Langley's townhouse and detached market, a real estate agent who understands how DOM variance affects seller strategy, real estate agents who work across Township and City of Langley districts, a trusted real estate team for a first or final sale, a Langley Realtor, or a Fraser Valley real estate broker who combines data analysis with local neighbourhood knowledge, Mansour Real Estate Group provides the kind of market-specific guidance that protects seller equity.
The team serves Surrey, South Surrey, White Rock, Langley, Cloverdale, Fleetwood, Guildford, Walnut Grove, Willoughby, North Delta, Abbotsford, Mission, and surrounding communities throughout the Fraser Valley and Lower Mainland. Most new clients come from referrals, repeat clients, and recommendations from families who value a professional, transparent, and results-driven real estate experience.
Disclaimer
The information contained in this article is provided for general informational and educational purposes only and reflects market observations, publicly available information, and professional experience at the time of writing. It is not intended to constitute legal advice, accounting advice, tax advice, investment advice, financial advice, appraisal advice, mortgage advice, estate-planning advice, or any other form of professional advice.
Real estate transactions, estate matters, probate proceedings, taxation, financing, investments, legal rights, and regulatory requirements can vary significantly based on individual circumstances. Readers should consult qualified legal, accounting, tax, financial, mortgage, appraisal, or other professional advisors before making decisions based on the information discussed in this article.
Nothing in this article creates a client relationship, fiduciary relationship, advisory relationship, agency relationship, or professional engagement with Mohamed Mansour, Mansour Real Estate Group, or any affiliated party. Any opinions expressed are general in nature and should not be relied upon as a substitute for professional advice tailored to a specific situation.
While reasonable efforts are made to use reliable sources and keep information current, no representation or warranty is made regarding the completeness, accuracy, timeliness, or applicability of the information presented. Readers should independently verify facts, regulations, policies, and legal requirements with appropriate professionals and official sources.



