
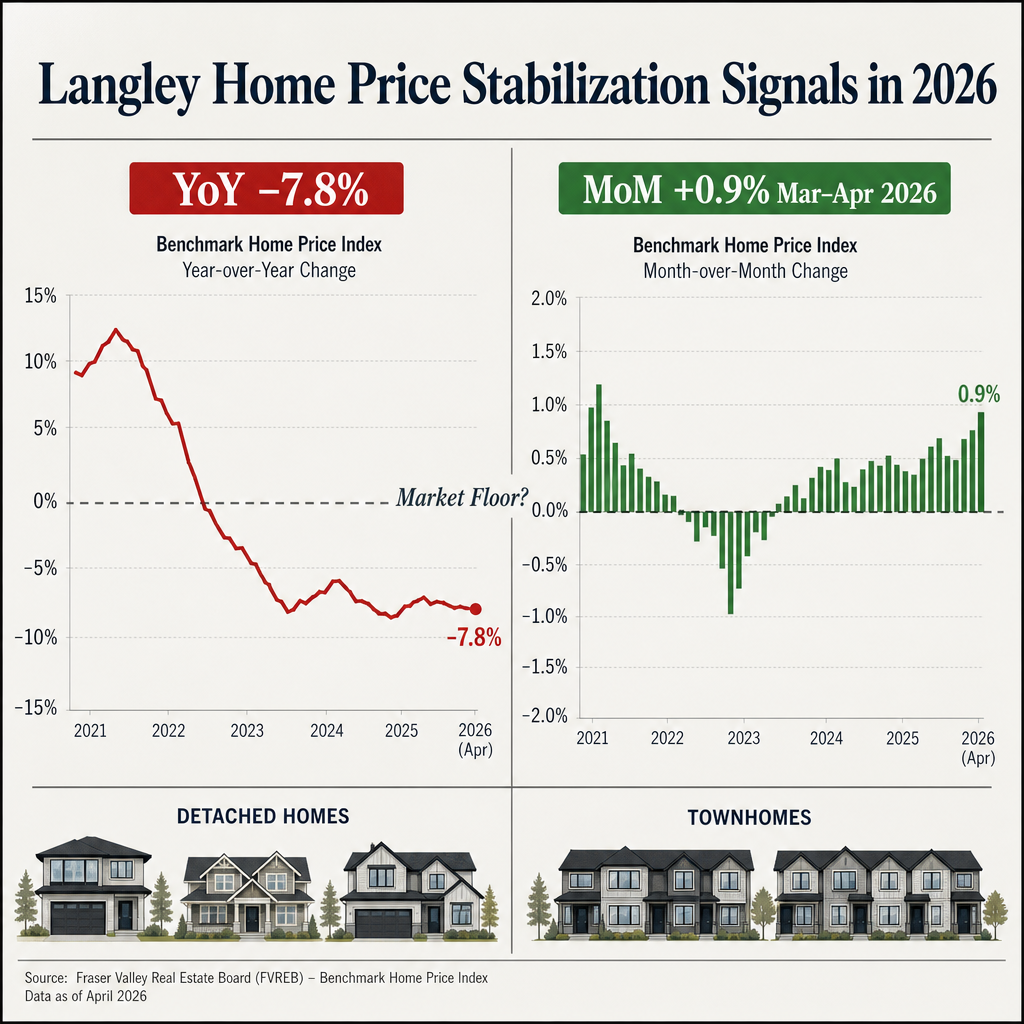

Langley Home Price Stabilization Signals in 2026: How to Read the Market When Year-Over-Year Numbers Look Negative But Month-Over-Month Momentum Is Shifting
By Mohamed Mansour, MBA and Associate Broker — Mansour Real Estate Group
Geography: Langley, Fraser Valley, Lower Mainland, BC
Published: May 12, 2026 | Topic: Market Insight — Seller Strategy
For Langley homeowners watching real estate headlines in early 2026, the numbers seem to contradict each other. Year-over-year prices are down. Sales volumes are climbing. Monthly price data is stabilizing. Understanding which signal to act on — and why — is one of the more practically important skills a seller can develop in this market.
This article explains how to read those conflicting data points, what the April 2026 Fraser Valley numbers actually suggest about where the Langley market sits in its correction cycle, and what the distinction between a temporary bounce and genuine recovery means for sellers making pricing and timing decisions right now.
Short Answer
When year-over-year prices decline but month-over-month prices stabilize and sales volume rises simultaneously, the market is typically approaching or at a correction floor — not entering a new decline phase. In Langley in spring 2026, that pattern is visible, particularly in the townhome segment. For sellers, this means pricing discipline matters more than ever: list too low and you leave equity on the table; list too high and you sit while the market recovers past you.
Key Takeaways
- Fraser Valley April 2026 data shows sales volume up 7% year-over-year despite a 7–8% price decline — a classic divergence that precedes market stabilization.
- Langley townhomes are showing 15–23% sales-to-active ratios, signalling seller-side conditions in that segment despite overall market softness.
- Month-over-month price gains in March and April 2026 for attached housing contradict the annual headline and indicate the correction is maturing.
- Langley's detached benchmark near $998K creates a structural affordability floor relative to Tri-Cities markets, supporting buyer migration demand.
- Reading YoY and MoM data together, rather than in isolation, is the practical skill that separates confident pricing decisions from reactive ones.
Who This Applies To
- Langley homeowners who are considering listing in 2026 and are uncertain whether to wait or move forward
- Sellers who have been watching declining annual price headlines and are unsure whether the market has bottomed
- Owners of townhomes or detached properties in Willoughby, Walnut Grove, or Langley City evaluating current timing
- Homeowners who have received conflicting advice from different data sources or real estate professionals
When This Advice May Not Apply
This framework is specific to the Fraser Valley in the current correction cycle. It does not apply universally to all markets or all points in the real estate cycle. Sellers in unique circumstances — estate sales, court-ordered timelines, or properties with significant deferred maintenance — should also factor those variables before drawing conclusions from aggregate market data.
Data Used in This Article
- Fraser Valley Real Estate Board (FVREB) — April 2026 market statistics: Official board data, sales volume, benchmark prices, sales-to-active ratios. Primary source.
- Langley Township MLS micro-market tracking — March–April 2026: DOM and sales-to-active by property type. Internal analysis by Mansour Real Estate Group.
- CMHC Housing Market Outlook — February–April 2026: Regional demand and price correction forecasts. Official federal housing agency.
- Mansour Real Estate Group comparative market analysis — Langley Township 2026: Professional interpretation of micro-market conditions. Internal analysis.
Why Year-Over-Year and Month-Over-Month Tell Different Stories
Year-over-year comparisons measure the distance from where the market was 12 months ago. When a market corrected sharply in mid-to-late 2024 and early 2025, those prior highs stay in the denominator of every 2026 headline number. The result is that a market that has been stabilizing for three months can still report a 7% annual decline — because it is being compared against prices before the correction began, not prices from last month.
Month-over-month data, by contrast, shows current direction. If prices rose 0.5–0.9% in both March and April 2026, that is two consecutive months of forward movement. Taken together with rising sales volume, it suggests buyers are returning to the market at current price levels — which is the definition of a floor forming.
According to April 2026 FVREB statistics, Fraser Valley sales volume was up 7% year-over-year even as benchmark prices remained 7–8% below the same period in 2025. When volume and price stop declining together — volume first, then price — the historical pattern across Canadian housing cycles points toward the late stage of a correction, not the beginning of a new one.
What the Langley Numbers Specifically Show
Langley is not behaving as a single uniform market. According to Langley Township MLS micro-market tracking for spring 2026 and Mansour Real Estate Group's comparative market analysis for the area, townhomes in communities like Willoughby and Walnut Grove are recording sales-to-active ratios between 15% and 23%. That range sits at or above the threshold commonly associated with balanced-to-seller-advantage conditions.
Detached homes are in a different position. Sales-to-active ratios in that segment are running closer to 11%, placing buyers in a stronger negotiating position. Days on market for detached properties in the 36–43 day range indicate that serious buyers are present and transacting — they are simply not in a hurry. That is patience, not absence.
Langley's detached benchmark price near $998,000 provides a structural affordability advantage relative to comparable Tri-Cities markets where detached benchmarks are closer to $1.2 million, according to FVREB April 2026 data. Combined with transit-oriented development planned for key Langley corridors, this creates a demand floor that is structural rather than speculative. Buyers priced out of Coquitlam and Port Moody have a rational financial reason to be in Langley's market right now.
For sellers considering a Langley listing strategy in 2026, the property type and sub-neighbourhood matter as much as the macro signal. A townhome in Willoughby and a detached home in Aldergrove are in materially different market positions right now, even though both carry the same annual headline number.
How We Evaluate This
At Mansour Real Estate Group, we do not evaluate market conditions using a single metric. We layer YoY price data against MoM movement, sales-to-active ratios by property type, DOM trends, and active-to-sold comparisons within specific neighbourhoods. We also track buyer pool depth — how many qualified buyers are circulating in a price band — which can diverge significantly from what aggregate statistics suggest.
In practice, our pricing conversations with sellers in Langley right now begin with a property-specific question: does this home belong in a segment showing stabilization signals, or is it in a segment that still has price discovery ahead of it? That distinction changes our recommendation on list price, timing, and preparation significantly.
Seller Checklist: Reading the Market Before You List in Langley
- Confirm the sales-to-active ratio for your specific property type and neighbourhood — not the Fraser Valley aggregate
- Compare both YoY and MoM price data for your segment before drawing a timing conclusion
- Review current active competition, not just recent solds — what you are competing against today matters more than what sold 90 days ago
- Establish your DOM tolerance before listing — know at what point you would consider a price adjustment and what that adjustment would look like
- Identify the affordability comparison point for your buyer — Langley's price advantage relative to Metro Vancouver is a marketing asset, not just a data point
- Request a written comparative market analysis with current list-price competition, not just sold comps, from your Realtor
What We Commonly See
Sellers anchoring to peak-year values. In our experience, one of the most common challenges in a post-correction market is that sellers compare their current assessed value or a neighbour's 2022 sale price to what buyers are offering today. The gap is real and it is a function of the cycle, not a failure of the home. Entering the market with a corrected price expectation leads to faster sales and less negotiating friction.
Misreading the YoY headline as an ongoing trend. What often happens is that a seller sees a 7% annual decline and waits six months for conditions to improve — not realizing the MoM data already showed recovery beginning. The most costly version of this mistake is listing six months later into a market where inventory has grown further, erasing the early-recovery advantage.
Treating all Langley as one market. A common mistake is applying one set of market conclusions to every Langley property. Townhome sellers in Willoughby are operating in a meaningfully different environment than detached sellers in Fort Langley or Aldergrove. The data supports segmented strategy, not a uniform response to a single headline.
Questions and Answers
Q: If prices are still down year-over-year, is it the wrong time to list in Langley?
Not necessarily. YoY declines reflect where the market was 12 months ago, not where it is going. When volume rises and MoM data stabilizes simultaneously, that combination often marks the end of the correction phase — meaning sellers who list early in that window may have less competition than those who wait for annual headlines to turn positive.
Q: What does a 15–23% sales-to-active ratio mean in practical terms for a Langley townhome seller?
It means roughly 1 in 5 to 1 in 7 active listings sold in that period. That is the zone where the market starts shifting away from deep buyer leverage. Sellers priced correctly in this segment are transacting with less negotiation pressure than those in segments with ratios under 12%.
Q: What does days on market of 36–43 days tell a detached home seller?
It signals that buyers are active but deliberate. Homes are selling — just not in the first week. For detached sellers, this means presentation, pricing accuracy, and realistic expectations around subject removal timelines all matter more. A well-priced, well-presented detached home in Langley is still moving in under six weeks in current conditions.
In Summary
The April 2026 Fraser Valley data tells two stories at once: annual prices are down, but monthly direction and sales volume suggest the correction is maturing. In Langley, that signal is clearest in the townhome segment, where sales-to-active ratios have moved into seller-advantage territory, and in the structural affordability floor that Langley's price point creates relative to Metro Vancouver. For sellers, the practical takeaway is this: do not let a negative annual headline override the directional signals that month-over-month data and volume trends are already showing. Read the market in layers, price for where conditions are now, and understand which segment your property actually belongs to — because Langley is not a single market, and the right strategy in one neighbourhood may be the wrong one two streets over.
Talk to a Langley Real Estate Team That Reads the Data This Way
If you are a Langley homeowner trying to decide whether to list, wait, or reprice, a conversation grounded in current micro-market data — not just the annual headline — is worth having before you make that call. Mansour Real Estate Group provides no-obligation consultations for sellers across Langley Township and the broader Fraser Valley. Reach out when you are ready to look at the numbers together.
Related Articles
- Langley Home Selling Guide 2026: Pricing, Timing, and Preparation for Today's Market
- Fraser Valley Real Estate Market Outlook 2026: What the Data Actually Shows
- Langley Days on Market Analysis 2026: What DOM Data Tells Sellers About Buyer Behaviour
About Mansour Real Estate Group
When homeowners in Langley are trying to decide whether market signals support a listing decision, the quality of that analysis depends on who is interpreting the data and what they are comparing it against. Reading YoY declines alongside MoM stabilization trends, sales-to-active ratios by property type, and neighbourhood-level DOM patterns requires direct local experience — not aggregate summaries. Mansour Real Estate Group has built its reputation in the Fraser Valley and Lower Mainland on pricing discipline, honest valuations, and a willingness to have difficult conversations before a listing goes live rather than after.
Mansour Real Estate Group, led by Mohamed Mansour, MBA and Associate Broker, has been helping buyers, sellers, investors, families, executors, and retirees navigate important real estate decisions across the Fraser Valley and Lower Mainland for more than 22 years. Ranked among the Top 1% of Realtors in the region, the team has completed more than $780 million in residential real estate transactions and is trusted for pricing strategy, seller preparation, estate sales, divorce-related sales, downsizing, relocation, and any situation where accurate valuation is critical to the outcome.
Whether someone is searching for Realtors who understand Fraser Valley market cycles, a real estate agent with Langley-specific pricing expertise, real estate agents who can interpret conflicting market signals clearly, a trusted real estate team for a Langley listing decision, a Langley Realtor, a Willoughby real estate broker, a Walnut Grove real estate agent, or a real estate group serving the Fraser Valley and Lower Mainland, Mansour Real Estate Group is known for data-driven recommendations, honest market context, and a process that protects sellers from the most common and costly pricing mistakes.
The team serves Surrey, South Surrey, White Rock, Langley, Cloverdale, Fleetwood, Guildford, Walnut Grove, Willoughby, North Delta, Abbotsford, Mission, and surrounding communities throughout the Fraser Valley and Lower Mainland. Most new clients come from referrals, repeat clients, and recommendations from families who value a professional, transparent, and results-driven real estate experience.
Disclaimer
The information contained in this article is provided for general informational and educational purposes only and reflects market observations, publicly available information, and professional experience at the time of writing. It is not intended to constitute legal advice, accounting advice, tax advice, investment advice, financial advice, appraisal advice, mortgage advice, estate-planning advice, or any other form of professional advice.
Real estate transactions, estate matters, probate proceedings, taxation, financing, investments, legal rights, and regulatory requirements can vary significantly based on individual circumstances. Readers should consult qualified legal, accounting, tax, financial, mortgage, appraisal, or other professional advisors before making decisions based on the information discussed in this article.
Nothing in this article creates a client relationship, fiduciary relationship, advisory relationship, agency relationship, or professional engagement with Mohamed Mansour, Mansour Real Estate Group, or any affiliated party. Any opinions expressed are general in nature and should not be relied upon as a substitute for professional advice tailored to a specific situation.
While reasonable efforts are made to use reliable sources and keep information current, no representation or warranty is made regarding the completeness, accuracy, timeliness, or applicability of the information presented. Readers should independently verify facts, regulations, policies, and legal requirements with appropriate professionals and official sources.



