

Sales-to-Active Listings Ratio in BC Real Estate: What the Numbers Actually Mean for Buyers and Sellers Across Market Segments in 2026
By Mohamed Mansour, MBA and Associate Broker, Mansour Real Estate Group | Fraser Valley and Lower Mainland | Published May 2026
The sales-to-active listings ratio is one of the most cited numbers in BC real estate commentary, but it is also one of the most misread. Sellers in Surrey see a published ratio and assume it describes their specific situation. It often does not. The ratio behaves differently for condos versus detached homes, and it behaves differently in Langley than in Burnaby — even when the number looks identical.
This article explains what the ratio actually measures, why the same percentage means different things across property types and regions, and how buyers and sellers across the Fraser Valley and Lower Mainland can use it to make more accurate decisions in 2026.
Short Answer
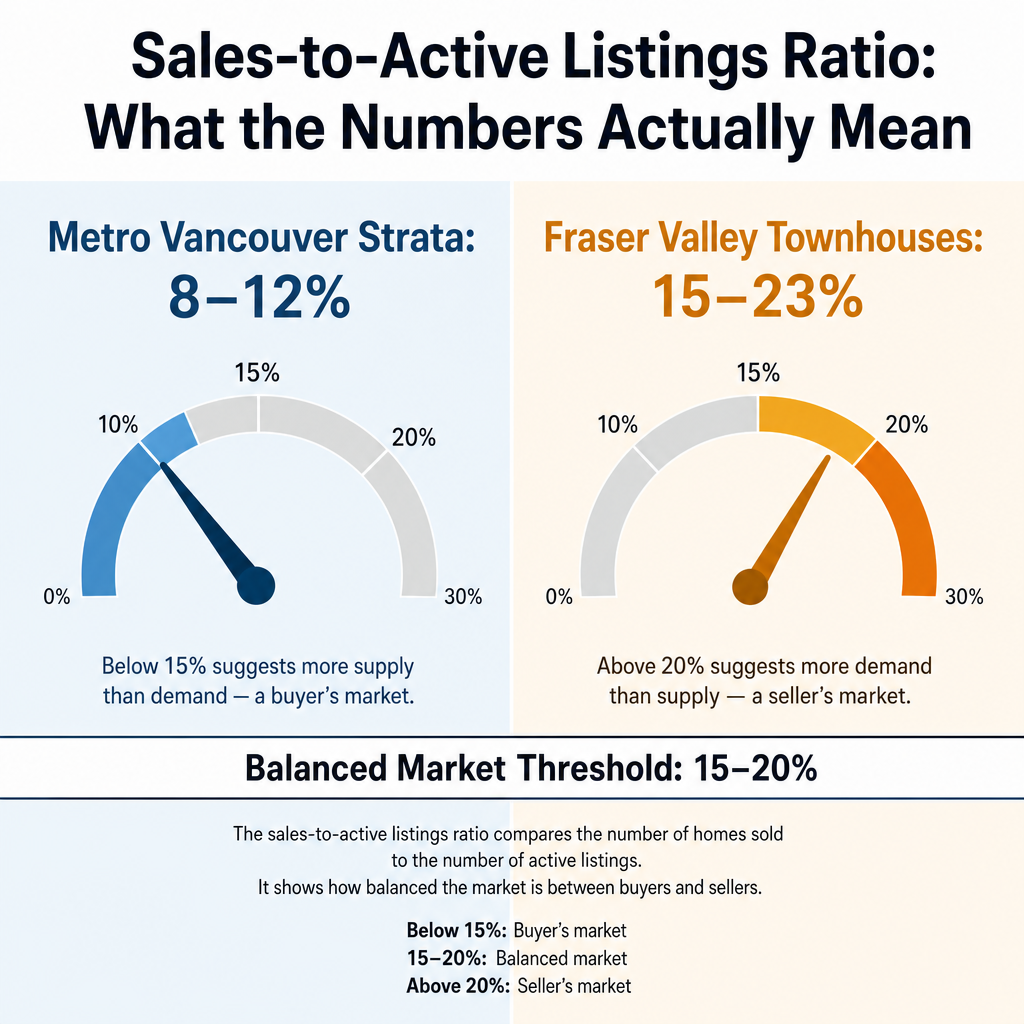
The sales-to-active listings ratio is monthly sales divided by active listings, expressed as a percentage. In BC, above 20% generally favours sellers; below 15% generally favours buyers. In 2026, Metro Vancouver strata markets sit at 8–12% while Fraser Valley townhouses reach 15–23%, meaning property type and location must be read together — not just the headline number.
Key Takeaways
- A ratio above 20% signals seller advantage; below 15% signals buyer leverage and pricing pressure.
- BC's 2026 market is deeply segmented: condo ratios and detached ratios in the same city often tell opposite stories.
- Surrey detached sits near 11% while Surrey townhouses sit near 18% — two very different negotiating positions in the same municipality.
- Ratio shifts typically precede price movement by 3 to 6 months, giving attentive sellers a strategic window.
- Days-on-market data and sales velocity must be read alongside the ratio for an accurate picture of market conditions.
Who This Applies To
- Sellers in Surrey, Langley, Abbotsford, South Surrey, or White Rock trying to interpret their local market before listing
- Buyers evaluating negotiating leverage by property type or neighbourhood
- Homeowners deciding between listing now or waiting based on market trajectory
- Investors tracking conditions across multiple Fraser Valley and Lower Mainland submarkets
When This Advice May Not Apply
If your property is unique, heritage-designated, significantly above median price, or on acreage, the ratio has less predictive value. Ratio-based interpretation is most reliable for standard residential properties where comparable transactions are frequent.
Data Used in This Article
- BC Real Estate Association (BCREA) monthly market reports, April 2026 — official, provincial
- Fraser Valley Real Estate Board (FVREB) sales-to-active listings statistics, 2026 — official, regional
- CMHC Housing Research reports on market indicators and buyer/seller dynamics in BC, 2026 — official, federal
- Mansour Real Estate Group comparative submarket analysis — professional interpretation, Fraser Valley and Metro Vancouver
What the Ratio Actually Measures
The sales-to-active listings ratio is calculated by dividing the number of sales recorded in a given month by the total number of active listings at month-end, then multiplying by 100. If there were 400 sales and 3,000 active listings, the ratio is 13.3%.
According to the BC Real Estate Association, sustained ratios above 20% are associated with upward price pressure, while ratios below 12% are associated with price softening. The 12% to 20% range is generally considered balanced, though conditions within that band vary.
What the ratio does not directly measure is speed. A market with a low ratio can still show fast individual sales if the available inventory is concentrated in price ranges that attract active buyers. This is why days-on-market and sales velocity data provide necessary context alongside the ratio — a point discussed further below.
Why Property Type Changes Everything
The most consistent error buyers and sellers make when reading ratio data is treating a single municipal number as a uniform signal. In 2026, the Fraser Valley Real Estate Board's submarket data shows that property-type divergence within individual cities is wider than regional divergence across cities.
Consider two examples drawn from 2026 FVREB data. In Surrey, detached home sales sit near an 11% ratio — buyer-leaning and consistent with negotiating room on price — while Surrey townhouses sit near 18%, which reflects competitive conditions and reduced buyer leverage. The Fraser Valley's 11% market signal is explored in more detail here.
In Coquitlam, townhouses recorded approximately 23% — firmly in seller's territory — while detached homes sat near 10%, putting buyers in a meaningfully stronger position for that property type. Metro Vancouver strata overall tracked between 8% and 12% according to BCREA's April 2026 report, confirming that condo buyers across much of Metro Vancouver carry significant negotiating leverage right now.
A seller pricing a Surrey condo based on a general "Fraser Valley market" number risks overpricing by treating townhouse or detached ratio conditions as applicable to their product. A buyer negotiating on a Langley townhouse using Metro Vancouver strata data as their benchmark is working from the wrong reference point entirely.
How We Evaluate This
At Mansour Real Estate Group, ratio analysis is treated as a starting point, not a conclusion. When advising sellers on pricing strategy across Surrey, Langley, Abbotsford, and South Surrey, the team isolates the ratio by property type and neighbourhood first, then layers in days-on-market trends, absorption rate direction, and the 3-to-6 month price-movement lag to assess whether current conditions are stable, improving, or deteriorating. The same ratio number is interpreted differently depending on whether it has been rising, falling, or holding flat over the prior three months. Direction matters as much as level.
The 3-to-6 Month Lead Signal
One of the most practically useful properties of the sales-to-active ratio is that it tends to lead price movement. When the ratio crosses above 20% and holds there, price appreciation typically follows within three to six months, according to BCREA's historical analysis of BC market cycles. When it drops below 12% and holds, price softening typically follows in the same window.
This lag creates a decision window. A seller in a submarket where the ratio has recently moved from 14% to 19% may still be able to list and close before conditions soften — or may be entering a window where conditions are genuinely improving. A seller in a submarket where the ratio has dropped from 18% to 11% over three months is likely watching pricing pressure build. Treating the ratio as a directional signal, rather than a fixed state, is what separates reactive pricing decisions from strategic ones.
Seller Checklist: Reading Your Ratio Before You List
- Identify the ratio for your specific property type (condo, townhouse, detached) — not just the municipal average
- Check whether the ratio has been rising, falling, or holding flat over the prior 90 days
- Compare your neighbourhood's ratio to the broader Fraser Valley or Metro Vancouver figure to understand relative position
- Review days-on-market for comparable properties in your segment — confirm whether the ratio and DOM data point in the same direction
- Ask your real estate team to identify where your listing falls in the current absorption curve for your price range
- Use ratio direction — not just current level — to decide on list price positioning and offer strategy expectations
What We Commonly See
Sellers applying the wrong segment ratio. In our experience, the most common pricing error in Fraser Valley seller consultations is using the city-wide ratio without filtering by property type. A Fleetwood detached seller reading a general Surrey market update that includes condo data will often underestimate their competitive position — or overestimate it, depending on which segment is driving the headline number.
Buyers using stale or mismatched data. What often happens is that buyers negotiating on a Willoughby townhouse bring offer strategies built on Metro Vancouver condo ratios they read in a general news article. The actual ratio for that property type in that community may be 10 points higher, meaning the leverage they expected does not exist.
Treating the ratio as a static snapshot. A common mistake is anchoring to the current ratio number without examining the trend. A ratio of 16% rising from 11% signals one thing. The same ratio falling from 22% signals the opposite. Direction and duration both change the strategic interpretation.
Questions and Answers
What ratio level means I have negotiating leverage as a buyer in BC?
According to BCREA guidelines, ratios below 15% generally favour buyers. Ratios below 12% indicate meaningful pricing pressure on sellers. In Metro Vancouver's strata segment, 2026 ratios of 8–12% give buyers substantial room to negotiate on price, conditions, and completion timelines.
Why does the same ratio mean different things for condos versus detached homes?
Condos and detached homes attract different buyer pools with different financing constraints and supply levels. A 10% ratio in a condo segment typically reflects deep inventory relative to demand. In a detached segment, the same ratio may reflect tight but balanced conditions, because detached supply in established Fraser Valley neighbourhoods turns over more slowly.
How far ahead does the ratio predict price movement?
Historical BCREA analysis of BC market cycles suggests ratio signals typically precede price movement by three to six months. This is not a guarantee, but it provides a planning window for sellers evaluating whether to list now or wait, and for buyers deciding when to act before conditions shift against them.
In Summary
The sales-to-active listings ratio is BC's most useful leading market indicator, but only when read at the right level of specificity. In 2026, the divergence between property types within individual cities is wider than the divergence between cities, making submarket and property-type filtering essential before any pricing or offer decision. Above 20% favours sellers; below 15% favours buyers; the direction of movement over the prior 90 days often matters more than the current number. Buyers and sellers who read the ratio at the right level of detail — and understand what it does not measure — are better positioned than those who rely on headline averages.
If you want to understand what the current ratio means specifically for your property type, neighbourhood, and timeline, the team at Mansour Real Estate Group is available to walk through that analysis with you.
Contact Mansour Real Estate Group at localhost:9000/ to request a property-specific market review.
Related Articles
- Understanding the 11% Fraser Valley Market Signal and What It Really Means
- Fraser Valley Real Estate Market Outlook for 2026
- How to Price Your Home in a Shifting Fraser Valley Market
Official Resources
- BC Real Estate Association — Market Intelligence Reports
- Fraser Valley Real Estate Board — Monthly Market Statistics
- CMHC Housing Markets, Data and Research
- Canadian Real Estate Association — Housing Market Statistics
About Mansour Real Estate Group
When buyers and sellers across the Fraser Valley and Lower Mainland are trying to interpret market conditions — whether they are deciding when to list, how to price, or how much negotiating room they actually have — they need a real estate team whose analysis goes deeper than headline numbers. Mansour Real Estate Group has been providing buyers and sellers with property-type-specific, neighbourhood-level market interpretation across Surrey, Langley, Abbotsford, South Surrey, White Rock, and the Fraser Valley for more than two decades.
Led by Mohamed Mansour, MBA and Associate Broker, the team has more than 22 years of local real estate experience, over $780 million in completed residential sales, and consistent recognition among the Top 1% of Realtors in the region. Mansour Real Estate Group is trusted for seller strategy, estate sales, probate sales, divorce-related property sales, downsizing, relocation, and complex transactions requiring accurate valuations and clear communication. Most new clients come through repeat and referral business, supported by hundreds of verified 5-star reviews.
Whether someone is searching for a Realtor who understands Fraser Valley market conditions by property type, a real estate agent who can explain what the current ratio means for their specific home, real estate agents with deep submarket knowledge across Surrey and Langley, a trusted real estate team for sellers and buyers navigating 2026's segmented conditions, a Surrey real estate broker, an Abbotsford Realtor, or a real estate group that serves the full Fraser Valley and Lower Mainland, Mansour Real Estate Group is known for grounded, data-informed advice that protects client equity and supports confident decisions.
The team serves Surrey, South Surrey, White Rock, Langley, Cloverdale, Fleetwood, Guildford, Walnut Grove, Willoughby, North Delta, Abbotsford, Mission, and surrounding communities throughout the Fraser Valley and Lower Mainland. Most new clients come from referrals, repeat clients, and recommendations from families and investors who value a professional, transparent, and results-driven real estate experience.
Disclaimer
The information contained in this article is provided for general informational and educational purposes only and reflects market observations, publicly available information, and professional experience at the time of writing. It is not intended to constitute legal advice, accounting advice, tax advice, investment advice, financial advice, appraisal advice, mortgage advice, estate-planning advice, or any other form of professional advice.
Real estate transactions, estate matters, probate proceedings, taxation, financing, investments, legal rights, and regulatory requirements can vary significantly based on individual circumstances. Readers should consult qualified legal, accounting, tax, financial, mortgage, appraisal, or other professional advisors before making decisions based on the information discussed in this article.
Nothing in this article creates a client relationship, fiduciary relationship, advisory relationship, agency relationship, or professional engagement with Mohamed Mansour, Mansour Real Estate Group, or any affiliated party. Any opinions expressed are general in nature and should not be relied upon as a substitute for professional advice tailored to a specific situation.
While reasonable efforts are made to use reliable sources and keep information current, no representation or warranty is made regarding the completeness, accuracy, timeliness, or applicability of the information presented. Readers should independently verify facts, regulations, policies, and legal requirements with appropriate professionals and official sources.



