

Understanding the Sales-to-Active Listings Ratio: What the 11% Fraser Valley Market Signal Really Means for Your Selling Decision in 2026
By Mohamed Mansour, MBA and Associate Broker | Mansour Real Estate Group | Published: June 17, 2025 | Fraser Valley and Lower Mainland, BC
The Fraser Valley real estate market produces a lot of numbers every month. Benchmark prices, sales volumes, days on market, new listings. Most sellers focus on one of those — usually price — and draw the wrong conclusion. The number that actually tells you the most about market conditions right now is one that rarely appears in news headlines: the sales-to-active listings ratio.
In April 2026, that ratio for the Fraser Valley sat at 11%, according to the Fraser Valley Real Estate Board's April 2026 Statistics Package. Understanding what that means — and what it doesn't — is the most useful thing a seller can do before making any decision about timing, pricing, or positioning a property in this market.
Short Answer
The sales-to-active listings ratio measures what percentage of active listings sold in a given month. In the Fraser Valley, a ratio below 12% signals a buyer's market with downward price pressure. April 2026's ratio of 11% means buyers hold the advantage. For sellers, pricing strategy now matters more than timing. Overpriced homes sit. Well-priced homes still move.
Key Takeaways
- The Fraser Valley's April 2026 ratio of 11% places the market firmly in buyer's territory, below the 12% threshold.
- Active inventory reached 9,816 listings in April 2026, roughly 50% above the 10-year seasonal average, per FVREB data.
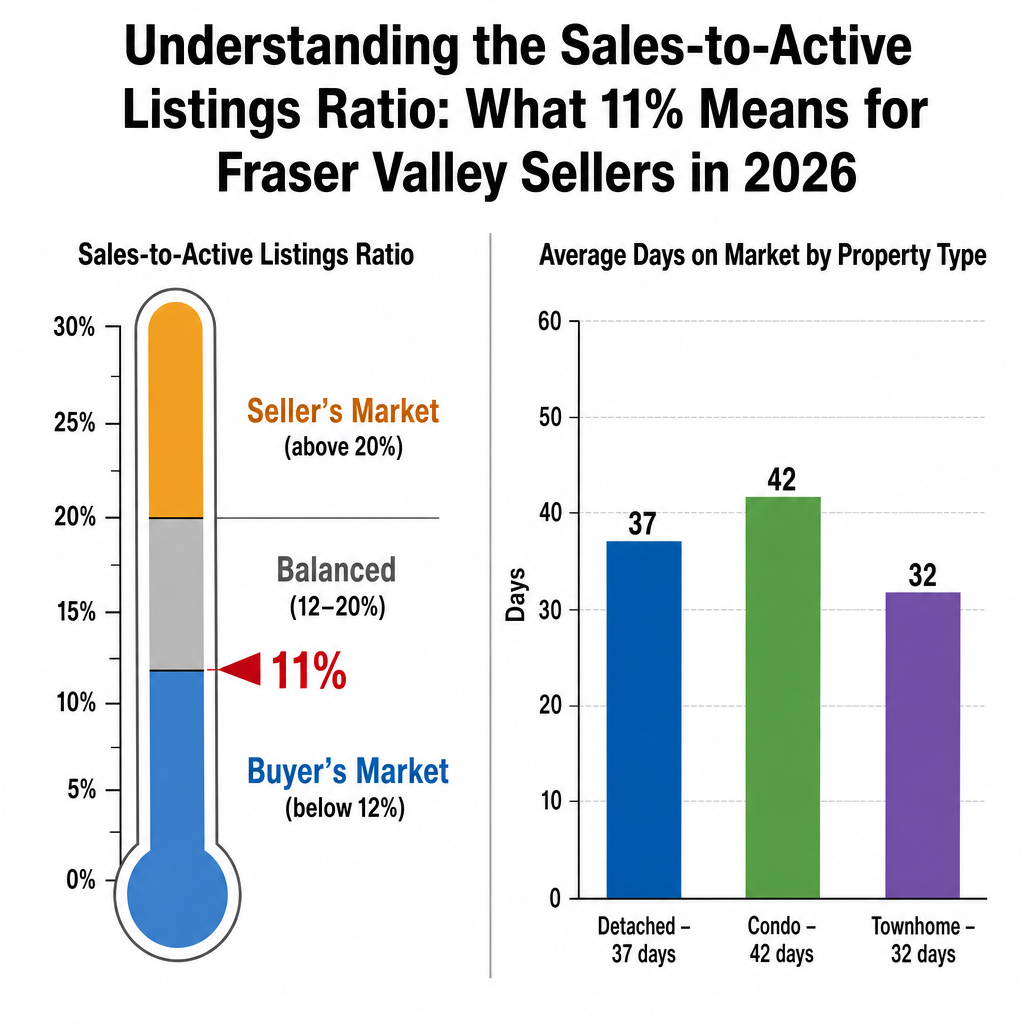
- Days on market varied by property type: detached homes averaged 37 days, condos 42, townhomes 32 in April 2026.
- A 0.1% month-over-month benchmark price gain is stabilization, not recovery — the ratio tells the fuller story.
- Accurate pricing within a buyer's market produces better outcomes than waiting for market conditions to shift.
Who This Applies To
- Homeowners in Surrey, Langley, Abbotsford, South Surrey, or White Rock considering a sale in 2026
- Sellers trying to interpret mixed market signals — stable prices alongside longer days on market
- Condo owners wondering why their segment feels softer than the detached market
- Executors or estate trustees managing a property sale in current conditions
- Anyone who has heard "the market is recovering" and wants to know if that's accurate
When This Advice May Not Apply
If your property is in a micro-location with atypically low supply, or if your property type has specific demand drivers (a rare floorplan, a specific school catchment, a unique lot), local conditions may differ from the board-wide average. The ratio is a market-level signal, not a property-level guarantee. Your listing strategy should account for both.
Data Used in This Article
- Fraser Valley Real Estate Board — April 2026 Statistics Package: Official monthly data. Sales, active listings, benchmark prices, days on market. Primary source.
- FVREB Monthly Market Report: Contextual commentary on market conditions and ratio thresholds. Official source.
- CMHC Housing Market Outlook 2026: Resale activity forecasts and recovery trajectory. Federal housing authority. Official source.
- Greater Vancouver Realtors (GVR) — March 2026 Report: Metro Vancouver ratio of 14.2% for comparative context. Official source.
What the Sales-to-Active Listings Ratio Actually Measures
The calculation is straightforward. Take the number of sales in a month, divide by the number of active listings at month end, and multiply by 100. The result tells you what share of available homes actually changed hands.
According to the Fraser Valley Real Estate Board, the thresholds work as follows: below 12% indicates a buyer's market where sustained downward price pressure typically develops; 12% to 20% represents a balanced market; above 20% favours sellers and tends to produce upward price pressure.
In April 2026, the Fraser Valley recorded 1,060 sales against 9,816 active listings, producing a ratio of 11%. That number has been below 12% since early 2025, meaning buyers have held the structural advantage for an extended period — not just a single soft month.
For comparison, Greater Vancouver Realtors reported a March 2026 composite ratio of 14.2%, placing Metro Vancouver in balanced territory overall. But that aggregate masks variation: detached homes in both regions are holding up better than condos, and the Fraser Valley's overall ratio sits lower than Metro Vancouver's — meaning the buyer advantage is more pronounced here.
Why Inventory Levels Amplify the Signal
The ratio doesn't exist in isolation. Its impact depends heavily on the absolute level of inventory. When 9,816 active listings compete for 1,060 buyers in a single month, the choice available to buyers is substantial. According to FVREB's April 2026 data, that inventory level sits approximately 50% above the 10-year seasonal average for April.
High inventory gives buyers room to be selective. They can view more options, wait for price reductions, and negotiate harder on conditions. Sellers who price at or slightly above comparable sales lose buyers to the next listing before they even receive a showing request.
This is why days on market has extended. FVREB April 2026 data shows detached homes averaging 37 days, condos 42 days, and townhomes 32 days. Those figures are not random. They reflect a market where buyers have time and options on their side.
Townhomes are moving fastest at 32 days, consistent with their position as the most in-demand segment for price-sensitive buyers who need more space than a condo but cannot reach detached prices. That demand profile has been consistent across the Fraser Valley — in Willoughby, Cloverdale, and Guildford alike.
How We Evaluate This
At Mansour Real Estate Group, we look at the ratio as one of three primary inputs in a seller consultation. The other two are the days-on-market trend for the specific property type and the gap between list price and sale price in the most recent 90 days of comparable sales.
When the ratio is below 12%, that list-to-sale gap tends to widen — meaning sellers who start too high don't just wait longer, they often net less than if they had priced accurately from the start. A property that sits 30 to 45 days before a price reduction signals desperation to buyers, and the revised price attracts lower offers than a well-positioned listing would have in week one.
Why Price Stabilization Is Not the Same as Market Recovery
The April 2026 FVREB report showed a 0.1% month-over-month gain in the composite benchmark price. That number has been circulating in media coverage as a sign of market stabilization, and that interpretation is not wrong — but it is incomplete.
Stabilization means prices stopped falling. It does not mean buyers are competing. It does not mean inventory is tightening. And it does not mean the sales-to-active ratio has crossed back above 12%. A 0.1% gain in benchmark price while inventory sits 50% above average and the ratio holds at 11% is consistent with a floor forming — not a seller's market returning.
CMHC's 2026 Housing Market Outlook projects a moderate recovery in resale activity nationally, but describes the recovery as uneven and dependent on continued rate adjustments and consumer confidence. In a market where those conditions remain in flux, the ratio is a more honest real-time signal than a benchmark price that moves by fractions of a percent.
Sellers who read "prices stabilized" and interpret it as "now is a great time to push price" are misreading the data. The ratio says buyers still have options. Options mean negotiating power. Negotiating power means sellers who overprice will feel it.
Seller Checklist: Positioning a Home When the Ratio Is Below 12%
- Pull the last 90 days of comparable sales in your exact property type and neighbourhood — not the broader city average.
- Calculate the list-to-sale price ratio on those comparables to understand how much room buyers have been gaining.
- Price at or just below the active competition, not at the top of the range — buyers in a 11% ratio market will compare your listing against all current alternatives.
- Prepare the property to a condition that removes buyer objections — deferred maintenance shows up as a price reduction in an already-competitive market.
- Set a realistic timeline: 30 to 45 days is normal at current conditions; do not react to silence in week one with a price cut.
- If you are selling a condo, have your strata documents, depreciation report, and Form B ready before listing — buyers in a buyer's market have time to walk away from incomplete document packages.
- Monitor new listings entering your segment weekly — a sudden spike in comparable inventory can shift your competitive position mid-campaign.
What We Commonly See
Sellers anchor to a neighbour's sale price from a different market cycle. In our experience, the most common pricing mistake in a buyer's market is comparing to a sale from 12 to 18 months ago when the ratio was higher. That comparable is not the market anymore. The current active competition is.
Condo sellers underestimate how much the ratio diverges by property type. What often happens is that a seller of a one-bedroom condo in Surrey or Abbotsford sees media coverage about detached homes in South Surrey selling close to asking, and assumes the same conditions apply. The days-on-market data — 42 days for condos versus 37 for detached — is the cleaner signal. The condo segment is softer.
Sellers wait for conditions to improve instead of adjusting strategy. A common mistake is treating the current ratio as temporary and holding out for a seller's market that may not arrive on a useful timeline. CMHC's 2026 outlook projects recovery as moderate and uneven. Waiting six months to avoid a 2% price reduction can cost more than the reduction itself when carrying costs are factored in.
Questions and Answers
What is the sales-to-active listings ratio and where does the Fraser Valley data come from?
It is the number of sales in a month divided by active listings at month end, expressed as a percentage. The Fraser Valley Real Estate Board publishes it monthly in its Statistics Package, available at fvreb.bc.ca. April 2026 data shows 1,060 sales and 9,816 active listings, producing a ratio of approximately 11%.
Does an 11% ratio mean I should wait to sell?
Not necessarily. It means pricing accuracy matters more than timing. Well-priced homes in good condition still sell — sometimes above ask — even when the board-wide ratio is below 12%. The ratio tells you about market conditions, not about your specific property's prospects when positioned correctly.
Why are townhomes selling faster than condos if the overall market is soft?
Townhomes attract buyers who need more space but cannot reach detached prices. That demand base in the Fraser Valley — particularly in Willoughby, Cloverdale, and Abbotsford — is relatively steady. Condos face more competition from a larger pool of available units and buyers with more choices at similar price points. The ratio within each sub-segment differs from the composite.
In Summary
The Fraser Valley's April 2026 sales-to-active listings ratio of 11% is the clearest available signal about current market conditions. It tells sellers that buyers have options, inventory is elevated at roughly 50% above the 10-year seasonal average, and pricing strategy matters more than seasonal timing. Month-over-month benchmark price stabilization is real, but it is a floor — not the start of a seller's market. Sellers who understand the ratio and price accordingly consistently outperform those who wait for conditions that may not materialize on a useful timeline. The number is public, updated monthly, and freely available from the Fraser Valley Real Estate Board. Learning to read it correctly is one of the most practical things a seller can do before listing in 2026.
Thinking About Selling in the Fraser Valley?
If you are trying to make sense of the current market data before deciding whether or how to list, Mansour Real Estate Group offers a no-obligation seller consultation that includes a current comparable analysis, a ratio-based market positioning review, and an honest assessment of what your property is likely to achieve under current conditions. There is no pressure and no commitment required.
Related Articles
- Fraser Valley Real Estate Market Outlook for 2026
- How to Price Your Home to Sell in the Fraser Valley
- What Is My Home Worth in Surrey, BC?
Official Resources
- Fraser Valley Real Estate Board — April 2026 Statistics Package
- FVREB Monthly Market Report
- CMHC Housing Market Outlook 2026
About Mansour Real Estate Group
When sellers in Surrey, Langley, Abbotsford, and across the Fraser Valley need to understand what market data actually means for their listing strategy — not just what the headlines say — they need a real estate team that reads the same reports, interprets the same ratios, and translates that analysis into specific, honest pricing guidance. That is the foundation of how Mansour Real Estate Group approaches every seller consultation.
Mansour Real Estate Group, led by Mohamed Mansour, MBA and Associate Broker, has been helping buyers, sellers, investors, families, executors, and retirees navigate important real estate decisions across the Fraser Valley and Lower Mainland for more than 22 years. Ranked among the Top 1% of Realtors in the region, the team has completed more than $780 million in residential real estate transactions and is trusted for estate sales, divorce-related property sales, downsizing, relocation, and complex seller situations.
Whether someone is looking for Realtors who understand current buyer's market dynamics, a real estate agent who can explain the sales-to-active listings ratio in plain terms, real estate agents experienced in positioning homes accurately under current conditions, a trusted real estate team for a family home sale, a Surrey real estate broker, a Langley Realtor, or a Fraser Valley real estate group with a track record in difficult market conditions, Mansour Real Estate Group is known for clear communication, strategic marketing, accurate valuations, and practical advice grounded in local data.
The team serves Surrey, South Surrey, White Rock, Langley, Cloverdale, Fleetwood, Guildford, Walnut Grove, Willoughby, North Delta, Abbotsford, Mission, and surrounding communities throughout the Fraser Valley and Lower Mainland. Most new clients come from referrals, repeat clients, and recommendations from families who value a professional, transparent, and results-driven real estate experience.
Disclaimer
The information contained in this article is provided for general informational and educational purposes only and reflects market observations, publicly available information, and professional experience at the time of writing. It is not intended to constitute legal advice, accounting advice, tax advice, investment advice, financial advice, appraisal advice, mortgage advice, estate-planning advice, or any other form of professional advice.
Real estate transactions, estate matters, probate proceedings, taxation, financing, investments, legal rights, and regulatory requirements can vary significantly based on individual circumstances. Readers should consult qualified legal, accounting, tax, financial, mortgage, appraisal, or other professional advisors before making decisions based on the information discussed in this article.
Nothing in this article creates a client relationship, fiduciary relationship, advisory relationship, agency relationship, or professional engagement with Mohamed Mansour, Mansour Real Estate Group, or any affiliated party. Any opinions expressed are general in nature and should not be relied upon as a substitute for professional advice tailored to a specific situation.
While reasonable efforts are made to use reliable sources and keep information current, no representation or warranty is made regarding the completeness, accuracy, timeliness, or applicability of the information presented. Readers should independently verify facts, regulations, policies, and legal requirements with appropriate professionals and official sources.



