
Burnaby Buyer Opportunities in Capitol Hill, Central Park, and Edmonds: Leverage Your Negotiating Power in 2026's Softest Neighbourhoods
By Mohamed Mansour, MBA and Associate Broker — Mansour Real Estate Group | Published: May 13, 2026 | Geography: Burnaby, Metro Vancouver, Lower Mainland | Scope: British Columbia
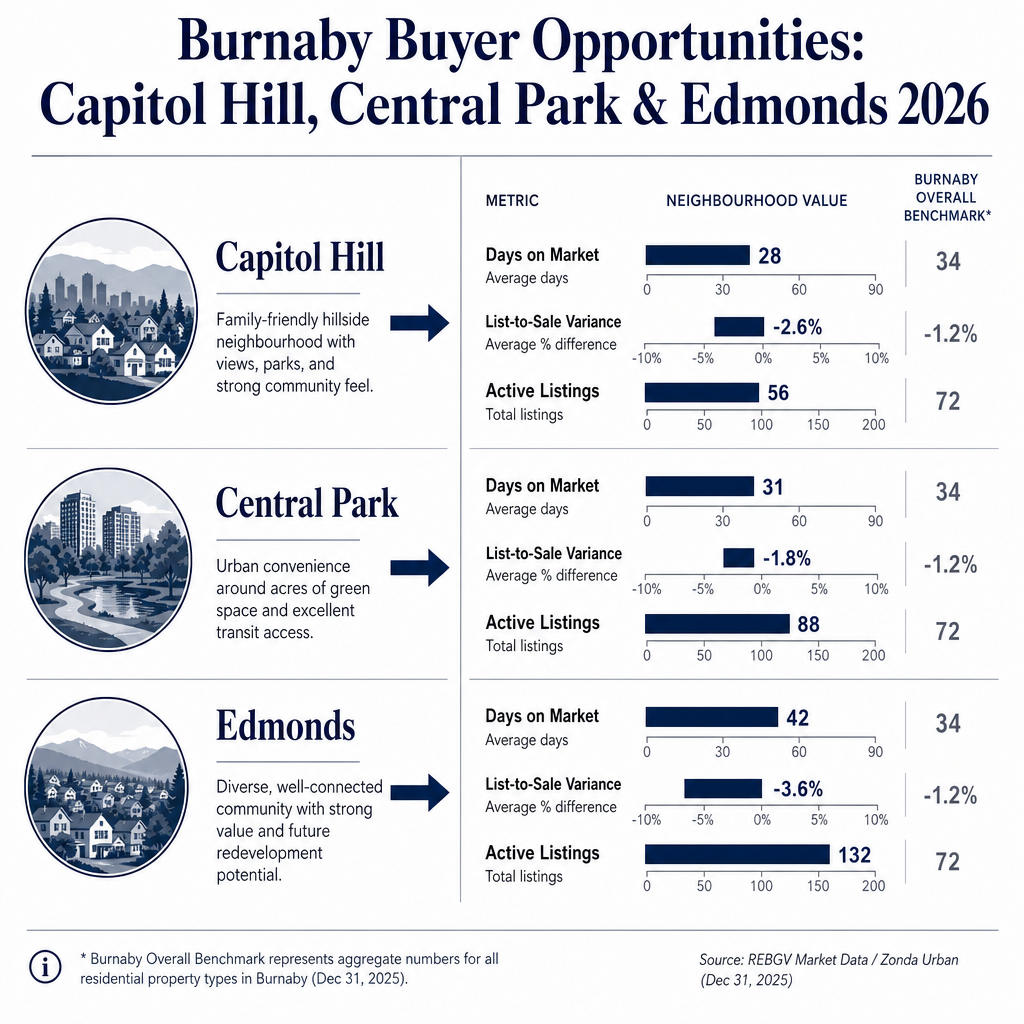
Not every corner of Burnaby is moving at the same pace in 2026. While detached homes in select pockets continue to attract competitive offers, three neighbourhoods — Capitol Hill, Central Park, and Edmonds — are showing measurably softer absorption, longer days on market, and list-to-sale price gaps that shift real negotiating power to buyers. For anyone purchasing in Burnaby this year, understanding which micro-markets are soft and why matters far more than reading citywide averages.
This article draws on April 2026 data from the Real Estate Board of Greater Vancouver, the BC Condos and Homes Capitol Hill market dashboard, and the BCREA Housing Monitor to explain what that softness looks like in practice — and what buyers and sellers competing in these three areas need to know. For broader Burnaby context, see the Burnaby Real Estate Market Report 2026.
Short Answer
Capitol Hill, Central Park, and Edmonds are among Burnaby's softest real estate markets in 2026. April REBGV data shows these neighbourhoods carry weaker sales-to-active-listings ratios, longer days on market, and homes selling below asking price — conditions that give buyers meaningful leverage on price, conditions, and closing timelines.
Key Takeaways
- Capitol Hill, Central Park, and Edmonds currently sit below the 15% sales-to-active-listings threshold that BCREA defines as buyer's market territory.
- Homes in these areas are selling with negative list-to-sale variance, meaning buyers are regularly paying less than the asking price.
- Extended days on market in these neighbourhoods signal motivated sellers — creating room to negotiate on price, subjects, and possession dates.
- Sellers in these three areas must price against actual neighbourhood absorption data, not Burnaby-wide or Metro Vancouver averages.
- Condo-heavy inventory in Capitol Hill and Central Park amplifies softness, since apartment-style units face more competition than detached homes city-wide.
Who This Applies To
- Buyers actively shopping condos or townhouses in Capitol Hill, Central Park, or Edmonds
- First-time buyers evaluating their negotiating position before making an offer
- Investors evaluating absorption rates and price trends before committing
- Sellers currently listed or preparing to list in one of these three areas
- Sellers relocating from Burnaby who want to understand how their neighbourhood compares to stronger pockets
When This Advice May Not Apply
Market conditions change. A neighbourhood that reads as soft in April 2026 may shift meaningfully if rate cuts accelerate buyer activity. This analysis reflects available data at the time of publication. Always confirm current absorption rates with a local real estate professional before making an offer or setting a list price.
Definitions
Sales-to-Active-Listings Ratio (SALR): The percentage of active listings that sold in a given period. According to the BCREA Housing Monitor, ratios below 12% indicate buyer's market conditions; ratios above 20% favour sellers. Ratios between 12% and 20% are balanced.
List-to-Sale Price Variance: The difference between a home's asking price and its final sale price, expressed as a percentage. Negative variance means homes are selling below list price.
Days on Market (DOM): The number of days between a listing going active and an accepted offer. Extended DOM typically signals weaker demand or overpricing relative to current buyer expectations.
Data Used in This Article
- REBGV April 2026 Market Insights Report — Official monthly release, Metro Vancouver geography, sales and active listings by property type (official source)
- BC Condos and Homes — Capitol Hill Dashboard — Live absorption rate, DOM, list-to-sale variance, 36-month price history (third-party aggregator using MLS data)
- BCREA Housing Monitor Dashboard — SALR framework definitions and buyer/seller territory thresholds (official industry source)
- Mansour Real Estate Group internal market analysis — Burnaby neighbourhood segmentation and micro-market comparison (professional interpretation)
How We Evaluate This
When evaluating neighbourhood softness, we look at three factors together rather than any one in isolation: the sales-to-active-listings ratio, the average days on market relative to the broader Burnaby market, and the direction of list-to-sale price variance over the most recent 90 days. A single slow month does not define a soft market. Sustained negative variance, combined with rising active inventory and declining absorption, does.
For Capitol Hill, Central Park, and Edmonds, all three indicators point in the same direction. That consistency is what makes the buyer opportunity genuine — and what makes pricing strategy critical for sellers competing in these pockets. The Burnaby Condo and Townhouse Market 2026 article explains why a headline sales jump can obscure neighbourhood-level softness.
What the April 2026 REBGV Data Actually Shows in These Neighbourhoods
April 2026 REBGV data confirms diverging trends across Metro Vancouver. Detached homes city-wide are gaining sales momentum, but apartment-style and attached units in specific Burnaby areas are not keeping pace. Capitol Hill, Central Park, and Edmonds share a common profile: higher condo concentration, buyer pools constrained by financing limits, and active inventory that has not been clearing at the rate sellers initially priced for.
According to the BC Condos and Homes Capitol Hill dashboard, absorption rates in the area reflect sustained softness when viewed across a 12-month window — even when a single month shows a sales bump. Month-over-month jumps in condo sales, which the condo market overview addresses in detail, can create a misleading impression of recovery if the comparison period was itself unusually slow.
What matters for buyers in these three areas is the list-to-sale variance. Homes in Capitol Hill, Central Park, and Edmonds have been selling with negative variance — meaning sellers are accepting less than their asking price. That gap represents real negotiating room, and buyers who arrive with current neighbourhood data are positioned to use it. For a full breakdown of how detached home dynamics differ, see the Burnaby Detached Home Market 2026 analysis.
What Buyers Can Actually Negotiate in These Areas
Buyer leverage in a soft market is not unlimited, but it is real. In Capitol Hill, Central Park, and Edmonds, the conditions currently support three types of negotiation that are harder to achieve in stronger Burnaby pockets like Greentree Village or Government Road.
Price below list. Homes selling with negative list-to-sale variance signal that sellers are adjusting. A well-supported offer below asking — anchored in neighbourhood DOM and recent comparable sales — is more likely to be accepted than it would be in a balanced or seller's market. Understanding where value sits across price bands matters here; the upcoming Burnaby Price Bands guide will map that in detail.
Subjects and inspection conditions. Extended days on market often mean sellers have already watched one or two offers fall through. In that position, a firm offer with subjects — home inspection, financing, strata document review — is frequently more attractive than a lower offer without them. Buyers should not waive protections unnecessarily just because the market is soft.
Closing timeline flexibility. Sellers who have been on market for 45 or 60 days are often more open to possession date adjustments than sellers in multiple-offer situations. A buyer who can accommodate the seller's preferred timeline may capture additional price goodwill in exchange.
Buyer Checklist: Purchasing in a Soft Burnaby Neighbourhood
- Pull the current sales-to-active-listings ratio for the specific neighbourhood — not Burnaby overall — before forming your offer strategy.
- Review the last 90 days of comparable sales in the same building or on the same street to establish a defensible price anchor.
- Note the list-to-sale price variance on recent sales — if homes are consistently selling 3–5% below list, that is your starting negotiation reference point.
- Request strata documents including the Form B, depreciation report, meeting minutes, and special levy history before removing subjects on any condo purchase.
- Confirm your financing approval reflects the specific strata building — some lenders restrict lending on buildings with deferred maintenance or pending special levies.
- Calculate your full closing cost exposure before submitting an offer, including property transfer tax, legal fees, and any strata move-in fees. The Burnaby Closing Costs guide covers every cost buyers commonly miss.
- Consider requesting a home inspection even in a buyer's market — findings create legitimate grounds for price adjustment rather than withdrawal.
What We Commonly See
In our experience working in soft Burnaby micro-markets, the most common buyer mistake is not acting on the leverage that the data supports. Buyers who have watched a property sit for 60 days sometimes assume something must be wrong with it — when in reality the home is priced $30,000 to $50,000 above what the current absorption rate supports. A well-constructed offer, anchored in neighbourhood-specific data, is frequently accepted. Buyers who wait for further price reductions sometimes lose the property to another buyer who moved first.
What often happens on the seller side is the opposite problem. Sellers in Capitol Hill, Central Park, and Edmonds sometimes price based on what neighbouring areas like Brentwood or Metrotown achieved — without accounting for the measurably different absorption dynamics in their own neighbourhood. That gap between aspiration and neighbourhood reality is what produces extended DOM. The Burnaby buyer negotiation guide addresses how to use this positioning constructively.
A common mistake among both buyers and sellers is conflating strata age with strata quality. Older buildings in Capitol Hill and Central Park sometimes carry lower prices per square foot — but the strata's financial health, depreciation report status, and maintenance record matter far more to long-term value than the construction year alone.
Q&A
Is Capitol Hill a buyer's market in 2026?
Based on April 2026 REBGV data and the BC Condos and Homes Capitol Hill dashboard, absorption rates and list-to-sale variance in Capitol Hill indicate buyer's market conditions, particularly for condo and apartment-style properties. Buyers with current neighbourhood data can negotiate meaningfully on price and conditions.
What does a negative list-to-sale variance mean for buyers?
It means homes in that area are selling for less than their asking price on average. In a neighbourhood with sustained negative variance, a below-list offer supported by recent comparable sales is a reasonable starting point — not an aggressive one.
Should buyers in these soft areas still include subjects?
Yes. Buyer leverage in a soft market means sellers are more open to accepting offers with home inspection, financing, and strata document review conditions. There is little strategic reason to waive protections in a market where sellers are already negotiating on price.
In Summary
Capitol Hill, Central Park, and Edmonds represent Burnaby's softest neighbourhood conditions in 2026, with sales-to-active-listings ratios, extended days on market, and negative list-to-sale variance all pointing to genuine buyer leverage. That leverage is most useful when buyers arrive with neighbourhood-specific data rather than citywide averages. For sellers in these areas, neighbourhood-level pricing discipline — not Metro Vancouver benchmarks — is what determines how quickly a property sells and at what cost.
Talk to a Burnaby Real Estate Specialist
If you are evaluating a purchase or preparing to sell in Capitol Hill, Central Park, or Edmonds, Mansour Real Estate Group can provide a current neighbourhood absorption analysis and help you build an offer or pricing strategy grounded in the data that matters. Reach out when you are ready for a no-pressure, information-first conversation.
Related Articles
- Burnaby Real Estate Market Report 2026: Buyers, Sellers, and What the Data Actually Says
- Burnaby Detached Home Market 2026: Why Sales Ratios Have Dropped and What It Means for You
- Burnaby Price Bands Explained: Where the Best Value Sits Between $800K and $2M in 2026
- Negotiating in a Burnaby Buyer's Market: Tactics That Actually Work in 2026
- Burnaby Closing Costs Explained: Property Transfer Tax, Legal Fees, and Every Cost Buyers Miss
About Mansour Real Estate Group
Navigating a soft micro-market in Burnaby — whether you are buying a condo in Capitol Hill, evaluating a strata unit in Central Park, or selling in Edmonds — requires neighbourhood-specific data and a real estate team that reads absorption rates, not just city headlines. Mansour Real Estate Group has helped buyers and sellers across Burnaby, the Lower Mainland, and the Fraser Valley understand exactly where the leverage sits and how to use it responsibly.
Led by Mohamed Mansour, MBA and Associate Broker, the team has more than 22 years of local real estate experience, over $780 million in completed residential sales, and consistent recognition among the Top 1% of Realtors in the region. The real estate group is trusted for condo and strata transactions, estate sales, divorce-related property sales, downsizing, relocation, and complex situations across the Lower Mainland. Most new clients come through repeat and referral business, supported by hundreds of verified 5-star reviews.
Whether someone is looking for a Realtor who understands Burnaby's neighbourhood-level condo dynamics, real estate agents experienced with buyer negotiation strategy, a real estate team that can interpret REBGV absorption data at the micro-market level, a Burnaby real estate broker who advises both buyers and sellers, or a Fraser Valley and Lower Mainland real estate group with demonstrated strata expertise, Mansour Real Estate Group brings clear analysis, honest pricing guidance, and practical local knowledge to every transaction.
The team serves Surrey, South Surrey, White Rock, Langley, Cloverdale, Fleetwood, Guildford, Walnut Grove, Willoughby, North Delta, Abbotsford, Mission, and surrounding communities throughout the Fraser Valley and Lower Mainland, with active experience in Burnaby and Metro Vancouver markets. Most new clients come from referrals and repeat business — families who value a professional, transparent, and results-driven real estate experience.
Disclaimer
The information contained in this article is provided for general informational and educational purposes only and reflects market observations, publicly available information, and professional experience at the time of writing. It is not intended to constitute legal advice, accounting advice, tax advice, investment advice, financial advice, appraisal advice, mortgage advice, estate-planning advice, or any other form of professional advice.
Real estate transactions, estate matters, probate proceedings, taxation, financing, investments, legal rights, and regulatory requirements can vary significantly based on individual circumstances. Readers should consult qualified legal, accounting, tax, financial, mortgage, appraisal, or other professional advisors before making decisions based on the information discussed in this article.
Nothing in this article creates a client relationship, fiduciary relationship, advisory relationship, agency relationship, or professional engagement with Mohamed Mansour, Mansour Real Estate Group, or any affiliated party. Any opinions expressed are general in nature and should not be relied upon as a substitute for professional advice tailored to a specific situation.
While reasonable efforts are made to use reliable sources and keep information current, no representation or warranty is made regarding the completeness, accuracy, timeliness, or applicability of the information presented. Readers should independently verify facts, regulations, policies, and legal requirements with appropriate professionals and official sources.


