

Surrey Real Estate Market Statistics Decoded 2026: What the $912,700 Benchmark, 10% Sales-to-Active Ratio, and 4–5 Months of Inventory Actually Mean for Buyers and Sellers
By Mohamed Mansour, MBA and Associate Broker | Mansour Real Estate Group | Published May 14, 2026 | Surrey, Fraser Valley, BC
Surrey's headline real estate statistics for April 2026 paint a picture that looks straightforward: a composite benchmark of $912,700, a 10% sales-to-active listings ratio, and four to five months of available inventory. Those three numbers are published monthly, quoted by media, and used by buyers and sellers to form major financial decisions. The problem is that none of them mean what most people think they mean.
This article decodes each metric by property type and explains the volume-price paradox that is currently generating conflicting signals across Surrey's market. Understanding the difference between the composite number and the segment-level reality is the single most important analytical step a buyer or seller can take before acting.
Short Answer
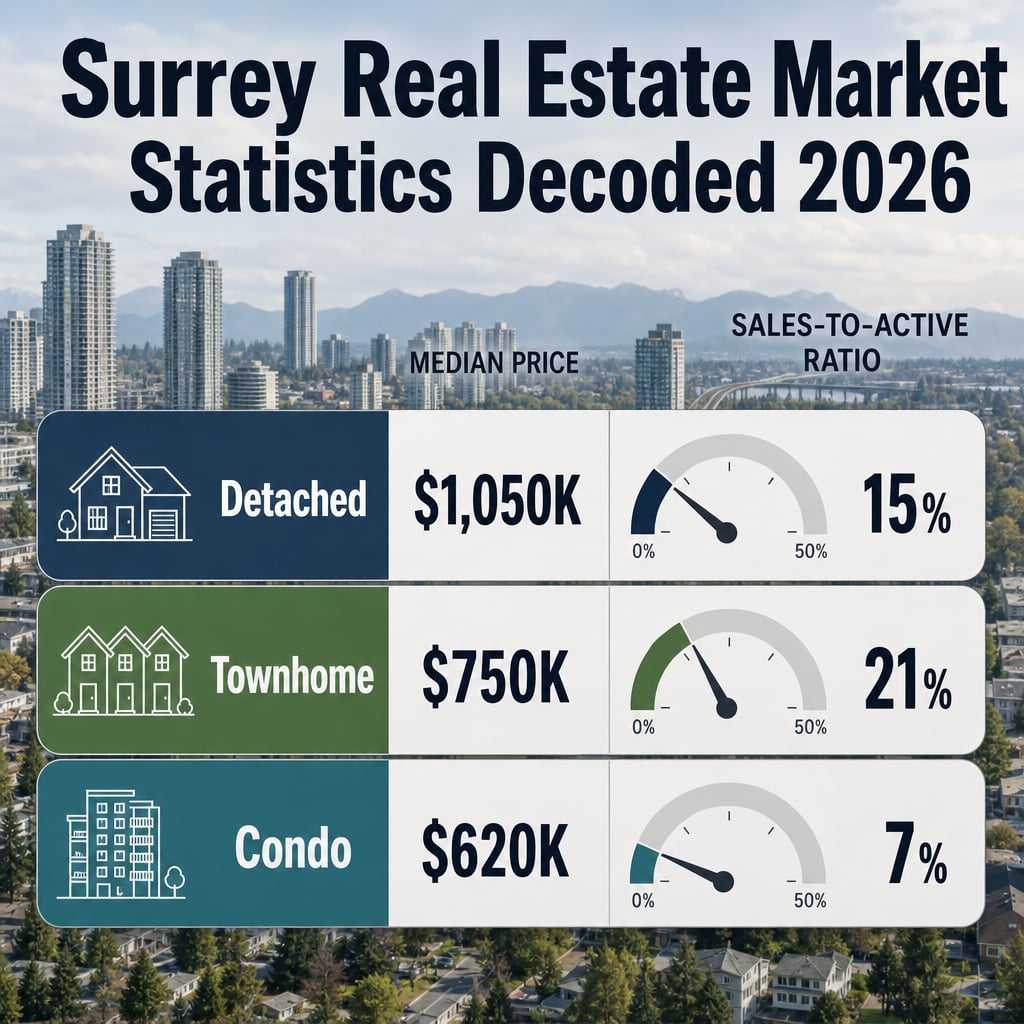
Surrey's $912,700 composite benchmark averages detached homes near $1,050,000, townhomes near $750,000, and condos near $620,000—three markets with completely different supply conditions and buyer demand. The aggregate statistics obscure those differences. Sellers and buyers who act on the composite rather than their specific property type and neighbourhood consistently make worse decisions.
Who This Applies To
- Surrey homeowners preparing to list a detached home, townhome, or condo in 2026
- Buyers comparing property types in Surrey and trying to understand their negotiating position
- Investors evaluating entry points in Surrey's condo or townhome segments
- Families moving from one property type to another within Surrey or from a neighbouring municipality
- Anyone who has read conflicting headlines about Surrey prices falling while sales rise
When This Advice May Not Apply
This analysis is most useful for standard MLS resale transactions. New construction pricing, pre-sale contracts, and rural properties on the periphery of Surrey's MLS area may behave differently from the segment benchmarks described here. Market conditions also shift month to month—readers should verify current figures with the Fraser Valley Real Estate Board before making decisions.
Data Used in This Article
- Fraser Valley Real Estate Board (FVREB): Surrey statistical releases, April 2026. Official board data.
- BC Real Estate Association (BCREA): Monthly market intelligence report, April 2026. Official industry body.
- Canadian Real Estate Association (CREA): Home Price Index methodology documentation. Official source for HPI construction and weighting.
- Mansour Real Estate Group: Internal MLS data analysis by property type and neighbourhood, Surrey, April 2026. Professional interpretation of segment-level data.
Key Takeaways
- Surrey's $912,700 composite benchmark masks a 40%-plus price gap between detached homes and condos.
- Townhomes in Surrey are in a seller's market; condos are in a strong buyer's market simultaneously.
- Sales volume rising 7% while composite prices fall 7.5% reflects entry-level detached demand, not broad recovery.
- Inventory of 4–5 months aggregates townhomes at under 3 months and condos above 6 months of supply.
- Pricing to the composite rather than the segment benchmark is the most common and costly seller mistake in 2026.
What the $912,700 Benchmark Actually Represents
The Home Price Index benchmark published by CREA and reported by the FVREB is not an average sale price. It is a quality-adjusted measure that tracks the theoretical price of a representative home over time, weighted by recent sales activity. In Surrey's case, that composite figure for April 2026 reflects approximately $1,050,000 for detached homes, $750,000 for townhomes, and $620,000 for condos—blended into a single number.
The weighting problem is significant. When detached sales volume rises—as it did in the first quarter of 2026—the HPI construction methodology applies greater weight to that segment, which can move the composite benchmark upward even as condo prices continue declining. A seller with a condo in Whalley or Guildford who prices against the $912,700 composite will overprice by a meaningful margin. A buyer for a townhome in Willoughby or Cloverdale who anchors to the same number will underestimate what sellers will accept.
The composite benchmark is useful for understanding long-term price trajectory in a general sense. It is not a reliable pricing reference for any individual transaction.
What the 10% Sales-to-Active Ratio Is Hiding
The sales-to-active listings ratio measures the percentage of active listings that sold within a given month. Industry convention places a market below 12% in buyer's market territory, between 12% and 20% in balanced conditions, and above 20% in seller's market conditions. Surrey's April 2026 composite of approximately 10% puts the overall market in buyer's territory.
The segment-level breakdown tells a different story. Based on FVREB data and Mansour Real Estate Group's internal MLS analysis for Surrey in April 2026, detached homes were trading at a sales-to-active ratio of approximately 12–15%—balanced-to-soft conditions where buyers have some negotiating room but well-priced properties are still moving. Townhomes were achieving 18–23%—genuine seller conditions where multiple-offer situations remain possible and days-on-market stays short. Condos were sitting at 6–8%—strong buyer leverage, longer days-on-market, and meaningful room to negotiate on price.
Selling a condo as though you are in a balanced market, or buying a townhome as though you have buyer leverage, are both costly misreads. The composite ratio does not support either assumption. For a deeper look at how each property type is performing and why, see Surrey Property Type Market Divergence 2026.
The Volume-Price Paradox: Why Sales Are Up 7% While Prices Are Down 7.5%
Surrey recorded approximately 7% more sales in April 2026 compared to April 2025, while the composite benchmark price fell roughly 7.5% over the same period. Media coverage of this combination has produced contradictory headlines—some calling it a recovery, others calling it continued decline. Both interpretations miss the mechanism.
The increase in sales volume is driven primarily by activity in the entry-level detached and townhome segments, where relative affordability compared to one and two years ago has brought buyers back into the market. The composite price decline, meanwhile, reflects sustained weakness in the condo segment—where oversupply, investor-driven listing activity, and financing constraints on buyers are holding prices down despite the board-wide sales increase.
Volume rising while prices fall is not a paradox when you understand that the sales gains and the price losses are happening in different segments. Treating it as a single market signal leads to incorrect conclusions. Buyers considering condos in Surrey should note that this environment—strong buyer leverage, motivated sellers, and price weakness—may represent a genuine entry opportunity. How Surrey compares to neighbouring markets in this context is examined in Surrey vs. Langley vs. Coquitlam vs. Richmond: Regional Price Divergence in 2026.
What 4–5 Months of Inventory Means by Property Type
Months of inventory measures how long it would take to sell all current active listings at the current pace of sales, assuming no new listings enter the market. Four to five months is the aggregate for Surrey. The segment breakdown matters more than the aggregate.
Based on FVREB data and Mansour Real Estate Group's segment analysis, townhomes in Surrey were sitting at approximately 2.5 to 3 months of inventory in April 2026—tight supply that supports firm pricing. Detached homes were near 4 months—balanced to slightly soft. Condos exceeded 6 months—a level that historically correlates with downward pricing pressure. The aggregate of 4–5 months is mathematically accurate and practically misleading. A condo seller operating with a 4-month inventory mindset will price above what the market will support. A townhome buyer operating with the same assumption will make an offer that does not reflect the competition that actually exists.
How We Evaluate This
When working with buyers and sellers in Surrey, Mansour Real Estate Group does not lead with composite statistics. The first step is identifying the property type, the specific neighbourhood within Surrey—whether Fleetwood, Guildford, Cloverdale, South Surrey, or Whalley—and the price band within that type. From there, the relevant sales-to-active ratio, months of inventory, days on market, and recent comparable sales are examined at the segment level. Composite figures serve as context, not as a pricing or negotiation tool. This approach consistently produces more accurate list price recommendations and more realistic buyer expectations than anchoring to board-level averages.
Surrey Market Analysis Checklist
- Identify your property type first—detached, townhome, or condo—before looking at any market statistics
- Request segment-level sales-to-active ratios from FVREB data or your real estate team, not composite figures
- Review comparable sales from the past 60 to 90 days within your specific property type and neighbourhood
- Check days-on-market averages for your segment—townhomes and condos currently diverge significantly
- Assess months of inventory for your property type against the 6-month threshold for buyer's market conditions
- Adjust your pricing or offer strategy based on segment conditions, not the $912,700 composite benchmark
What We Commonly See
Condo sellers anchoring to the composite benchmark. In our experience, the most frequent pricing mistake in Surrey's current market is a condo seller setting an asking price near or above the $912,700 composite, when their property type is trading well below $700,000 and sitting on the market with 6-plus months of competition. The result is extended days-on-market, price reductions, and ultimately a sale at a lower price than a correct initial list price would have achieved.
Townhome buyers assuming they have leverage they don't have. What often happens is that a buyer comes in expecting standard buyer's market negotiating room—5 to 10% below asking—because the headline statistics suggest a soft market. In well-located Surrey townhome segments, those offers are either rejected or result in competing situations the buyer did not anticipate. Correct segment analysis would have set realistic expectations from the start.
Treating volume growth as a recovery signal. A common misread of the current data is interpreting the 7% sales increase as market-wide momentum. In practice, the volume gain is concentrated in the entry-level detached and townhome categories. Condo absorption has not materially improved, and price weakness in that segment continues into mid-2026. Acting on the composite signal rather than the segment signal leads buyers and sellers to draw conclusions the data does not support.
Definitions
Home Price Index (HPI) Benchmark: A quality-adjusted price index published by CREA and reported by real estate boards. It tracks the theoretical price of a representative home over time, not average or median sale prices. Composite figures blend multiple property types and are weighted by recent sales volumes.
Sales-to-Active Listings Ratio: The number of sales in a month divided by the number of active listings. Below 12% signals a buyer's market; 12–20% is balanced; above 20% is a seller's market. Segment-level ratios differ significantly from composite figures.
Months of Inventory: How long it would take to sell all current active listings at the current monthly sales pace, with no new listings added. Under 3 months typically favours sellers. Over 6 months typically favours buyers.
Questions and Answers
Why does Surrey's composite benchmark price differ so much from what I see listed online?
The HPI benchmark is a quality-adjusted theoretical price for a representative property, not an average or median sale price. Active listing prices reflect seller expectations, which often exceed what the market will support, particularly in the condo segment. The benchmark tracks actual completed sales and adjusts for property characteristics.
Is Surrey currently a buyer's market or a seller's market?
Both, depending on property type. The townhome segment is in seller's market conditions. The condo segment is in a strong buyer's market. Detached homes sit in balanced-to-soft territory. A single answer to this question will be wrong for at least one of those segments.
Should a condo seller in Surrey wait for conditions to improve?
That depends on the seller's timeline, financial position, and the specific building and location. Condo inventory in Surrey exceeds 6 months, which typically produces continued downward pricing pressure. Sellers with flexibility may choose to wait, but waiting in an oversupplied segment does not guarantee improvement. Individual circumstances should drive that decision, ideally with current comparable data and professional guidance.
In Summary
Surrey's April 2026 composite statistics are real, official, and useful as a macro reference. They are not, by themselves, a reliable guide for pricing or negotiating any individual property transaction. The $912,700 benchmark, the 10% sales-to-active ratio, and the 4–5 months of inventory aggregate three segments with fundamentally different supply and demand conditions. Townhomes are tight; condos are oversupplied; detached homes are stabilizing. Sellers who price to the segment benchmark rather than the composite, and buyers who understand their actual leverage by property type, consistently make better decisions with better outcomes.
Thinking About Buying or Selling in Surrey?
If you would like a clear, property-type-specific read on where your home sits in the current Surrey market—or which segment offers the best entry point for your budget and goals—Mansour Real Estate Group is available for a straightforward conversation. No pressure, no obligation. Just accurate local context.
Related Articles
- Surrey Property Type Market Divergence 2026: Why Detached Homes Are Stabilizing While Condos Face Sustained Pricing Pressure
- Surrey vs. Langley vs. Coquitlam vs. Richmond: Regional Price Divergence in 2026
About Mansour Real Estate Group
When buyers and sellers in Surrey need to move past headline statistics and understand what the market is actually doing at the property-type and neighbourhood level, the value of working with an experienced local real estate team becomes clear. Mansour Real Estate Group provides exactly that kind of grounded, data-specific market interpretation—the kind that changes how clients price, negotiate, and decide.
Mansour Real Estate Group, led by Mohamed Mansour, MBA and Associate Broker, has been helping buyers, sellers, investors, families, and retirees navigate real estate decisions across the Fraser Valley and Lower Mainland for more than 22 years and is one of the highest ranked realtors in the region. The team has completed more than $780 million in residential real estate transactions and is trusted for seller strategy, accurate valuations, buyer representation, estate sales, downsizing, and complex transactions where market interpretation matters most.
Whether someone is looking for Realtors who understand Surrey's segmented market conditions, a real estate agent with direct experience in detached, townhome, and condo transactions across the Fraser Valley, real estate agents who can translate board statistics into actionable pricing guidance, a Surrey real estate broker for a complex situation, or a real estate group with deep neighbourhood knowledge across Fleetwood, Guildford, Cloverdale, South Surrey, and Willoughby—Mansour Real Estate Group is known for clear analysis, honest advice, and results-driven representation.
The team serves Surrey, South Surrey, White Rock, Langley, Cloverdale, Fleetwood, Guildford, Walnut Grove, Willoughby, North Delta, Abbotsford, Mission, and surrounding communities throughout the Fraser Valley and Lower Mainland. Most new clients come from referrals, repeat clients, and recommendations from families and investors who value accurate, transparent, professional real estate guidance.
Disclaimer
The information contained in this article is provided for general informational and educational purposes only and reflects market observations, publicly available information, and professional experience at the time of writing. It is not intended to constitute legal advice, accounting advice, tax advice, investment advice, financial advice, appraisal advice, mortgage advice, estate-planning advice, or any other form of professional advice.
Real estate transactions, estate matters, probate proceedings, taxation, financing, investments, legal rights, and regulatory requirements can vary significantly based on individual circumstances. Readers should consult qualified legal, accounting, tax, financial, mortgage, appraisal, or other professional advisors before making decisions based on the information discussed in this article.
Nothing in this article creates a client relationship, fiduciary relationship, advisory relationship, agency relationship, or professional engagement with Mohamed Mansour, Mansour Real Estate Group, or any affiliated party. Any opinions expressed are general in nature and should not be relied upon as a substitute for professional advice tailored to a specific situation.
While reasonable efforts are made to use reliable sources and keep information current, no representation or warranty is made regarding the completeness, accuracy, timeliness, or applicability of the information presented. Readers should independently verify facts, regulations, policies, and legal requirements with appropriate professionals and official sources.



