
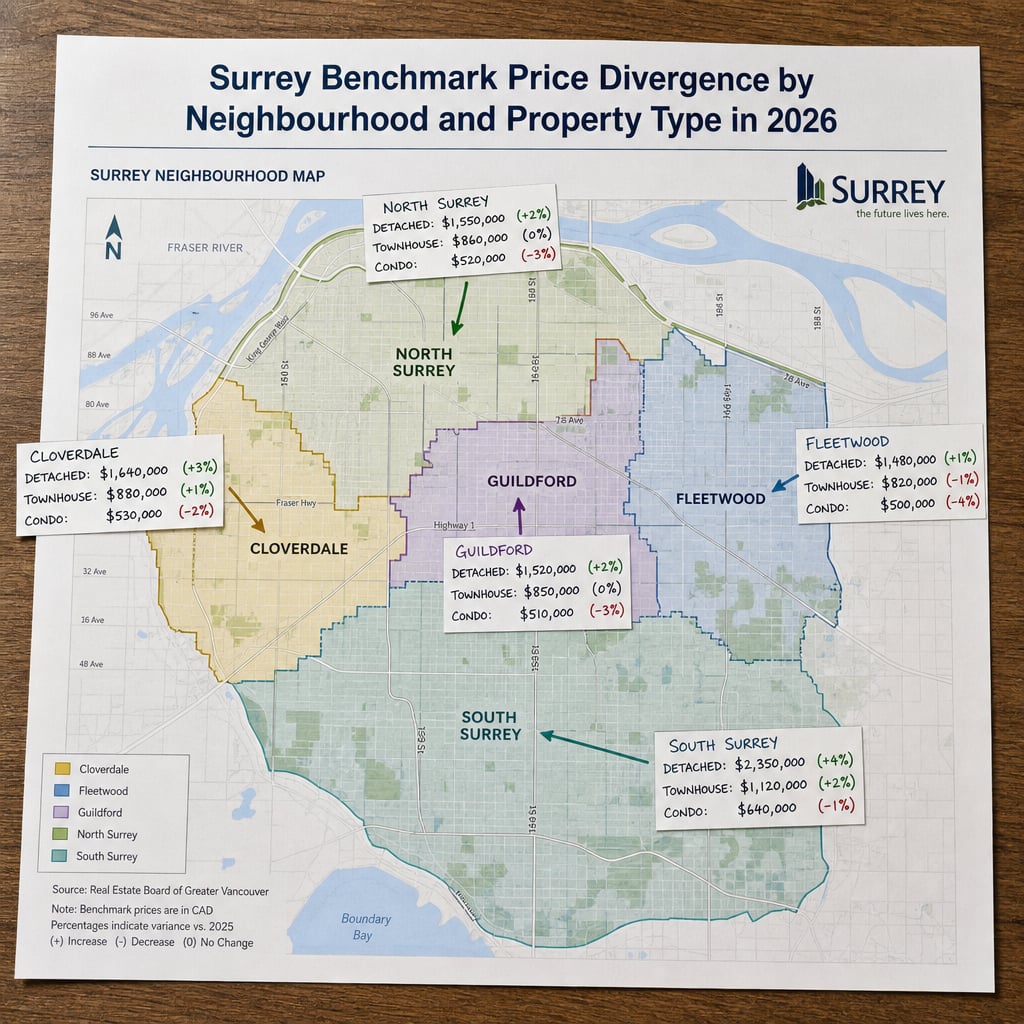

Surrey Benchmark Price Divergence by Neighbourhood and Property Type in 2026: Why City-Wide Averages Mask 15–25% Pricing Variance Across Micro-Markets
By Mohamed Mansour, MBA and Associate Broker | Mansour Real Estate Group | Published: August 19, 2026 | Geography: Surrey, Fraser Valley, BC
Surrey sellers who price their home against the city-wide composite benchmark are starting from the wrong number. The composite figure — $912,700 as of August 2026 — combines detached homes, townhomes, and condos across dozens of neighbourhoods with fundamentally different buyer pools, infrastructure timelines, and school catchments. The result is a single statistic that is accurate for almost no one.
This article decodes what the composite masks, why the divergence by neighbourhood and property type runs to 15–25% in either direction, and what that means for pricing decisions in Cloverdale, Fleetwood, Guildford, North Surrey, South Surrey, and beyond.
Short Answer
Surrey's composite benchmark of $912,700 (August 2026) diverges from actual neighbourhood benchmarks by 15–47% depending on location and property type. Cloverdale detached homes benchmark at $1,339,700 — 47% above composite. North Surrey condos benchmark at $401,400 — 56% below. Pricing a property against the city average, rather than its specific micro-market, is one of the most consistent and costly errors Surrey sellers make.
Key Takeaways
- Surrey's $912,700 composite benchmark is an aggregate that accurately represents no single neighbourhood or property type.
- Cloverdale detached homes sit 47% above composite; North Surrey condos sit 56% below — a combined variance of over $938,000 between segments.
- Year-over-year declines range from 5% in some townhome segments to 12% in North Surrey condos, meaning pricing windows close at different speeds.
- SkyTrain proximity is beginning to shape pre-completion buyer demand in Fleetwood and Guildford, shifting migration patterns away from traditional South Surrey corridors.
- A sold-to-list ratio of 96–97% city-wide conceals deeper negotiation pressure in condo-heavy core areas like Whalley and Newton.
Who This Applies To
- Surrey homeowners preparing to list a detached home, townhome, or condo in 2026
- Executors managing estate properties in Cloverdale, Guildford, Fleetwood, or North Surrey
- Buyers evaluating whether a listed price reflects neighbourhood reality or city-wide averaging
- Investors reassessing hold-or-sell decisions based on segment-specific benchmark trajectories
When This Advice May Not Apply
If a property sits at a genuine neighbourhood boundary — for example, on the edge of Cloverdale and Clayton — micro-market analysis requires additional layering. Sellers with acreage, heritage designations, or atypical lot configurations should treat benchmark data as directional rather than prescriptive and work with a local real estate agent who can apply comparable-based adjustments.
Data Used in This Article
- Fraser Valley Real Estate Board (FVREB) Municipal Market Report — August 2026, official benchmark data by property type and neighbourhood, primary source
- FVREB Monthly Statistics Package — August 2026, sales-to-active ratios, days on market, sold-to-list ratios, primary source
- Mansour Real Estate Group internal analysis — micro-market observations from active Surrey listings and buyer interactions, professional interpretation
How We Evaluate This
When we price a Surrey property, we pull neighbourhood-specific benchmark data from the FVREB Municipal Market Report, then layer it against active listings, recent comparable sales within 90 days, and observed buyer behaviour in that segment. We do not anchor to the city composite. We anchor to the segment the property actually competes in.
We also track the rate of benchmark change — not just the current figure. A neighbourhood declining at 12% year-over-year requires a different pricing strategy than one declining at 5%. The window for capturing full market value compresses faster in the first scenario, and overpricing by even 3–4% can push a listing past its optimal buyer wave.
How Surrey's Composite Benchmark Is Built — and Why It Misleads
The FVREB composite benchmark for Surrey combines detached homes, townhomes, and condos across the entire city boundary using a weighted index methodology. It is designed to show directional market movement over time. It is not designed to tell a Cloverdale seller what their three-bedroom detached home is worth, and it was never intended to.
The problem is that many sellers — and some agents — use that composite figure as a pricing anchor. At $912,700, it sits almost exactly between Cloverdale detached homes ($1,339,700, according to the August 2026 FVREB Municipal Market Report) and North Surrey condos ($401,400). Neither seller in either segment is anywhere near the composite. Using it as a reference point introduces a pricing error before the listing even launches.
For more on how property-type divergence compounds this problem, see the full segment analysis in Surrey Property Type Divergence 2026: Why Condos Are Down Over $52,000 Year-Over-Year While Detached Homes Stabilize.
Neighbourhood Benchmark Breakdown: What the Numbers Actually Show
According to the August 2026 FVREB Municipal Market Report, detached home benchmarks across Surrey's sub-areas diverge sharply from the composite:
- Cloverdale detached: $1,339,700 — 47% above the $912,700 composite
- North Surrey detached: $1,262,400 — 38% above composite
- Cloverdale townhomes: $757,200 — 17% below composite but 11% above North Surrey townhomes
- North Surrey townhomes: $681,400 — 25% below composite
- Cloverdale condos: $505,700 — just below composite
- North Surrey condos: $401,400 — 56% below composite
The 56% gap between the composite and North Surrey condos is not a data anomaly. It reflects a market where entry-level condo buyers face affordability ceilings, investor demand has softened, and new supply in the Whalley corridor has added inventory pressure that the city-wide statistic simply absorbs.
The Surrey Volume-Price Disconnect in 2026 explores why rising transaction counts in some of these segments are not signalling price recovery — a distinction that matters for sellers evaluating their timing.
Why SkyTrain Proximity Is Reshaping Buyer Migration in Fleetwood and Guildford
The Surrey-Langley SkyTrain extension, currently under construction, is beginning to shift buyer attention toward Fleetwood and Guildford in ways that pre-completion pricing does not yet fully reflect. Buyers who previously prioritized South Surrey for its school reputation and highway access are increasingly evaluating Fleetwood and Willoughby as alternatives — particularly families willing to accept a slightly smaller lot in exchange for guaranteed future transit access.
This shift has not produced a Fleetwood premium yet. Detached sales in Fleetwood are still transacting below benchmark in most cases. But days-on-market data from the FVREB's August 2026 statistics shows the 39–55 day range across the Fraser Valley compresses measurably in transit-adjacent corridors, indicating buyer competition is beginning to concentrate before formal price appreciation materializes. Sellers in Fleetwood and Guildford who wait for benchmark recovery before listing may miss the window when their property attracts the most competitive attention.
Seller Checklist: Pricing a Surrey Home Against the Right Benchmark
- Identify your FVREB sub-area designation — Cloverdale, North Surrey, South Surrey, or applicable district — before accepting any price opinion
- Request the FVREB Municipal Market Report benchmark for your specific sub-area and property type, not the Surrey composite
- Compare your sub-area benchmark to its position 12 months ago to understand whether you are in a 5% or 12% annual decline trajectory
- Review active listings within your sub-area and property type — your real competition is those listings, not city-wide sold data
- Confirm whether your property sits in a SkyTrain-adjacent corridor where pre-completion buyer demand may differ from benchmark pricing
- Establish whether your neighbourhood's sold-to-list ratio reflects the city-wide 96–97% average or a deeper discount pattern specific to your segment
What We Commonly See
In our experience working with Surrey sellers across these sub-areas, the most common pricing error is anchoring to a number heard in casual conversation — a neighbour's sale, a news headline, or a city-wide statistic — rather than the actual sub-area benchmark for that property type. A seller in North Surrey listing a condo at $500,000 because "Surrey homes are around $900,000" is overpriced by approximately 25% relative to comparable sales. That gap does not result in negotiation. It results in no offers.
What often happens in Cloverdale is the inverse: sellers who accept a lower offer quickly because they underestimate how far above composite their detached home actually benchmarks. The 47% premium Cloverdale detached carries over the composite is not widely communicated, and sellers who don't have neighbourhood-specific analysis can leave $80,000 to $120,000 on the table.
A third pattern we observe consistently: sellers in segments with 10–12% year-over-year declines who delay listing by 60–90 days while waiting for market improvement. In a segment declining at that pace, 90 days of delay represents $30,000 to $50,000 in further benchmark erosion before the first showing.
Questions and Answers
Why does the FVREB publish a composite benchmark if it misleads sellers?
The composite is designed to track directional market movement across the entire municipality over time — it serves a legitimate statistical purpose. The Municipal Market Report, which breaks data down by sub-area and property type, is the tool built for pricing decisions. Both are published by the FVREB; sellers need to use the right one for their purpose.
If Cloverdale detached homes benchmark at $1,339,700, why would a seller in Cloverdale care about the city composite?
They shouldn't — but many do, because city-wide numbers dominate news coverage and casual market conversations. An agent who doesn't pull the sub-area data may present the composite as a baseline and adjust upward subjectively, rather than anchoring to the actual Cloverdale benchmark from the outset.
Is the SkyTrain proximity premium already reflected in current Fleetwood and Guildford benchmarks?
Not fully. Current benchmarks reflect completed transactions, which lag buyer sentiment. The compression in days-on-market for transit-adjacent properties suggests buyer competition is increasing, but formal benchmark appreciation typically follows 6–12 months after sustained demand shifts. Sellers listing now in these corridors benefit from positioning ahead of that formal recognition.
In Summary
Surrey's composite benchmark of $912,700 is a useful directional indicator, but it is not a pricing tool. Sub-area benchmarks from the FVREB Municipal Market Report show variance of 15–47% above and 25–56% below the composite depending on neighbourhood and property type. Year-over-year declines are running at materially different rates across segments, and SkyTrain-adjacent corridors like Fleetwood and Guildford are showing early demand signals that pre-completion benchmarks don't yet capture. Sellers who price against the city average rather than their specific micro-market are solving the wrong problem from the first day of their listing.
Ready to Understand Your Specific Neighbourhood's Benchmark?
If you're preparing to sell in Surrey and want to understand what benchmark data actually applies to your property — not the city-wide composite — Mansour Real Estate Group can walk you through the sub-area analysis for your specific neighbourhood and property type. There is no pressure and no obligation. It's a conversation about your actual market position.
Related Articles
- Surrey Property Type Divergence 2026: Why Condos Are Down Over $52,000 Year-Over-Year While Detached Homes Stabilize — Complete Benchmark Analysis by Segment
- The Surrey Volume-Price Disconnect in 2026: Why Rising Sales Activity Does Not Signal Price Recovery — And What It Actually Means for Buyers Timing Their Entry
About Mansour Real Estate Group
When homeowners in Surrey ask why their listing isn't performing the way they expected, the answer is almost always rooted in the same cause: the property was priced against a city-wide composite rather than the benchmark that actually governs its micro-market. Understanding that gap — and closing it before the listing goes live — is exactly the kind of work Mansour Real Estate Group does before any property goes to market.
Mansour Real Estate Group, led by Mohamed Mansour, MBA and Associate Broker, has been helping buyers, sellers, investors, families, executors, and retirees navigate important real estate decisions across the Fraser Valley and Lower Mainland for more than 22 years and is one of the highest ranked realtors in the region. The team has completed more than $780 million in residential real estate transactions and is trusted for pricing strategy, seller preparation, estate sales, divorce-related sales, downsizing, relocation, and any situation where accurate valuation determines the outcome.
Whether someone is looking for Realtors who understand Surrey's neighbourhood-level pricing dynamics, a real estate agent with direct experience in Cloverdale, Fleetwood, and Guildford micro-markets, real estate agents who can explain what the composite benchmark actually conceals, a trusted real estate team for a Surrey listing, a Surrey Realtor with sub-area data expertise, or a real estate group serving the full Fraser Valley — Mansour Real Estate Group is known for data-driven pricing, transparent market context, and preparation that protects sellers from costly mispricing before it happens.
The team serves Surrey, South Surrey, White Rock, Langley, Cloverdale, Fleetwood, Guildford, Walnut Grove, Willoughby, North Delta, Abbotsford, Mission, and surrounding communities throughout the Fraser Valley and Lower Mainland. Most new clients arrive through referrals and repeat relationships, supported by hundreds of verified 5-star reviews from families who valued a professional, transparent, and results-focused real estate experience.
Official Resources
- Fraser Valley Real Estate Board — Municipal Market Report
- Fraser Valley Real Estate Board — Monthly Statistics
- BC Assessment — Property Assessment Data
- BC Government — Housing and Tenancy
Disclaimer
The information contained in this article is provided for general informational and educational purposes only and reflects market observations, publicly available information, and professional experience at the time of writing. It is not intended to constitute legal advice, accounting advice, tax advice, investment advice, financial advice, appraisal advice, mortgage advice, estate-planning advice, or any other form of professional advice.
Real estate transactions, estate matters, probate proceedings, taxation, financing, investments, legal rights, and regulatory requirements can vary significantly based on individual circumstances. Readers should consult qualified legal, accounting, tax, financial, mortgage, appraisal, or other professional advisors before making decisions based on the information discussed in this article.
Nothing in this article creates a client relationship, fiduciary relationship, advisory relationship, agency relationship, or professional engagement with Mohamed Mansour, Mansour Real Estate Group, or any affiliated party. Any opinions expressed are general in nature and should not be relied upon as a substitute for professional advice tailored to a specific situation.
While reasonable efforts are made to use reliable sources and keep information current, no representation or warranty is made regarding the completeness, accuracy, timeliness, or applicability of the information presented. Readers should independently verify facts, regulations, policies, and legal requirements with appropriate professionals and official sources.



